

Briefly: in our opinion, full (300% of the regular position size) speculative short positions in junior mining stocks are justified from the risk/reward point of view at the moment of publishing this Alert.
The changes that we saw on the charts yesterday were not enough to change anything that I described yesterday, so those comments remain up-to-date. Also, what I covered during yesterday’s live event (I combined the live market analysis with the presentation about the top 3 gold trading techniques – you can see the recording here) remains up-to-date at the moment of writing these words.
So far today, gold and silver have moved a bit lower, while the USD Index moved a bit higher (chart courtesy of https://goldpriceforecast.com).
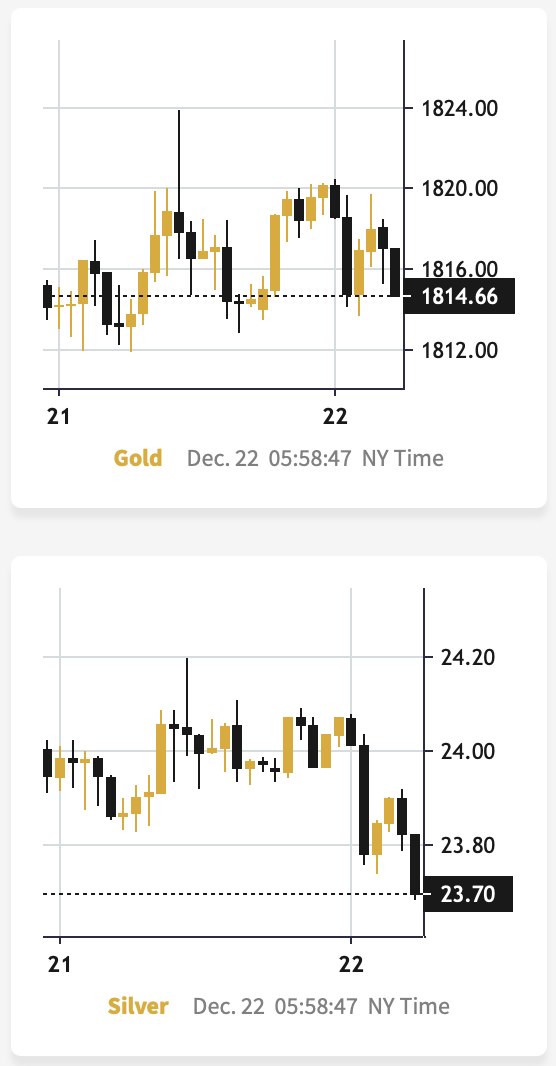
After yesterday’s intraday reversal, both precious metals moved lower. The silver price once again failed to move above the $24 level.
And the USD Index?
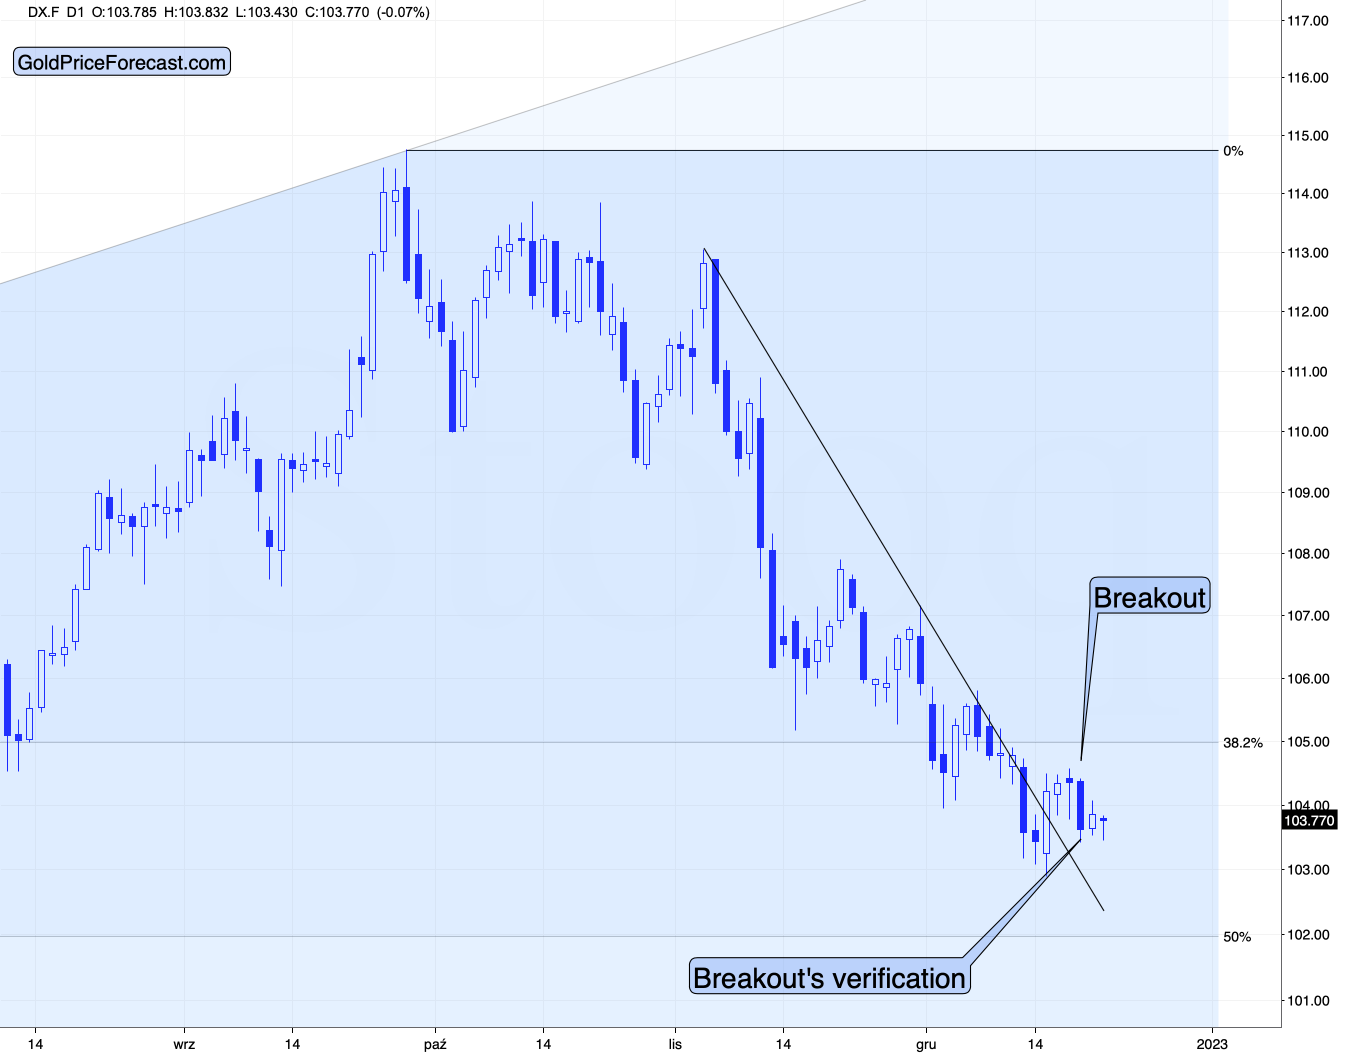
At the moment of writing these words, it’s after an overnight reversal and after a confirmed breakout above its declining resistance line.
This means that it’s now likely to move higher.
Please keep in mind that both markets, the USDX and the precious metals market, have been very strongly negatively correlated recently (with the exception of the very recent yen-related turmoil). Consequently, analyzing the gold price, USDX, and their correlation implies very bearish implications for the PMs and miners.
From the long-term point of view, it’s clear that the long-term support remains intact. The relatively small move lower that we saw this week didn’t take the USDX to new short-term lows.
There was no breakdown below the 2016 and 2020 highs in terms of the closing prices, which means that the odds for a turnaround and a rally are very high.
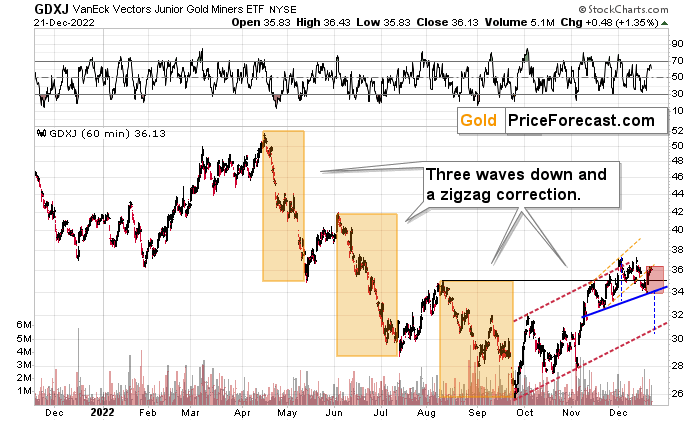
Meanwhile, junior gold and silver mining stocks moved a bit higher yesterday, but they haven’t moved above the lower border of the accelerated trend channel (marked with orange). This means that this week’s upswing was likely just a verification of the breakdown below it.
Interestingly, if we see a decline soon, which is likely, it could become the right shoulder of a potential head-and-shoulders pattern. I marked the theoretical right shoulder with a red rectangle and the neck level with a blue rectangle.
In short, when we see a confirmed breakdown below $34 in the GDXJ, we’re likely to see a move even lower – to $30.5 or so. Then, I’d expect to see something similar to what we saw in August, earlier this year – a small correction that is followed by another decline.
This time, however, I think that the medium-term decline will be much bigger than what we saw in the middle of the year. This is based not just on the bullish medium-term outlook for the USD Index but also on the analogies in gold price, silver price, and precious metals mining stocks: to 2013 and 2008. It seems that the history is rhyming, and the correction right before the biggest slide appears to be over or about to be over. I’ll discuss more details in tomorrow’s analysis.
Having said that, let’s take a look at the market from a more fundamental point of view.
The Hawks Are Coming for Gold
Seasonality and short-covering had investors in an optimistic mood on Dec. 21, even as the fundamentals continue to deteriorate. Moreover, while the current narrative suggests that the U.S. federal funds rate (FFR) is near its peak and rate cuts will commence in 2023, North American central banks are far from solving their inflation problem.
For example, we noted that due to their geographical proximity and trade relationship, the U.S. and Canada often enact similar monetary policies; and with Canadian inflation remaining resilient in November, the Bank of Canada’s (BoC) expectations contrast the fundamental realities. To explain, we wrote on Dec. 8:
While the BoC cited “excess demand” and “unemployment near historic lows,” and in the next breath, questioned “whether the policy interest rate needs to rise further,” the contradiction highlights the conundrum confronting North American central banks. With some areas of their economies running too hot, while others are too cold, they want to have their cake and eat it too.
However, the reality is that supporting growth encourages inflation, and history shows the gambit ends in a recession regardless of what they do; and while the BoC (and maybe the Fed next week) thinks the overnight lending rate could peak at 4.25%, we believe the central bank materially underestimates the challenges that lie ahead.
To that point, the Canadian Consumer Price Index (CPI) came in at 6.8% year-over-year (YoY) on Dec. 21 and outperformed the consensus estimate of 6.7% YoY.
Please see below:
 Source: Investing.com
Furthermore, the official press release showed that inflation accelerated across five of the eight components.
Please see below:
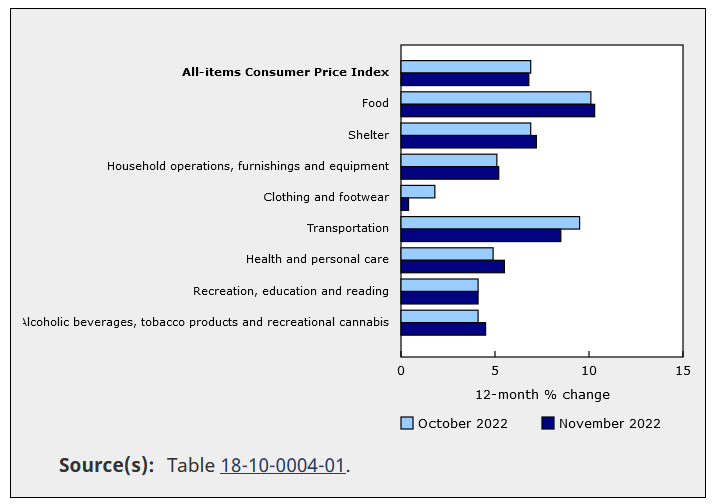 Source: Statistics Canada
To explain, the dark blue bars above show that food, shelter, household, health and alcohol/tobacco products were more expensive on a YoY basis in November. As a result, while the overall CPI declined by 0.10%, "gasoline prices fell 3.6% in November following a 9.2% increase in October."
In addition, "excluding food and energy, prices rose 5.4% on a yearly basis in November, following a gain of 5.3% in October." Thus, Canada's core CPI increased in November, and gold has not priced in the hawkish ramifications of resilient inflation.
Likewise, we have noted on numerous occasions that a sharp deceleration in the U.S. labor market is necessary for a dovish pivot. In a nutshell: as long as employment demand outweighs supply, wage and output inflation will remain elevated, and the FFR will need to rise more.
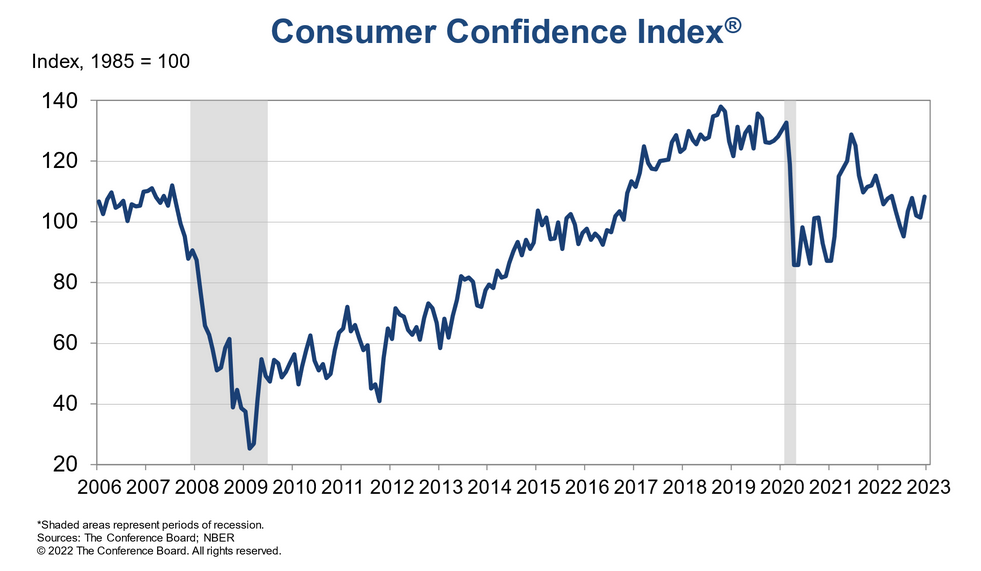
Well, with The Conference Board releasing its Consumer Confidence Index on Dec. 21, the results were hawkish. Lynn Franco, Senior Director of Economic Indicators at The Conference Board, said:
“Consumer confidence bounced back in December, reversing consecutive declines in October and November to reach its highest level since April 2022. The Present Situation and Expectations Indexes improved due to consumers’ more favorable view regarding the economy and jobs. Inflation expectations retreated in December to their lowest level since September 2021, with recent declines in gas prices a major impetus.”
So, while lower oil & gas prices alleviated some of the inflation pressures in November, their drawdowns stemmed from misguided recession fears. Yet, the development spurred consumer confidence and only increases Americans’ ability to spend money on discretionary items.
Please see below:
More importantly, the report stated:
“47.8% of consumers said jobs were ‘plentiful,’ up from 45.2%,” while “12.0% of consumers said jobs were ‘hard to get,’ down from 13.7%.”
Please see below:
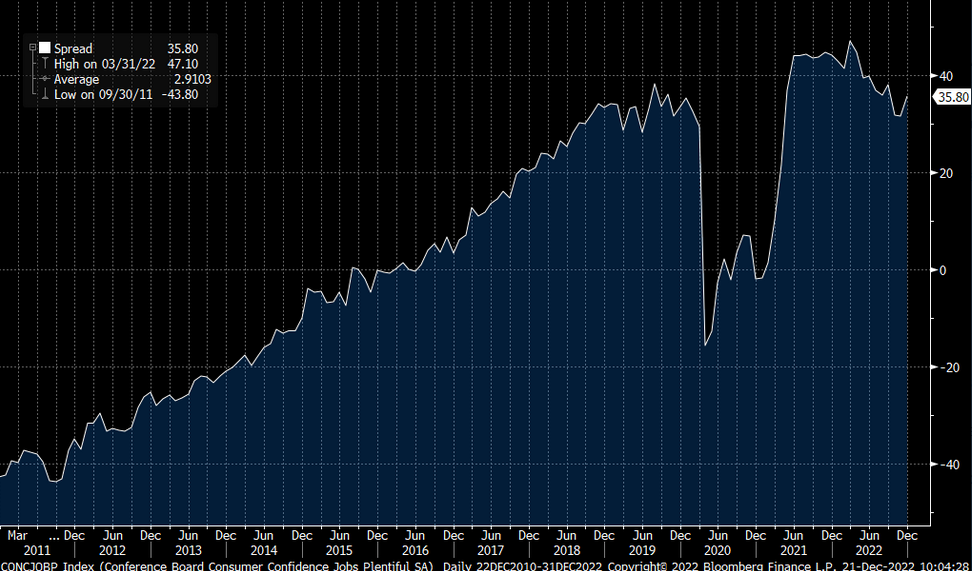
To explain, the white line above tracks the spread between jobs are ‘plentiful” and ‘hard to get’ responses. When the white line rises, it means that Americans view the U.S. labor market as more prosperous.
If you analyze the right side of the chart, you can see that the white line has risen recently and remains highly elevated. As such, while job openings have declined slightly and wage inflation accelerated in November, the Fed’s 17 25 basis point rate hikes in 2022 have not created the demand destruction necessary to reduce inflation. Therefore, the FFR needs to rise more than currently expected.
As further evidence, wage inflation is the canary in the coal mine because Americans can afford price increases that much their salary increases; and if wages are running at 5%+, Americans can afford 5%+ output inflation. Consequently, the U.S. labor market imbalance does not support a 2% inflation rate anytime soon.
Please see below:
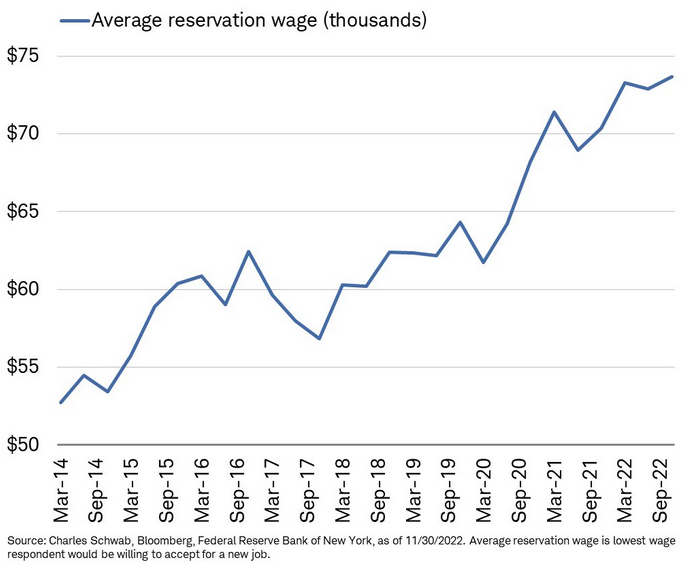
To explain, the blue line above tracks the average reservation wage expected by Americans in the New York Fed’s latest Labor Market Survey. For context, the metric tracks the lowest average salary respondents will accept for a new job.
If you analyze the trajectory, you can see that the blue line increased from roughly $64,000 in January 2020 to roughly $74,000 in November 2022, which is a 15.6% increase from its pre-pandemic level. Thus, the crowd is uninformed about the economic weakness required to win this battle.
As further evidence, the New York Fed’s survey showed that fewer Americans are searching for work than in July, more are satisfied with their compensation, and expected earnings hit a new series high.
Please see below:
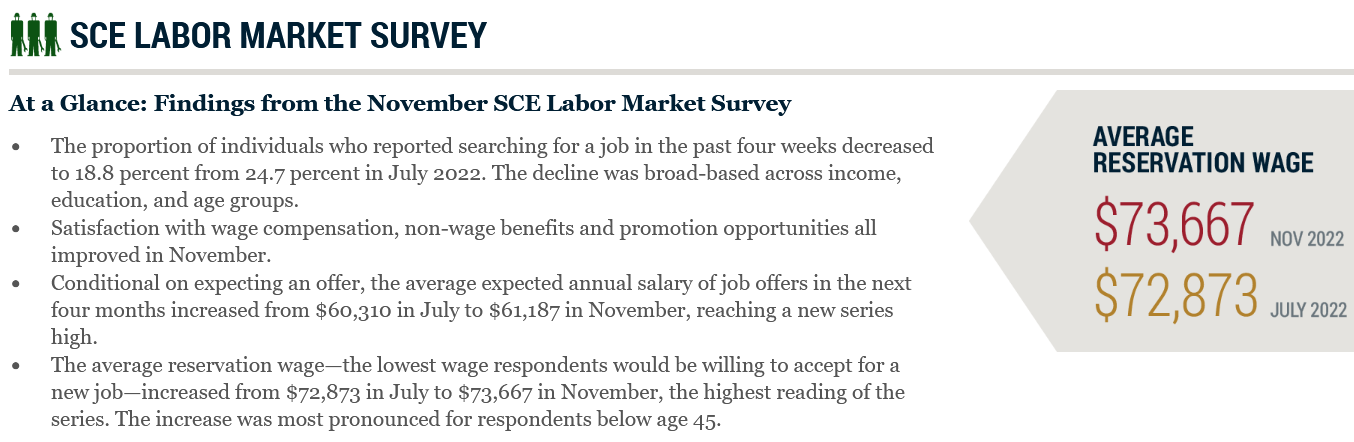 Source: New York Fed
So, with less Americans looking for work and employees expecting higher salaries, the developments are highly inflationary. Furthermore, the fact that these metrics are still diverging despite the FFR’s meteoric rise in 2022 highlights the challenges confronting risk assets in 2022.
Remember, nine of the last 10 inflation fights ended with recessions since 1948; and if inflation was easy to defeat, the historical ramifications wouldn’t be so ominous. In addition, we warned that the FFR has eclipsed the peak YoY core CPI in every inflation fight since 1961. Likewise, since the YoY core CPI peaked (for now) at 6.66% in September 2022, the historically-implied peak FFR is at least 6.67%.
Overall, investors believe inflation will subside with little economic damage, and this misguided optimism uplifts gold, silver and mining stocks. But, a realization requires the Fed to accomplish something it’s only done once since 1948, and as it relates to a lower FFR than the peak YoY core CPI, something it’s never done. Therefore, we’re happy to take the other side of the trade.
Silver Sits Out the S&P 500’s Upswing
As hawkish economic data shift sentiment across the financial markets, seasonality is the last hope for the S&P 500 bulls. Yet, while the index is down noticeably from its November high, silver has continued its bullish run. However, with the ramifications of a higher FFR, higher real yields, a stronger USD Index and tighter financial conditions poised to bite in 2023, it could be a long way down before silver finds a lasting bottom.
To explain, we wrote on Dec. 15:
 Source: Bloomberg/ZeroHedge
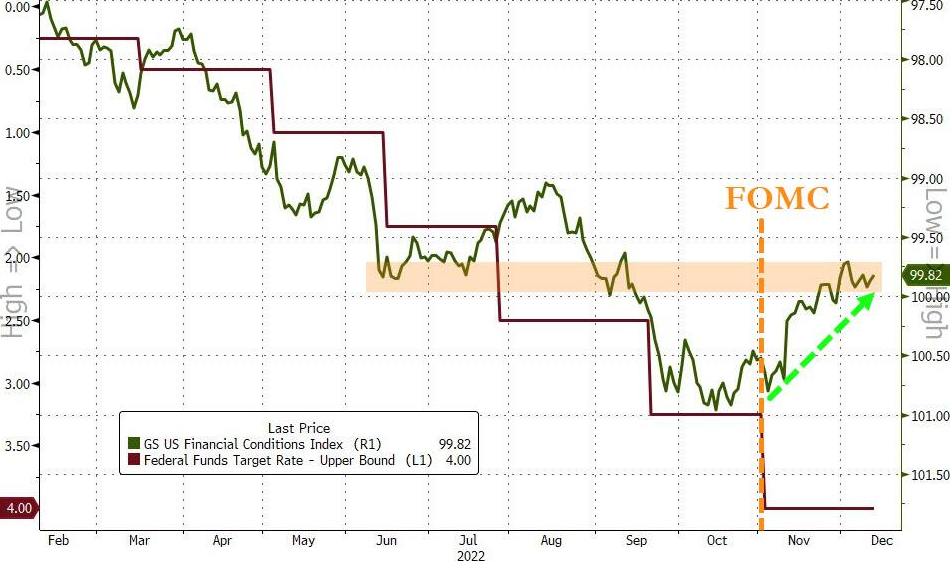
The dark red line above tracks the FFR, while the green line above tracks Goldman Sachs U.S. Financial Conditions Index (FCI). For context, both scales are inverted, and falling lines represent a higher FFR and tighter financial conditions.
If you analyze the relationship, you can see that a higher FFR resulted in tighter financial conditions, which meant financial markets aided the Fed in its inflation fight.
In contrast, the green line's rise on the right side of the chart demonstrates how higher stock prices, lower interest rates, a weaker U.S. dollar and smaller credit spreads support inflation and make the Fed's job harder. Again, that's why investors' hopes for a dovish pivot actually reduce the chances of one occurring.
So, the more the markets dissent, the more inflation will reign, and the higher the Fed will need to push the FFR. As a result, don't be surprised if economic reality haunts the pivot bulls in the months ahead.
To that point, while the silver price behaves as if QE is on the horizon, the U.S. 10-Year real yield has risen materially in December, and financial conditions are poised for another sharp run.
Please see below:
 Source: Bloomberg/ZeroHedge
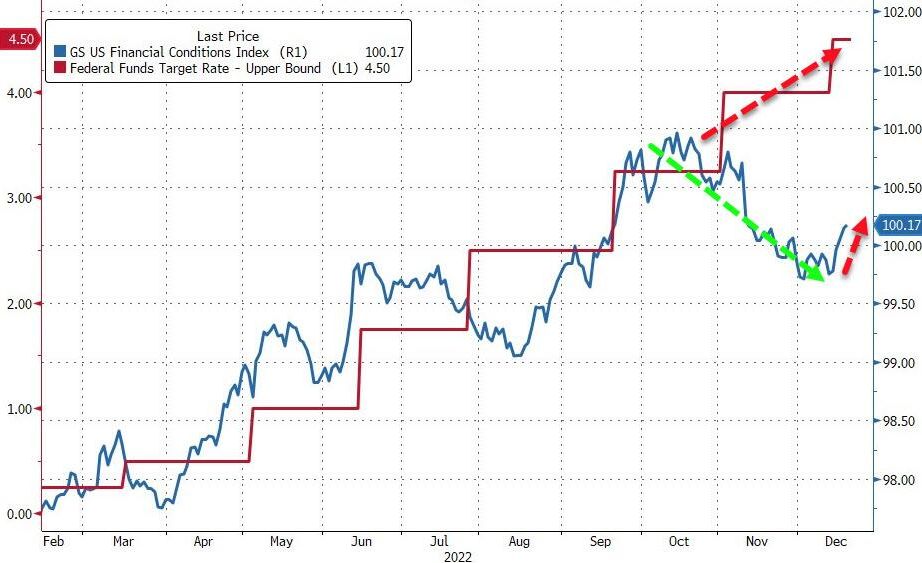
To explain, the FFR-FCI chart above is identical to the original, only ZeroHedge flipped the scales and they’re not inverted. If you analyze the right side of the chart, you can see that the blue line (FCI) has bounced off its recent low as tighter financial conditions seep into the financial markets.
Moreover, notice how the FCI experienced several short-term pullbacks on its way to new medium-term highs? Well, this iteration should be no different.
With the consensus still underestimating the Fed’s inflation fight, the FFR should continue its ascent in the months ahead; and since the metric is bullish for the FCI, it’s likely only a matter of time before the pair reconnect at higher levels.
In contrast, silver is priced as if the opposite will happen, as the white metal’s rise implies that the FCI and the FFR are about to fall. But, the Fed needs tighter financial conditions to curb inflation, and a lower FCI is antithetical to that goal.
Therefore, while the Bank of Japan’s (BOJ) policy shock helped uplift the PMs, it’s a short-term distraction that holds little weight over the medium term. Conversely, we noted that nine of the last 10 inflation fights have ended with recessions since 1948; and with the S&P 500 often hitting new lows when recessions materialize, the painful process of reducing inflation should weigh on the silver price in 2023.
Please see below:
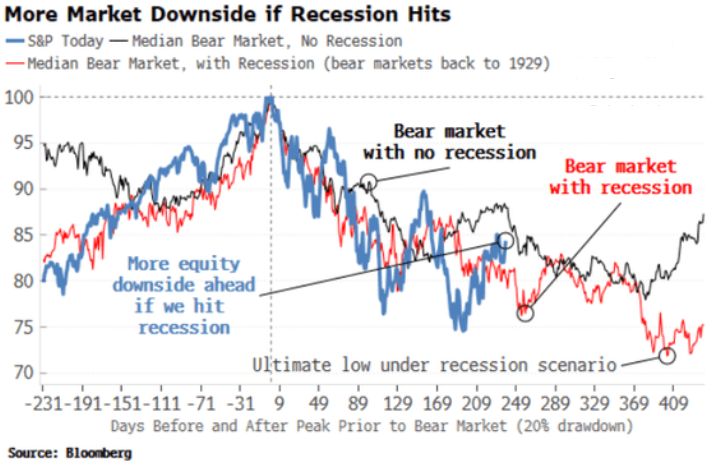
To explain, the blue line above tracks the current performance of the S&P 500, while the black line above tracks the median bear market performance when the U.S. economy avoids a recession. As you can see, 20% declines are erased rather quickly when a soft landing unfolds.
Conversely, the red line above highlights the median S&P 500 performance when bear markets culminated with recessions. If you analyze the right side of the chart, you can see that a final sell-off often emerges before a medium-term low is established. As a result, if a liquidation event confronts the index in 2023, the silver price will likely go down with the ship.
Furthermore, while bullish seasonality and a lack of short-term downside catalysts keep risk assets elevated, that should change dramatically as the Fed’s inflation fight continues.
Please see below:
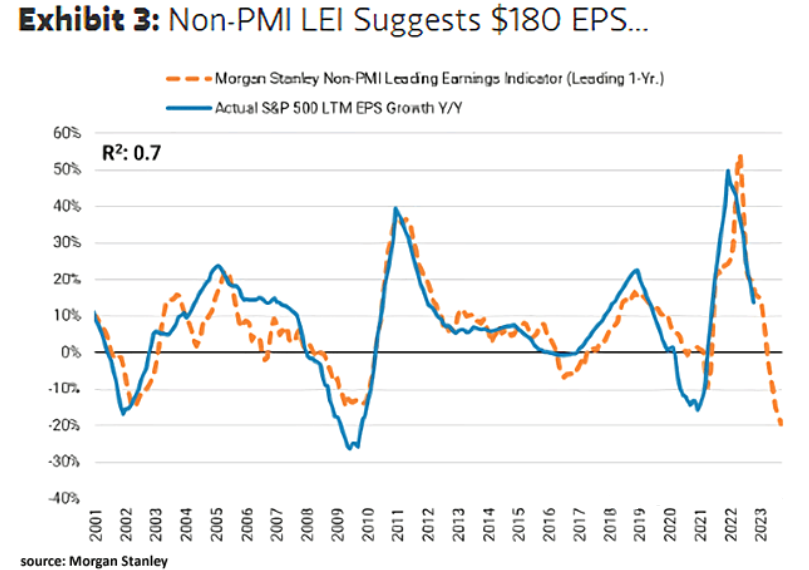
To explain, the blue line above tracks the YoY percentage change in S&P 500 realized earnings per share (EPS), while the dashed orange line above tracks the model estimate from Morgan Stanley's non-PMI Leading Earnings Indicator.
If you analyze the relationship, you can see that the model has been quite accurate over the last ~20 years. Moreover, the dashed orange line's descent on the right side of the chart predicts a ~20% YoY decline in S&P 500 EPS in 2023, which rivals the ~17% and ~27% drops from the 2020 pandemic and the 2008 global financial crisis (GFC).
Consequently, if a recession hits, and the S&P 500's EPS falls by ~20%, do you think the silver price will remain uplifted?
Overall, the price action has clouded investors' judgment, as they assume that silver's ascent signals the fundamental all-clear. Yet, the white metal's rally has been driven by momentum, and has occurred despite the worsening economic backdrop. So, while a weaker USD Index helps, U.S. real yields have risen, and the FFR is still well below the historically-implied levels required to normalize inflation. As such, an abrupt end to silver's party should occur in 2023.
The Bottom Line
The bulls still hope for a Santa Clause rally, as pushing prices higher helps offset some of their poor 2022 performance. However, while sentiment and momentum can accomplish this goal, wishful thinking does not impact the fundamentals. Therefore, when inflation is high, wages are running hot, and rate hikes plus quantitative tightening (QT) continue, the economic backdrop is not bullish for risk assets.
Furthermore, while the crowd assumes otherwise, Tesla CEO Elon Musk explained the dynamic “in simple terms” when a shareholder complained about the stock’s decline; and his words should prove prescient in the months ahead.
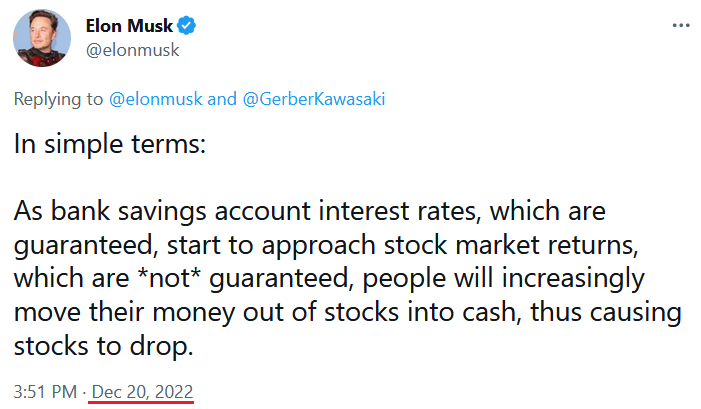 Source: Twitter
In conclusion, the PMs were mixed on Dec. 21, as the white metal didn't follow the S&P 500 higher. But, gold, silver and mining stocks are materially overvalued, and they're pricing in a fairy-tale ending that's unlikely to materialize. Thus, we expect significant drawdowns in 2023.
Overview of the Upcoming Part of the Decline
- It seems to me that the corrective upswing is over (or about to be over) and that the next big move lower is already underway (or that it’s about to start).
- If we see a situation where miners slide in a meaningful and volatile way while silver doesn’t (it just declines moderately), I plan to – once again – switch from short positions in miners to short positions in silver. At this time, it’s too early to say at what price levels this could take place and if we get this kind of opportunity at all – perhaps with gold prices close to $1,500 - $1,550.
- I plan to switch from the short positions in junior mining stocks or silver (whichever I’ll have at that moment) to long positions in junior mining stocks when gold / mining stocks move to their 2020 lows (approximately). While I’m probably not going to write about it at this stage yet, this is when some investors might consider getting back in with their long-term investing capital (or perhaps 1/3 or 1/2 thereof).
- I plan to return to short positions in junior mining stocks after a rebound – and the rebound could take gold from about $1,450 to about $1,550, and it could take the GDXJ from about $20 to about $24. In other words, I’m currently planning to go long when GDXJ is close to $20 (which might take place when gold is close to $1,450), and I’m planning to exit this long position and re-enter the short position once we see a corrective rally to $24 in the GDXJ (which might take place when gold is close to $1,550).
- I plan to exit all remaining short positions once gold shows substantial strength relative to the USD Index while the latter is still rallying. This may be the case with gold prices close to $1,400 and GDXJ close to $15 . This moment (when gold performs very strongly against the rallying USD and miners are strong relative to gold after its substantial decline) is likely to be the best entry point for long-term investments, in my view. This can also happen with gold close to $1,400, but at the moment it’s too early to say with certainty.
- The above is based on the information available today, and it might change in the following days/weeks.
You will find my general overview of the outlook for gold on the chart below:
Please note that the above timing details are relatively broad and “for general overview only” – so that you know more or less what I think and how volatile I think the moves are likely to be – on an approximate basis. These time targets are not binding nor clear enough for me to think that they should be used for purchasing options, warrants, or similar instruments.
Letters to the Editor
We received a few messages over e-mail, but as we are moving to our new platform, we will be transferring them below the articles as comments – and that’s where we’ll be replying to them.
Asking your questions below the articles or in the spaces called “Ask the Community” or “Position Sizes” directly will help us deliver a reply sooner. In some cases, someone from the community might reply and help even before we do.
Please remember about the Pillars of our Community, especially about the Kindness of Speech Pillar.
Also, if there’s anything that you want to complain about, it’s best to send us a message at [email protected].
Please note that this section is going to go away within the next 1-8 weeks, as you can add comments/questions below the article on Golden Meadow – the platform that we’re using to provide our analyses. Your notification e-mails include an invitation link that allows you to access the “Gold Trading Alerts” space.
Also, if you haven’t had the chance to see the video, in which I’m talking about the new platform and why we essentially moved from Sunshine Profits to Golden Meadow, I strongly encourage you to do so:
Summary
Summing up, it seems that the major bottom in the USD Index is in, while the correction in stocks, gold, silver, and mining stocks is over.
The nature of the recent corrections was mostly technical and rumor-based. The rumor was that the Fed would be making a dovish U-turn soon, and it recently became clear that this was not going to be the case. Consequently, the corrective upswing is likely to be reversed, and medium-term downtrends are likely to resume.
In my opinion, the current trading position is going to become profitable in the following weeks, and quite possibly in the following days. And while I can’t promise any kind of performance, I fully expect it to become very profitable before it’s over and to prolong our 2022 winning streak.
After the final sell-off (that takes gold to about $1,350-$1,500), I expect the precious metals to rally significantly. The final part of the decline might take as little as 1-5 weeks, so it's important to stay alert to any changes.
As always, we'll keep you – our subscribers – informed.
To summarize:
Trading capital (supplementary part of the portfolio; our opinion): Full speculative short positions (300% of the full position) in junior mining stocks are justified from the risk to reward point of view with the following binding exit profit-take price levels:
Mining stocks (price levels for the GDXJ ETF): binding profit-take exit price: $20.32; stop-loss: none (the volatility is too big to justify a stop-loss order in case of this particular trade)
Alternatively, if one seeks leverage, we’re providing the binding profit-take levels for the JDST (2x leveraged). The binding profit-take level for the JDST: $22.87; stop-loss for the JDST: none (the volatility is too big to justify a SL order in case of this particular trade).
For-your-information targets (our opinion; we continue to think that mining stocks are the preferred way of taking advantage of the upcoming price move, but if for whatever reason one wants / has to use silver or gold for this trade, we are providing the details anyway.):
Silver futures downside profit-take exit price: $14.32
SLV profit-take exit price: $13.42
ZSL profit-take exit price: $48.87
Gold futures downside profit-take exit price: $1,504
HGD.TO – alternative (Canadian) 2x inverse leveraged gold stocks ETF – the upside profit-take exit price: $16.47
HZD.TO – alternative (Canadian) 2x inverse leveraged silver ETF – the upside profit-take exit price: $36.87
Long-term capital (core part of the portfolio; our opinion): No positions (in other words: cash)
Insurance capital (core part of the portfolio; our opinion): Full position
Whether you’ve already subscribed or not, we encourage you to find out how to make the most of our alerts and read our replies to the most common alert-and-gold-trading-related-questions.
Please note that we describe the situation for the day that the alert is posted in the trading section. In other words, if we are writing about a speculative position, it means that it is up-to-date on the day it was posted. We are also featuring the initial target prices to decide whether keeping a position on a given day is in tune with your approach (some moves are too small for medium-term traders, and some might appear too big for day-traders).
Additionally, you might want to read why our stop-loss orders are usually relatively far from the current price.
Please note that a full position doesn't mean using all of the capital for a given trade. You will find details on our thoughts on gold portfolio structuring in the Key Insights section on our website.
As a reminder - "initial target price" means exactly that - an "initial" one. It's not a price level at which we suggest closing positions. If this becomes the case (as it did in the previous trade), we will refer to these levels as levels of exit orders (exactly as we've done previously). Stop-loss levels, however, are naturally not "initial", but something that, in our opinion, might be entered as an order.
Since it is impossible to synchronize target prices and stop-loss levels for all the ETFs and ETNs with the main markets that we provide these levels for (gold, silver and mining stocks - the GDX ETF), the stop-loss levels and target prices for other ETNs and ETF (among other: UGL, GLL, AGQ, ZSL, NUGT, DUST, JNUG, JDST) are provided as supplementary, and not as "final". This means that if a stop-loss or a target level is reached for any of the "additional instruments" (GLL for instance), but not for the "main instrument" (gold in this case), we will view positions in both gold and GLL as still open and the stop-loss for GLL would have to be moved lower. On the other hand, if gold moves to a stop-loss level but GLL doesn't, then we will view both positions (in gold and GLL) as closed. In other words, since it's not possible to be 100% certain that each related instrument moves to a given level when the underlying instrument does, we can't provide levels that would be binding. The levels that we do provide are our best estimate of the levels that will correspond to the levels in the underlying assets, but it will be the underlying assets that one will need to focus on regarding the signs pointing to closing a given position or keeping it open. We might adjust the levels in the "additional instruments" without adjusting the levels in the "main instruments", which will simply mean that we have improved our estimation of these levels, not that we changed our outlook on the markets. We are already working on a tool that would update these levels daily for the most popular ETFs, ETNs and individual mining stocks.
Our preferred ways to invest in and to trade gold along with the reasoning can be found in the how to buy gold section. Furthermore, our preferred ETFs and ETNs can be found in our Gold & Silver ETF Ranking.
As a reminder, Gold & Silver Trading Alerts are posted before or on each trading day (we usually post them before the opening bell, but we don't promise doing that each day). If there's anything urgent, we will send you an additional small alert before posting the main one.
Thank you.
Przemyslaw K. Radomski, CFA
Founder, Editor-in-chief

