

Briefly: in our opinion, full (300% of the regular position size) speculative short positions in junior mining stocks are justified from the risk/reward point of view at the moment of publishing this Alert.
PLEASE NOTE:
Dear Subscribers,
As the Author will be traveling this week, upcoming Gold & Silver Trading Alerts will not include regular technical analysis. Instead, they will focus on the fundamental aspects. The next regular technical analysis will be published on Monday, August 22. PR will inform you about significant changes (which are unlikely).
Stay tuned!
The PMs retreated on Aug. 5, as gold declined by 0.87%, silver by 1.39%, the GDX ETF by 0.57% and the GDXJ ETF by 0.94%. In contrast, the USD Index rallied by 0.88% and U.S. Treasury yields also rose sharply. As a result, the price action unfolded as expected, and more of the same should materialize over the medium term.
While investors erroneously assumed that the Fed could ease monetary policy with 9%+ inflation, the crowd bought into the notion that the post-GFC playbook still holds. However, with unanchored inflation forcing the Fed to raise interest rates during recessions in the 1970s and 1980s, I warned on Aug. 5 that the consensus misses the forest through the trees. I wrote:
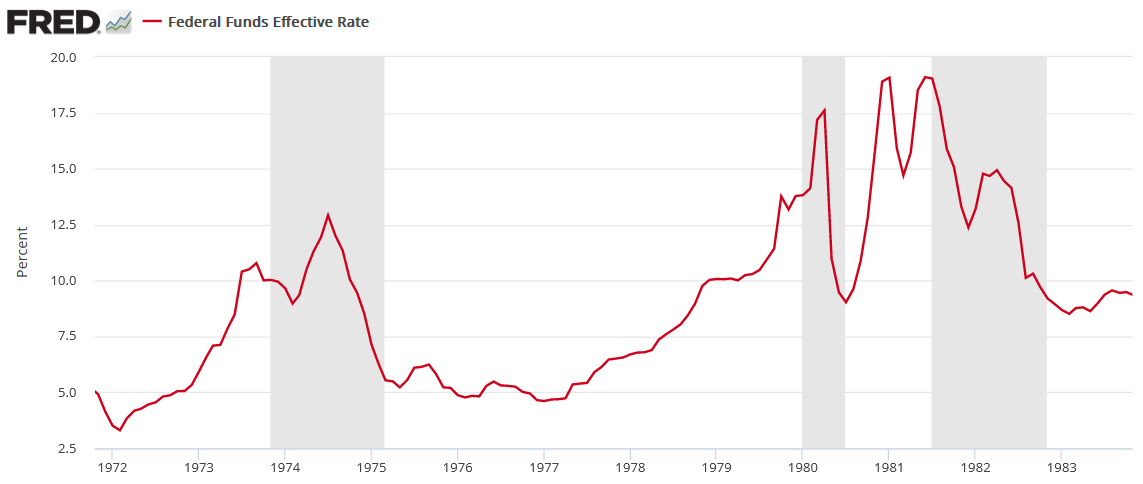
To explain, the red line above tracks the FFR during the 1970s/1980s, and the vertical gray bars represent recessions. For one, unanchored inflation forced the Fed to raise interest rates during (not just before) all three recessions. In addition, the ~1974 and ~1982 recessions show how after the Fed cut rates to support economic growth, the central bank had to reverse course and raise the FFR once again. As such, the consensus underestimates how difficult it is to slay inflation once it gets going.
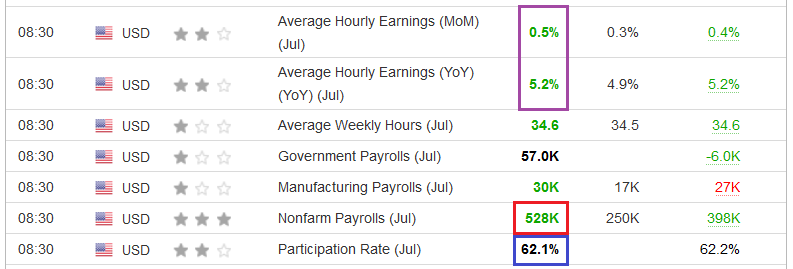
Likewise, while the prospect of a dovish pivot was a fallacy to begin with, another dose of reality hit the wire on Aug. 5. For example, U.S. nonfarm payrolls (the red box) came in at 528,000 versus 250,000 expected, which highlights the continued resiliency of the U.S. labor market. Moreover, employment strength only adds fuel to the hawkish fire.
Please see below:
 Source: Investing.com
Furthermore, if you analyze the purple box above, you can see that average hourly earnings also outperformed economists’ consensus estimates. Therefore, while I’ve been sounding the alarm on wage inflation for many months, the data continues to come in hot.
More importantly, the blue box above shows how the labor force participation rate declined from 62.2% in June to 62.1% in July. This is profoundly inflationary. With the demand for workers still apparent and the supply shrinking each month, wages will remain elevated as companies compete for potential candidates. As such, the data should keep the Fed’s foot on the hawkish accelerator, and the prospect is bearish for gold, silver, and mining stocks.
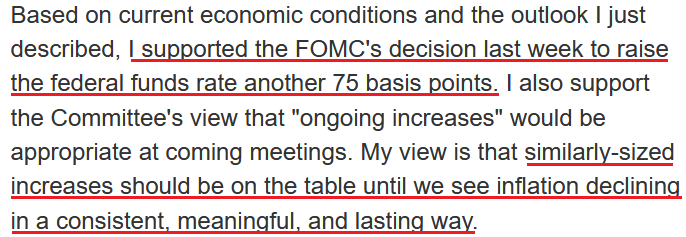
To that point, Fed Governor Michelle Bowman said on Aug. 6:
“One aspect of the job market that has not recovered is labor force participation. Based on the pre-pandemic trend, there are nearly four million people who are still sitting out of a strong labor market (…). Yesterday's job report showed continued significant growth in hiring with the unemployment rate finally returning to the pre-pandemic level of 3.5%.”
She added:
“When considering the risks to the labor market, these risks must be viewed in the context of its current strength and with the understanding that our primary challenge is to get inflation under control. In fact, the larger threat to the strong labor market is excessive inflation, which if allowed to continue could lead to a further economic softening, risking a prolonged period of economic weakness coupled with high inflation, like we experienced in the 1970s.”
As a result:
 Source: U.S. Fed
Thus, while Fed officials have intensified their efforts to unwind the dovish damage done during Chairman Jerome Powell’s press conference on Jul. 27, the bond market took note of the fundamental developments.
Please see below:
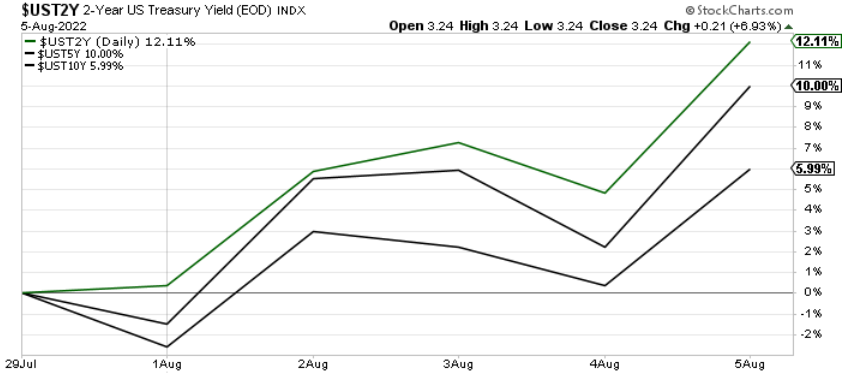
To explain, the green and black lines above track the one-week performance of the U.S. 2-Year, 5-Year, and 10-Year Treasury yields. As you can see, interest rates rose sharply last week, with the bulk of the move occurring after the payroll print on Aug. 5. Furthermore, with the U.S. 10-Year breakeven inflation rate declining to 2.46%, the U.S. 10-Year real yield closed at 0.37% on Aug. 5.
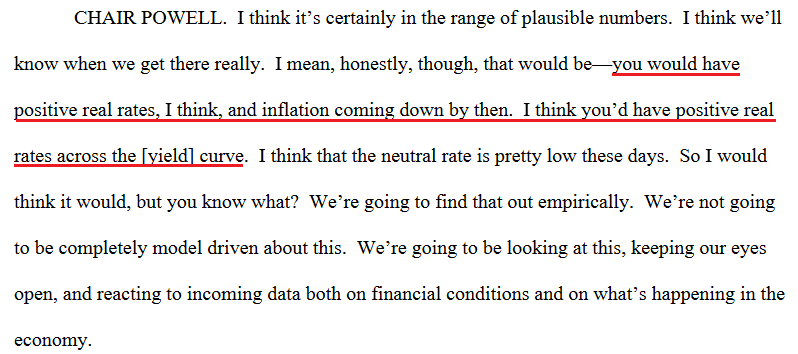
Therefore, while the S&P 500’s intraday comeback helped gold, silver, and mining stocks close off their lows, the fundamentals continue to support lower prices over the medium term. Moreover, I’ve long warned that the Fed needs higher real yields to curb inflation; and with Powell nodding in agreement during his June press conference, more downside should confront the PMs as the Fed’s inflation fight intensifies.
 Source: U.S. Fed
Spend, Spend, Spend
While the consensus expects a smooth normalization from 9%+ to 2% annual inflation, I’ve warned that underestimating demand has been investors and the Fed’s undoing. I wrote on Dec. 23, 2021.
While the fiscal spending spree may end, U.S. households are flush with cash. U.S. households have nearly $3.54 trillion in their checking accounts. For context, this is 253% more than Q4 2019 (pre-COVID-19)(…).
While some investors expect a dovish 180 from the Fed, they shouldn’t hold their breath. With U.S. economic growth still resilient and the U.S. consumer in much better shape than some portray, the Fed can raise interest rates without crashing the U.S. economy. As a result, Powell will likely stick to his hawkish script and forge ahead with rate hikes in 2022.
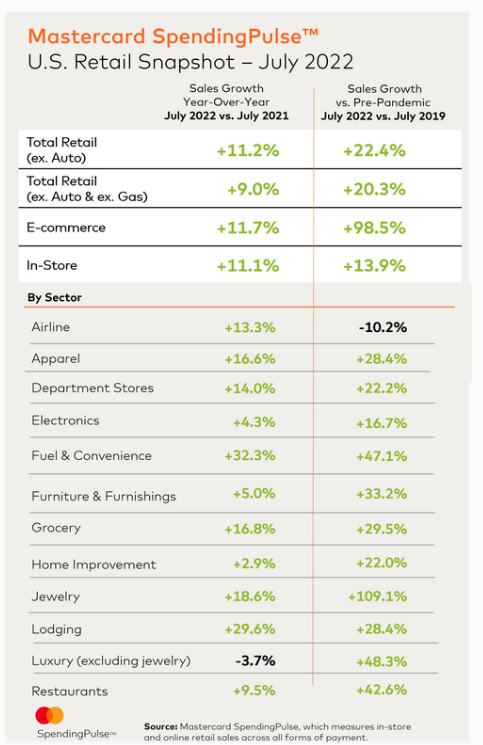
Therefore, while nine rate hikes (25 basis point increments) have commenced in 2022, higher interest rates have done little to derail the U.S. consumer. For example, Mastercard released its SpendingPulse retail sales report on Aug. 4. An excerpt read:
“Spending increases in July outpaced monthly year-over-year (YoY) growth experienced thus far in 2022, with demand and higher prices both contributing factors (…). Apparel (+16.6%) and Jewelry (+18.6%) sales saw strong demand-driven YoY growth, well outpacing sector-specific inflation.”
In addition:
“Travel remains a priority, with Lodging up +29.6% YoY and Airline sales up +13.3% YoY.”
Furthermore:
“While in-store sales remain elevated, up +11.1% YoY/ +13.9% Yo3Y, e-commerce posted its first month of double-digit sales growth (+11.7% YoY) since December.”
Thus, while online spending surged during the pandemic and then decelerated as COVID-19 restrictions abated, in-store transactions remained robust, and e-commerce is now making a comeback. As such, the consensus doesn’t realize that the Fed’s war against inflation will be one of attrition.
Please see below:
Too Loose
Another critical factor is how tighter financial conditions, higher real yields, and a stronger U.S. dollar often go hand in hand. Therefore, while the latter two played their parts on Aug. 5, some metrics are still too loose for the Fed to materially reduce inflation.
Please see below:
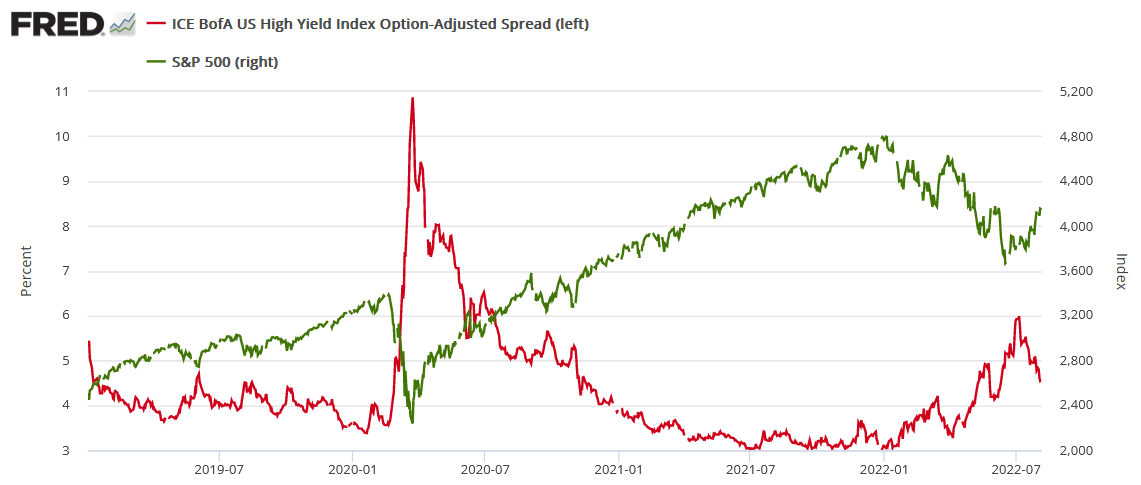
To explain, the red line above tracks the high yield option-adjusted spread (OAS), while the green line above tracks the S&P 500. For context, the OAS is the interest rate above U.S. Treasury yields that investors require to own the riskiest U.S. debt.
If you analyze the right side of the chart, you can see that the metric has declined sharply over the last month. As a result, it’s cheaper for risky companies to obtain financing, and the development supports economic growth.
Furthermore, with the S&P 500 often moving in the opposite direction, you can see how a declining OAS helped embolden the equity bulls (as evidenced by the green line rising on the right side of the chart). However, if the Fed wants to curb inflation, it needs a higher OAS and a lower S&P 500, and a realization is bearish for the PMs.
Hiding in Plain Sight
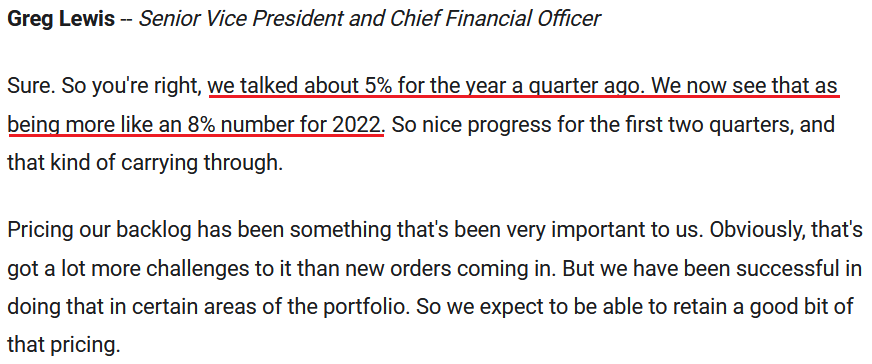
While the headline Consumer Price Index (CPI) may show a deceleration on Aug. 10 due to lower oil and gas prices, I’ve noted how corporate earnings calls have been riddled with mentions of inflation and price increases. Moreover, with Honeywell – an industrial conglomerate with a nearly $130 billion market cap – releasing its second-quarter earnings on Jul. 28, the data remains troublesome.
For example, when asked about the recent decline in commodity prices, CFO Greg Lewis said:
“There are some commodities that are seeing some of that deflation. But overall, for our total portfolio of direct materials, that's sort of cherry picking. And overall, we still see a net increase.”
As such, Honeywell is now pricing its products ahead of the guidance management gave in Q1.
Please see below:
 Source: Honeywell/The Motley Fool
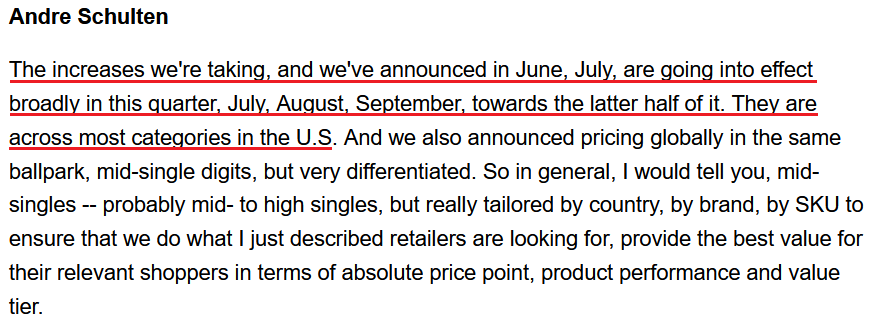
Likewise, Procter & Gamble (P&G) released its fourth-quarter earnings on Jul. 29. For context, it’s one of the largest consumer products companies in the world with a nearly $350 billion market cap. CFO Andre Schulten said during the Q2 earnings call:
“The combined YoY profit headwinds from foreign exchange rates, freight costs, materials, fuel, energy and wage inflation are an even greater challenge in fiscal '23 than they were in fiscal '22. Based on current spot prices and supply contracts, we estimate commodities, raw materials and packaging material costs to be a $2.1 billion after-tax headwind in fiscal 2023.”
He added:
“Moving to the April-June quarter, organic sales grew 7%. Pricing contributed eight points to organic sales growth as additional price increases reached the market.”
Thus, while P&G raised its prices by 8% in Q4, more hikes are coming. As a result, the realities on the ground are nowhere near the Fed’s 2% goal.
Please see below:
 Source: P&G/Seeking Alpha
The Bottom Line
While reality returned to the financial markets on Aug. 5, asset prices are far from reflecting their fundamental values. With the Fed hawked up and a material reduction in demand the only way to normalize inflation, the medium-term ramifications are nowhere near priced in. Therefore, gold, silver, and mining stocks should suffer mightily as the hawkish realities hover over the financial markets in the months ahead.
In conclusion, the PMs declined on Aug. 5, as strong payrolls elicited fears of a more hawkish Fed. However, with the ‘buy the dip crowd’ hitting the bid in the afternoon, their faith in a “soft landing” was on full display. However, with nearly 70 years of data suggesting otherwise, harsh lessons should be learned over the medium term.
Overview of the Upcoming Part of the Decline
- It seems to me that the corrective upswing is either over or about to be over, and that the next big move lower is about to start.
- If we see a situation where miners slide in a meaningful and volatile way while silver doesn’t (it just declines moderately), I plan to – once again – switch from short positions in miners to short positions in silver. At this time, it’s too early to say at what price levels this could take place and if we get this kind of opportunity at all – perhaps with gold prices close to $1,600.
- I plan to exit all remaining short positions once gold shows substantial strength relative to the USD Index while the latter is still rallying. This may be the case with gold prices close to $1,400. I expect silver to fall the hardest in the final part of the move. This moment (when gold performs very strongly against the rallying USD and miners are strong relative to gold after its substantial decline) is likely to be the best entry point for long-term investments, in my view. This can also happen with gold close to $1,400, but at the moment it’s too early to say with certainty.
- The above is based on the information available today, and it might change in the following days/weeks.
You will find my general overview of the outlook for gold on the chart below:
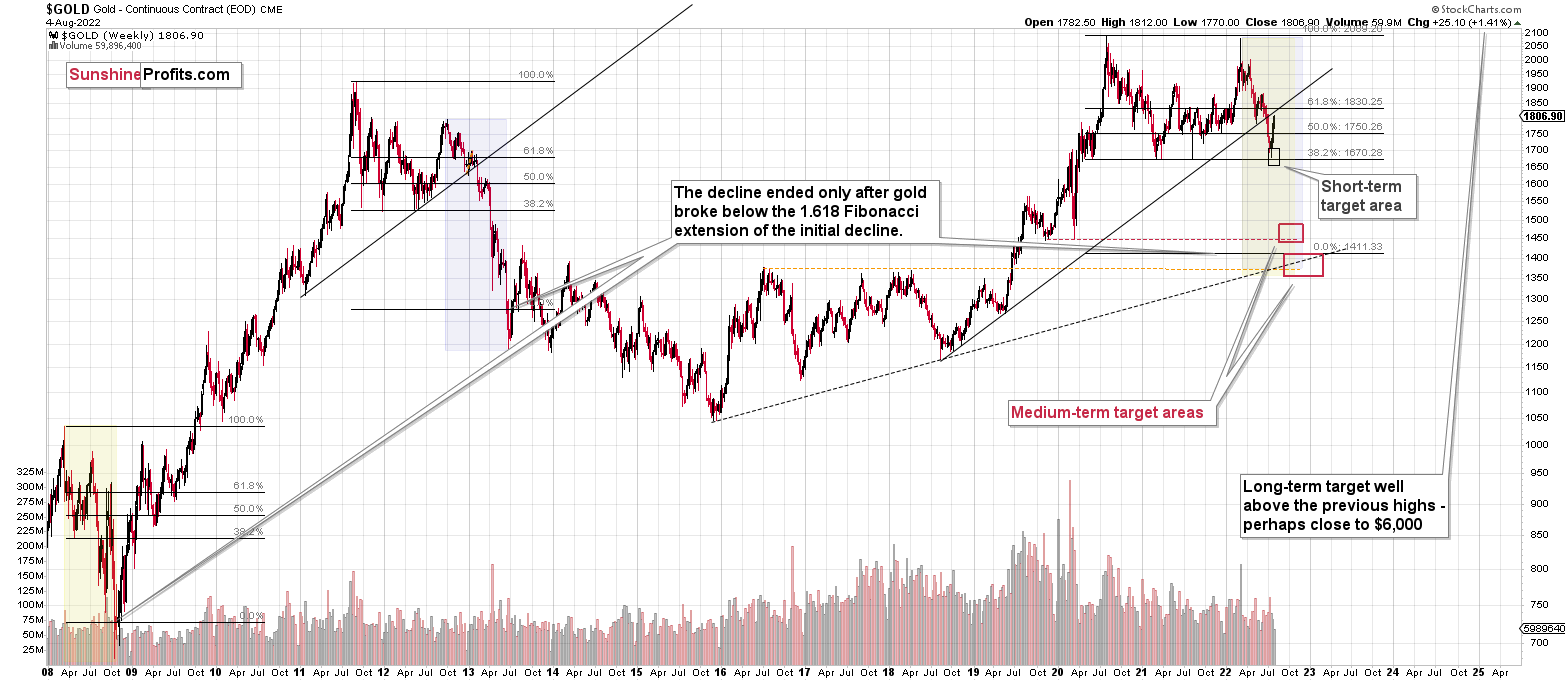
Please note that the above timing details are relatively broad and “for general overview only” – so that you know more or less what I think and how volatile I think the moves are likely to be – on an approximate basis. These time targets are not binding nor clear enough for me to think that they should be used for purchasing options, warrants, or similar instruments.
Summary
Summing up, it seems that the corrective upswing is over (or close to being over), which means that the powerful medium-term downtrend can now resume.
Last week, we closed yet another profitable trade in a row. This year’s profits are already enormous, but it seems likely to me that they will grow even more in the following weeks and months. Making money on corrections during powerful trends is a difficult feat, but you managed to do just that – congratulations!
On an administrative note, I will be traveling this week next, and therefore, upcoming Gold & Silver Trading Alerts will not include the regular technical analysis – they will focus on the fundamental aspects instead. The next regular technical analysis will be posted on Monday, Aug. 22. I will keep you informed if anything major changes (which is unlikely).
Moreover, please note that it’s not only the profits on the long positions that are so great about this success – it’s also the ability to get back on the short side of the market at more favorable (higher) prices, thus increasing the likely profits from the current trade. Congratulations, once again!
Also, please note that I will be updating the targets for the leveraged ETFs as we move closer to them, as their prices will depend on the path prices take to reach their targets.
After the final sell-off (that takes gold to about $1,350-$1,500), I expect the precious metals to rally significantly. The final part of the decline might take as little as 1-5 weeks, so it's important to stay alert to any changes.
As always, we'll keep you – our subscribers – informed.
To summarize:
Trading capital (supplementary part of the portfolio; our opinion): Full speculative short positions (300% of the full position) in junior mining stocks are justified from the risk to reward point of view with the following binding exit profit-take price levels:
Mining stocks (price levels for the GDXJ ETF): binding profit-take exit price: $20.32; stop-loss: none (the volatility is too big to justify a stop-loss order in case of this particular trade)
Alternatively, if one seeks leverage, we’re providing the binding profit-take levels for the JDST (2x leveraged). The binding profit-take level for the JDST: $29.87; stop-loss for the JDST: none (the volatility is too big to justify a SL order in case of this particular trade).
For-your-information targets (our opinion; we continue to think that mining stocks are the preferred way of taking advantage of the upcoming price move, but if for whatever reason one wants / has to use silver or gold for this trade, we are providing the details anyway.):
Silver futures downside profit-take exit price: $12.32
SLV profit-take exit price: $11.32
ZSL profit-take exit price: $79.87
Gold futures downside profit-take exit price: $1,504
HGD.TO – alternative (Canadian) 2x inverse leveraged gold stocks ETF – the upside profit-take exit price: $19.87
HZD.TO – alternative (Canadian) 2x inverse leveraged silver ETF – the upside profit-take exit price: $49.87
Long-term capital (core part of the portfolio; our opinion): No positions (in other words: cash)
Insurance capital (core part of the portfolio; our opinion): Full position
Whether you’ve already subscribed or not, we encourage you to find out how to make the most of our alerts and read our replies to the most common alert-and-gold-trading-related-questions.
Please note that we describe the situation for the day that the alert is posted in the trading section. In other words, if we are writing about a speculative position, it means that it is up-to-date on the day it was posted. We are also featuring the initial target prices to decide whether keeping a position on a given day is in tune with your approach (some moves are too small for medium-term traders, and some might appear too big for day-traders).
Additionally, you might want to read why our stop-loss orders are usually relatively far from the current price.
Please note that a full position doesn't mean using all of the capital for a given trade. You will find details on our thoughts on gold portfolio structuring in the Key Insights section on our website.
As a reminder - "initial target price" means exactly that - an "initial" one. It's not a price level at which we suggest closing positions. If this becomes the case (as it did in the previous trade), we will refer to these levels as levels of exit orders (exactly as we've done previously). Stop-loss levels, however, are naturally not "initial", but something that, in our opinion, might be entered as an order.
Since it is impossible to synchronize target prices and stop-loss levels for all the ETFs and ETNs with the main markets that we provide these levels for (gold, silver and mining stocks - the GDX ETF), the stop-loss levels and target prices for other ETNs and ETF (among other: UGL, GLL, AGQ, ZSL, NUGT, DUST, JNUG, JDST) are provided as supplementary, and not as "final". This means that if a stop-loss or a target level is reached for any of the "additional instruments" (GLL for instance), but not for the "main instrument" (gold in this case), we will view positions in both gold and GLL as still open and the stop-loss for GLL would have to be moved lower. On the other hand, if gold moves to a stop-loss level but GLL doesn't, then we will view both positions (in gold and GLL) as closed. In other words, since it's not possible to be 100% certain that each related instrument moves to a given level when the underlying instrument does, we can't provide levels that would be binding. The levels that we do provide are our best estimate of the levels that will correspond to the levels in the underlying assets, but it will be the underlying assets that one will need to focus on regarding the signs pointing to closing a given position or keeping it open. We might adjust the levels in the "additional instruments" without adjusting the levels in the "main instruments", which will simply mean that we have improved our estimation of these levels, not that we changed our outlook on the markets. We are already working on a tool that would update these levels daily for the most popular ETFs, ETNs and individual mining stocks.
Our preferred ways to invest in and to trade gold along with the reasoning can be found in the how to buy gold section. Furthermore, our preferred ETFs and ETNs can be found in our Gold & Silver ETF Ranking.
As a reminder, Gold & Silver Trading Alerts are posted before or on each trading day (we usually post them before the opening bell, but we don't promise doing that each day). If there's anything urgent, we will send you an additional small alert before posting the main one.
Thank you.
Przemyslaw Radomski, CFA
Founder, Editor-in-chief

