

Briefly: In our opinion, full (100% of the regular size of the position) speculative short positions in gold, silver and mining stocks are justified from the risk/reward perspective at the moment of publishing this alert. In other words, we are closing the long positions, taking profits off the table and opening short positions.
At first sight nothing really changed yesterday. The USD Index closed relatively unchanged, gold moved down just a little and while silver’s decline was more visible, one could view this move as rather accidental as silver is known to be volatile at times. Yet, there are grave implications of yesterday’s session as what happened yesterday only appears insignificant on a stand-alone basis. When one views it in light of the factors that were and still are in play and checks how the USD and metals moved relative to each other, it becomes clear that the implications are major enough for one to change their trading position.
Let’s start today’s analysis with the context. In our May 1st analysis, we wrote the following (both following sections are just as we wrote them 2 weeks ago and they are just as up-to-date as they were back then):
True Seasonals for May
The True Seasonal patterns are the regular seasonality plus the effects of the expirations of derivatives: futures, options and stock options. You can read a detailed report on this tool by clicking here and the long-story-short version is that this upgraded version of seasonality is most useful when there are no strong signals from other tools, but even if there are other signals in place, it can be used as confirmation. Overall, it’s more of a loose guideline than a strict rule.
So, let’s take a look what’s in store for this month.
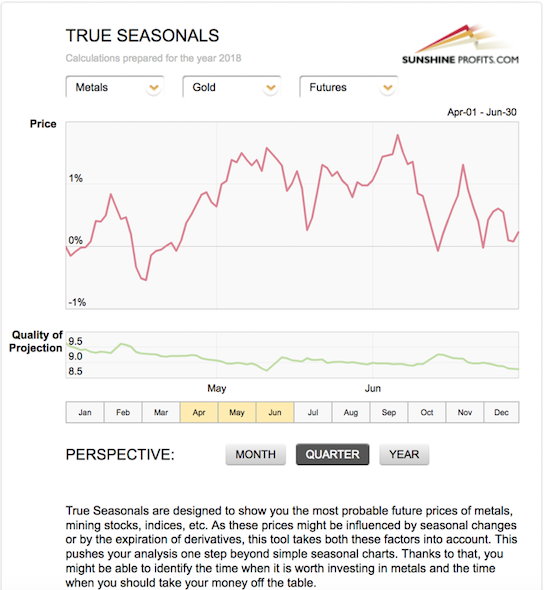
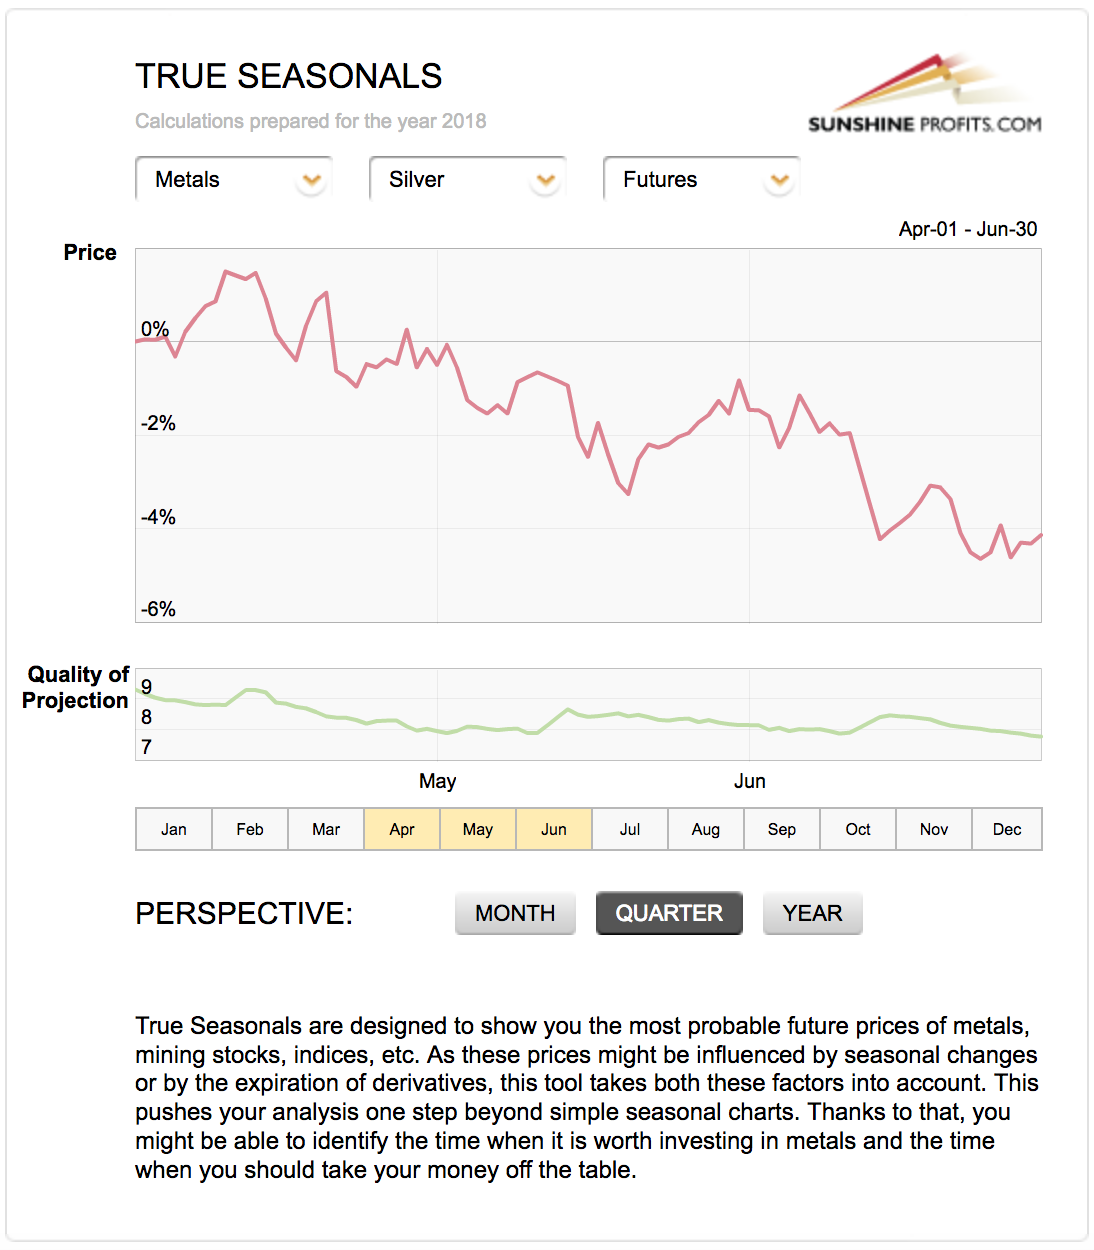
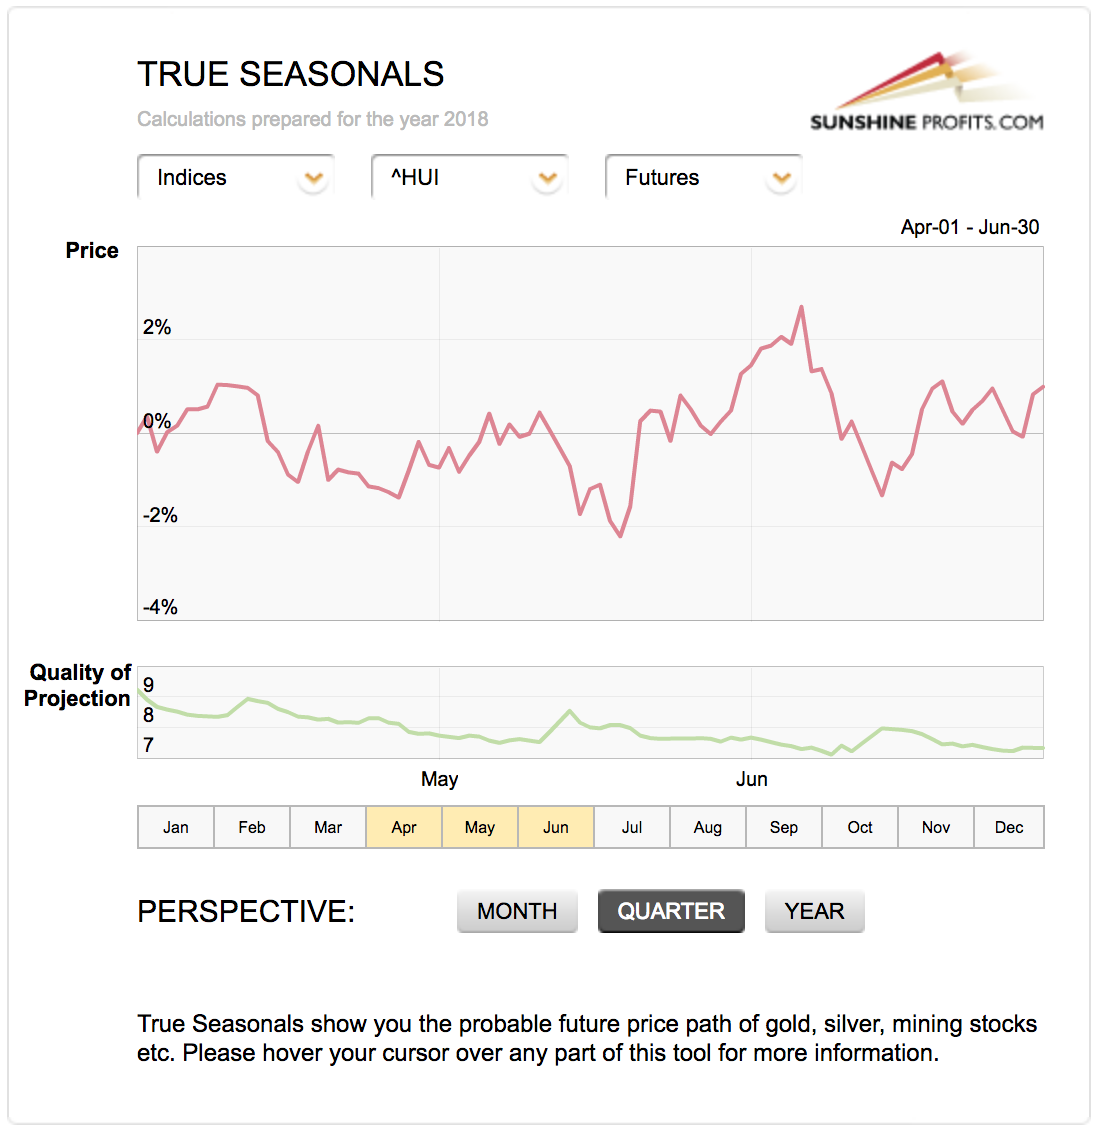
Gold’s rally, silver’s decline and miners’ horizontal trend are not errors – that’s a reflection of how the PM market performed in the recent years. It doesn’t necessarily imply that gold will lead, silver will lag, and the miners’ performance will be average. The relative performance is more likely to depend on individual factors that change from year to year.
What’s most interesting about the three above charts is what is similar in the case of all markets and this thing is the local top on May 11th in all cases. If it was just one market that suggested a top at that time, it wouldn’t be that important – but since all three do, it’s something that we should definitely keep in mind.
Taking this one level higher, if the True Seasonality was the only thing that made the outlook bullish and a top close to May 11th likely, we still wouldn’t view this time target as very important. But this time target is confirmed by – that’s right, you guessed it – apex-based turning points.
Apex-Based Reversals
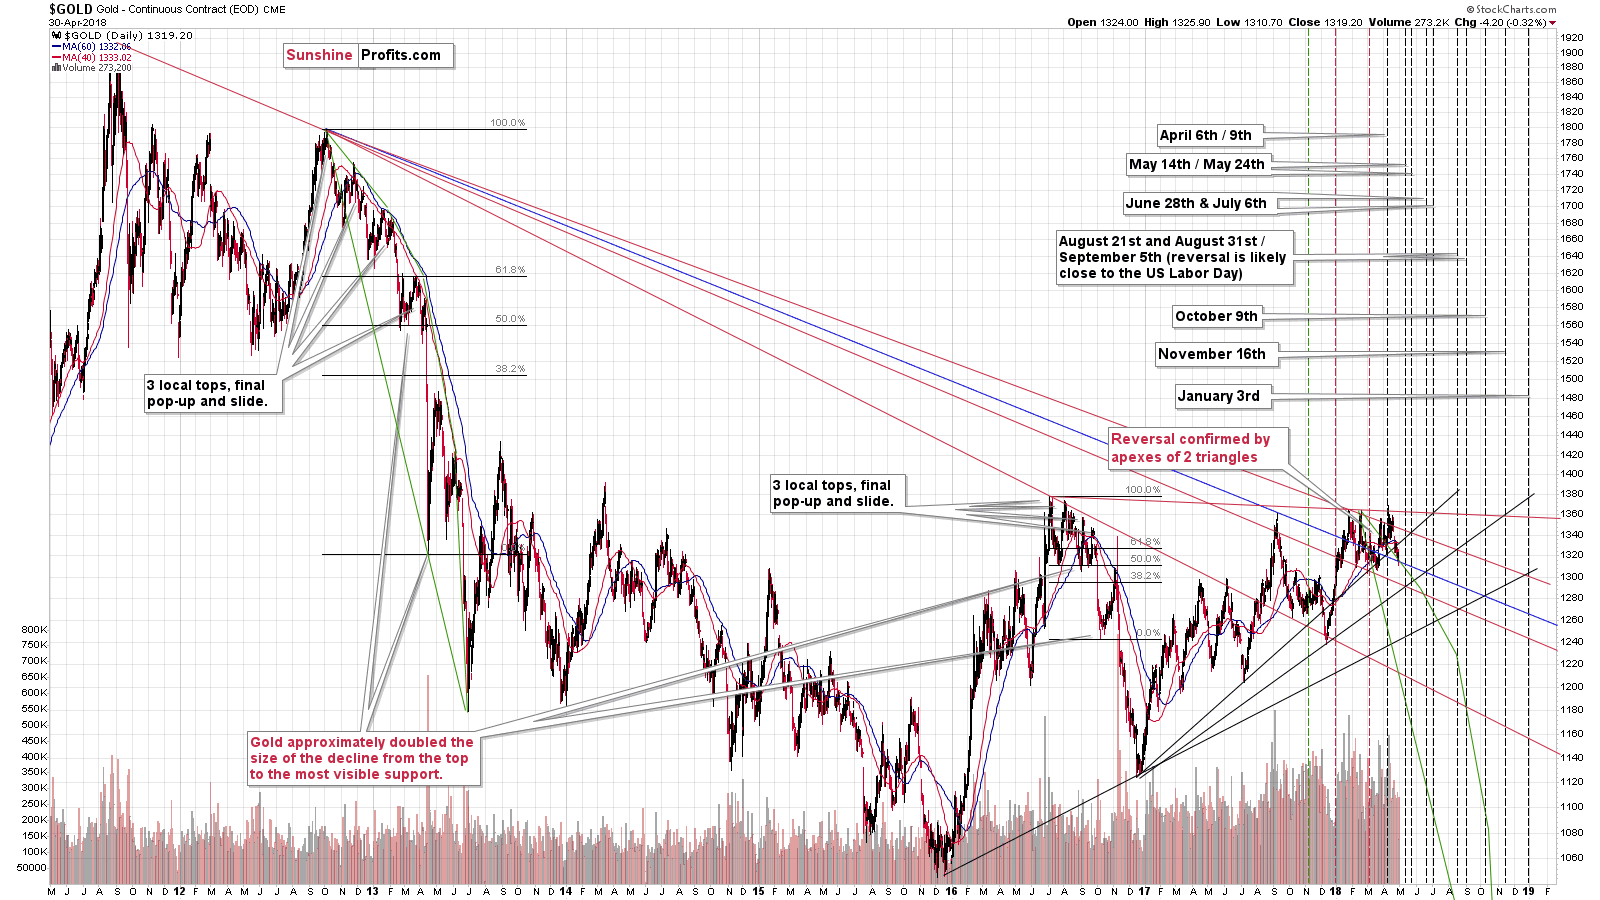
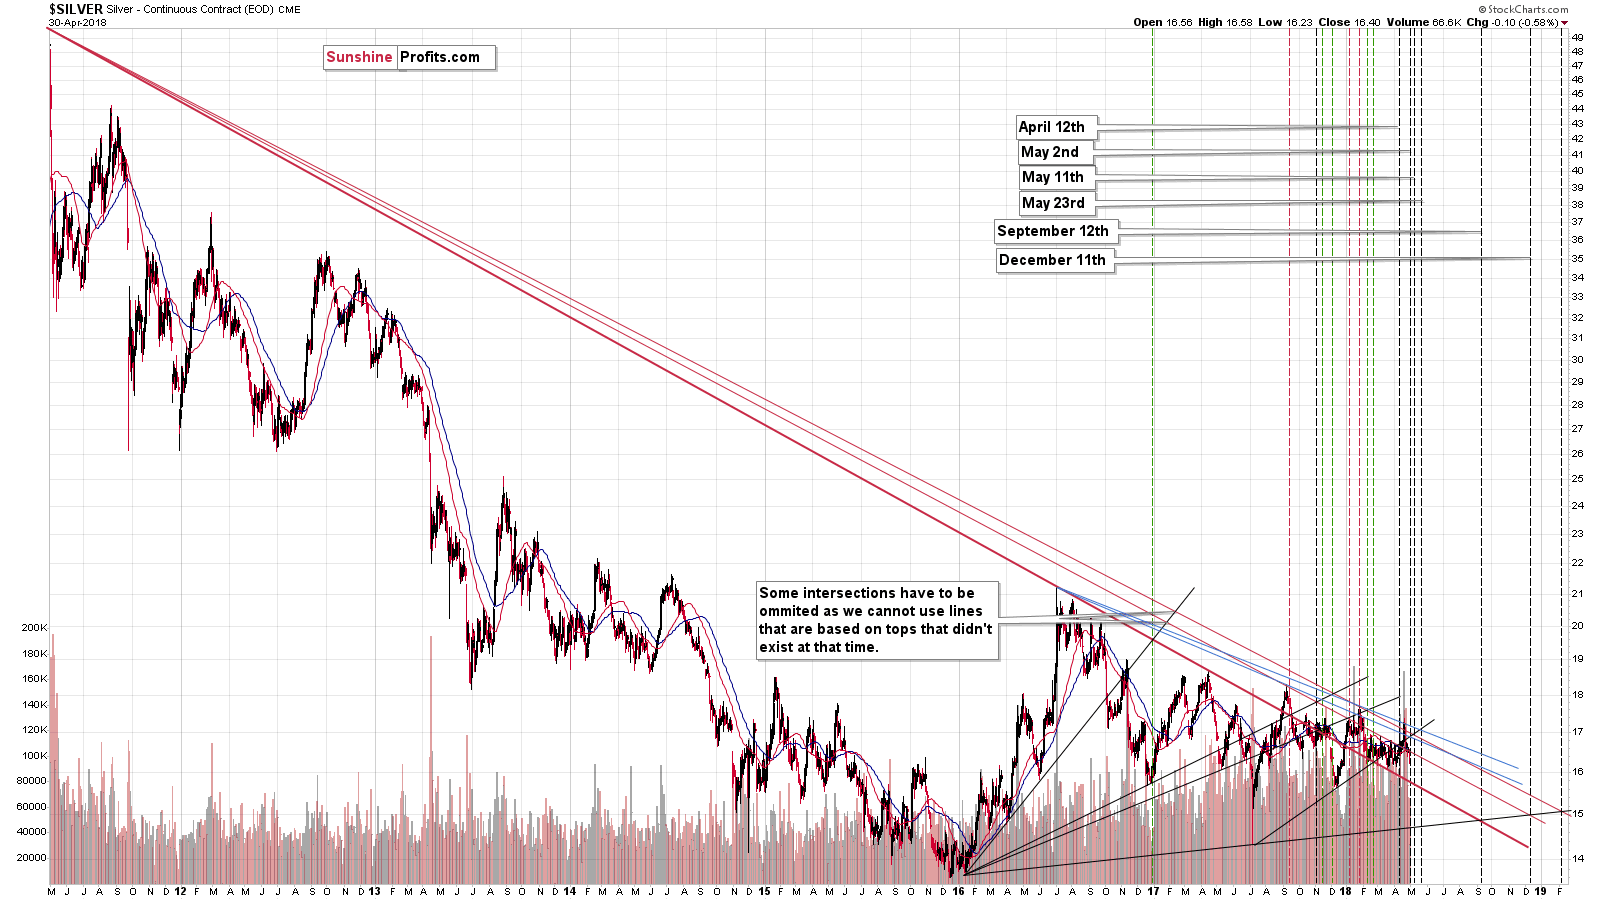
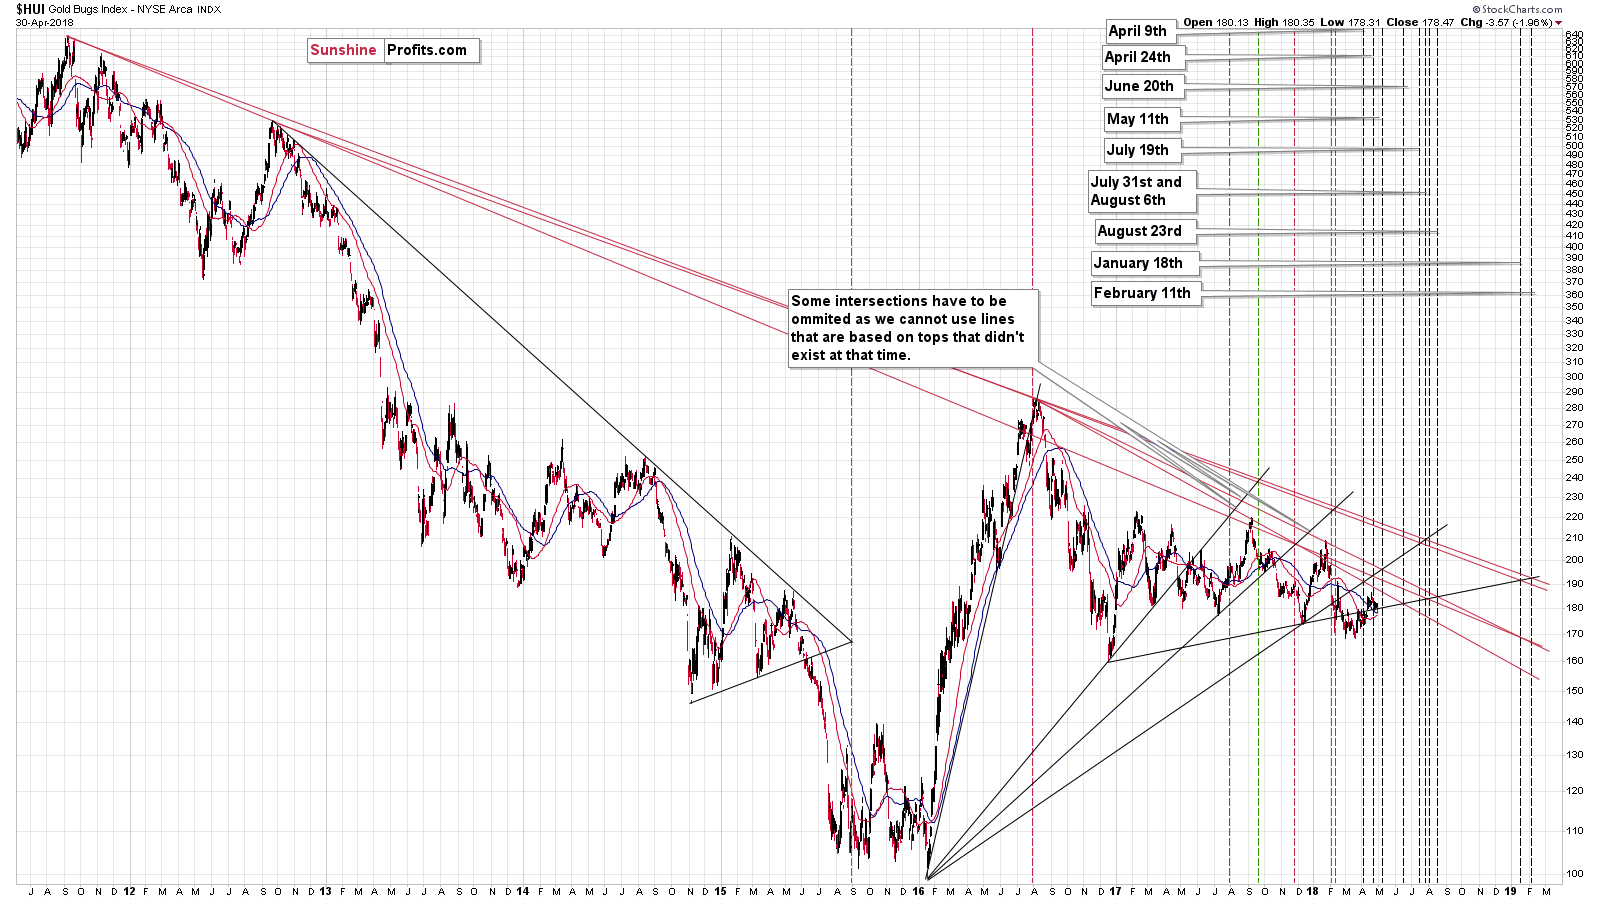
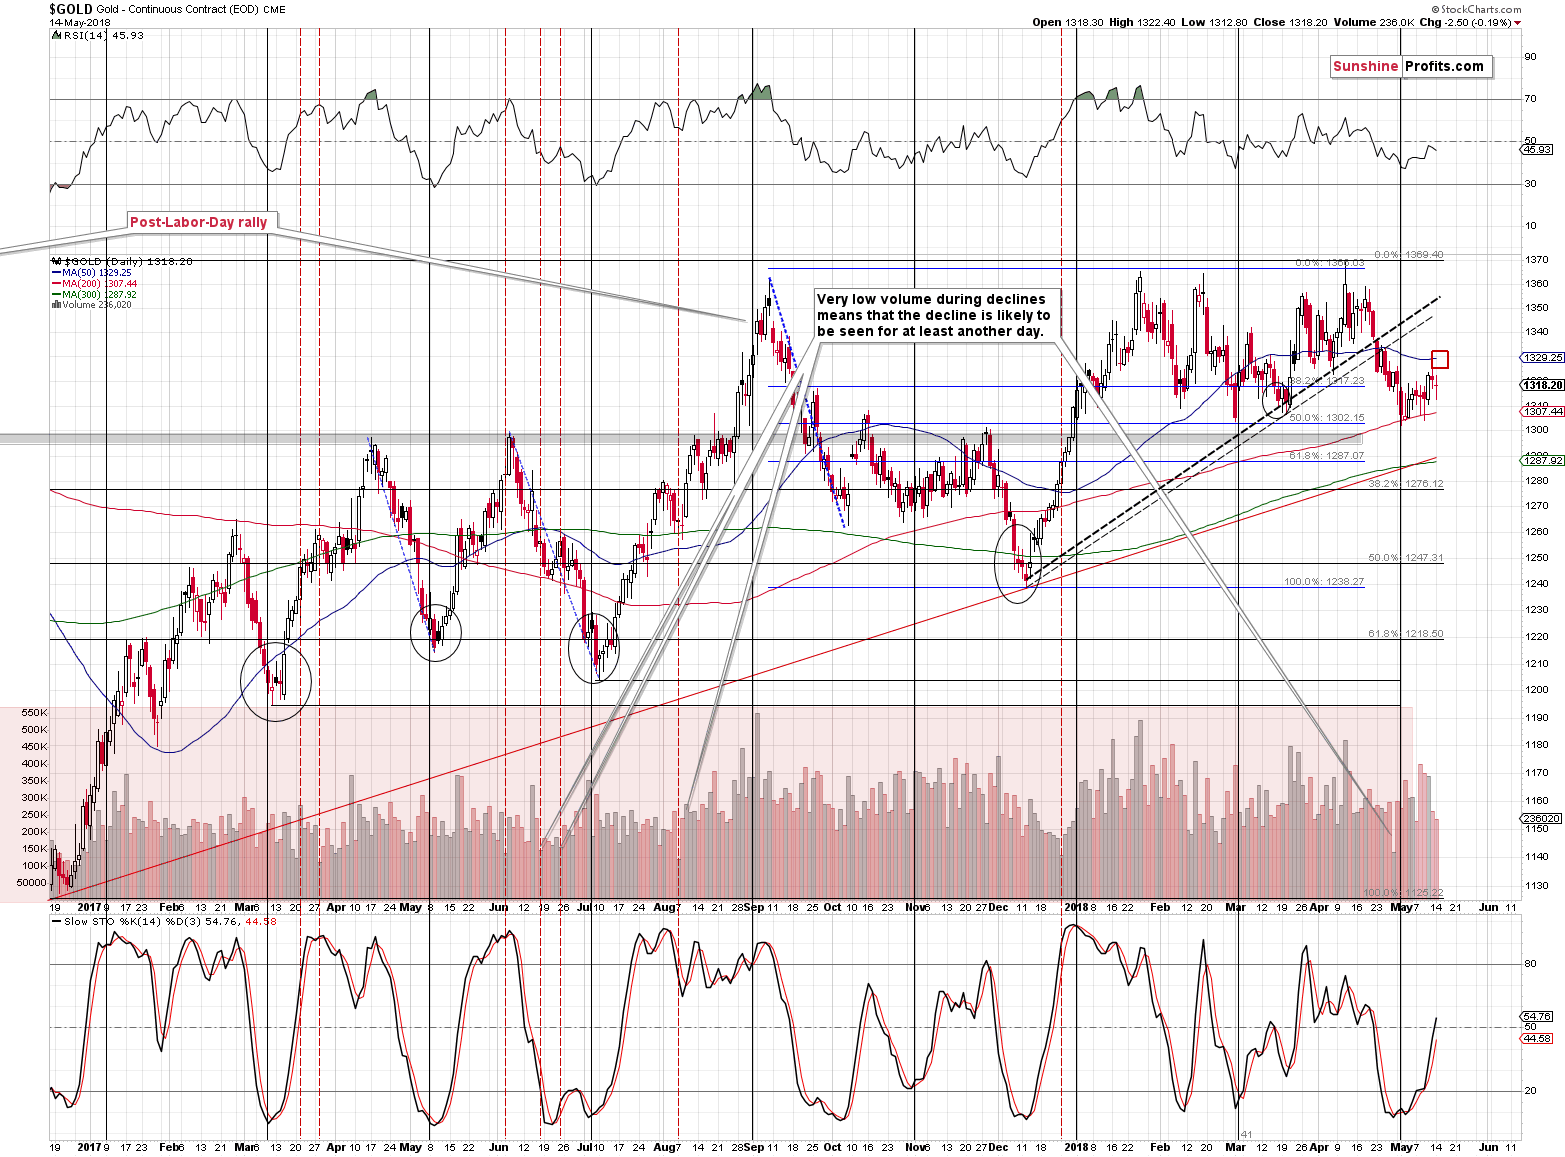
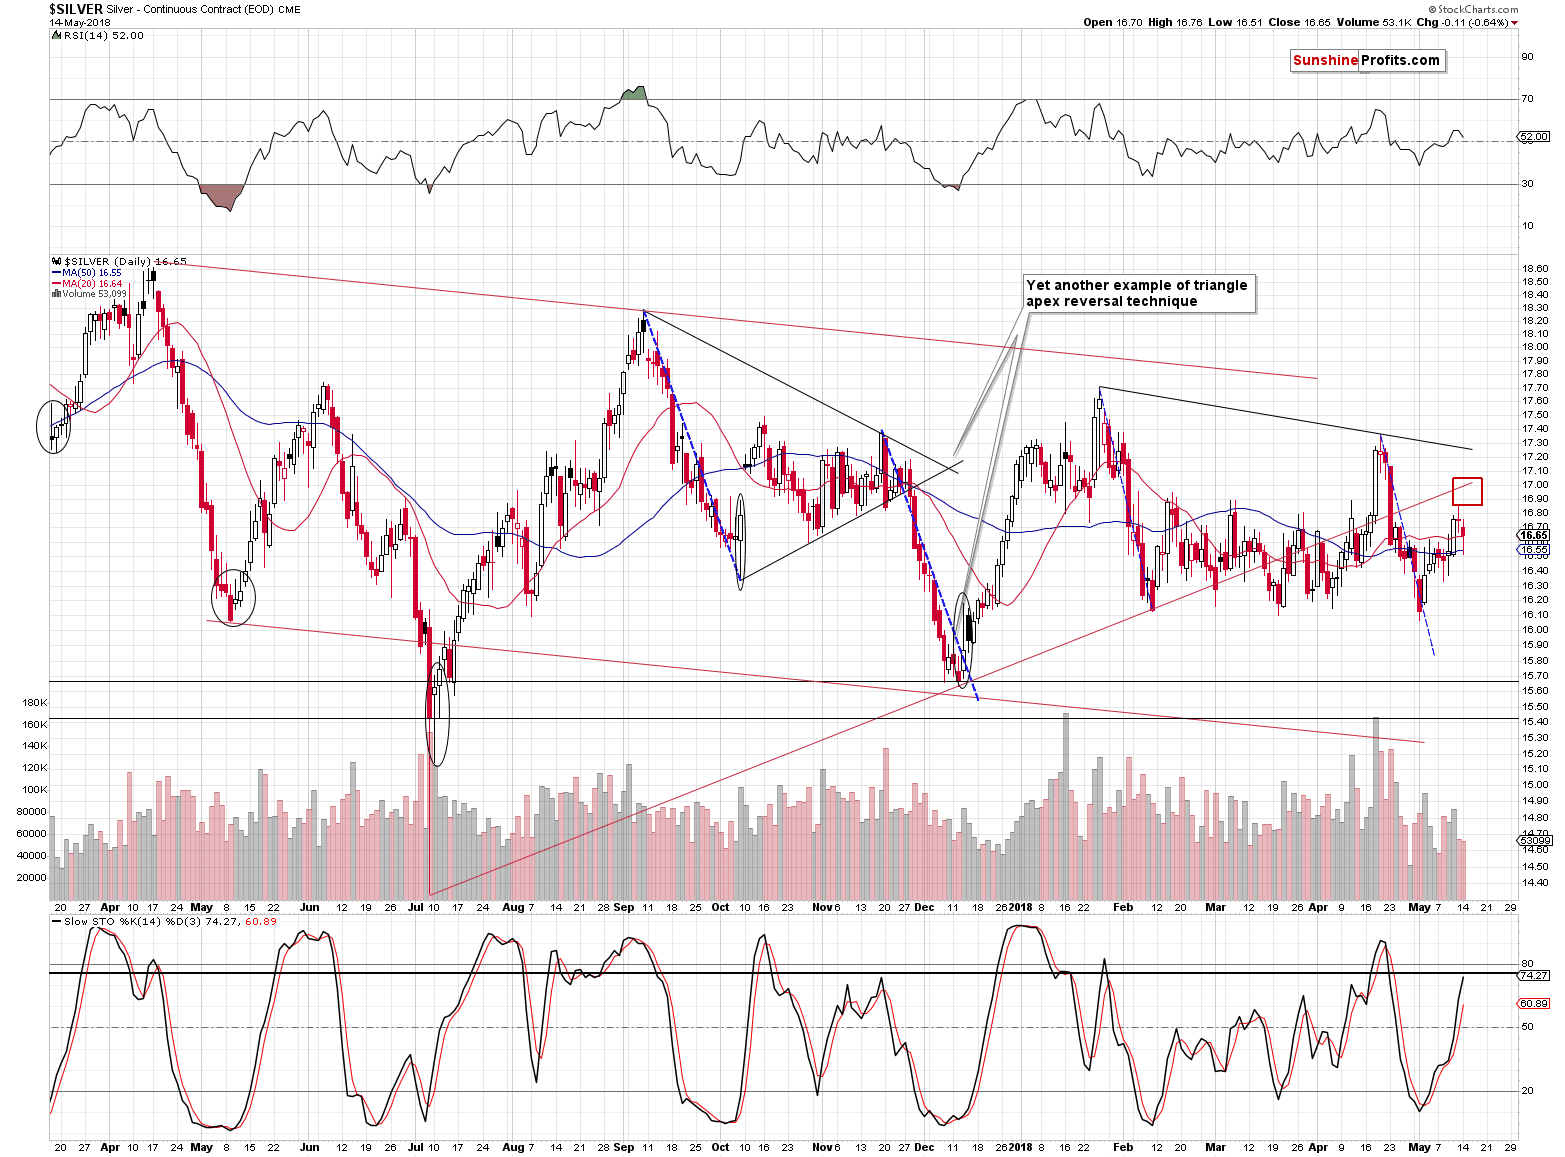
The long-term triangles have apexes on May 14th (gold), May 11th (silver), and May 11th (HUI Index), which is a near-perfect confirmation of what we saw on the above True Seasonal charts.
The apex-based reversals proved their usefulness multiple times and since we’re seeing all three of them pointing to almost the same reversal day (May 11th is Friday, so it’s just before Monday, May 14th, in trading day terms), the likelihood of seeing a major reversal on this date or close to it (give or take 3 days or so).
Based on what we saw on Friday, it wasn’t clear if a top was in or not, but, based on what we saw yesterday, it is. Gold, silver, and mining stocks moved lower almost without the USD’s help, but that’s not even the most important thing.
The key development that we witnessed yesterday was the lack of willingness of gold and silver to rally despite the USD’s intraday decline. This means that even if the USD moves to our target of 91.6, metals and miners may not move to this month’s highs, let alone above them.
USD Index
In yesterday’s alert, we wrote the following about the USD Index:
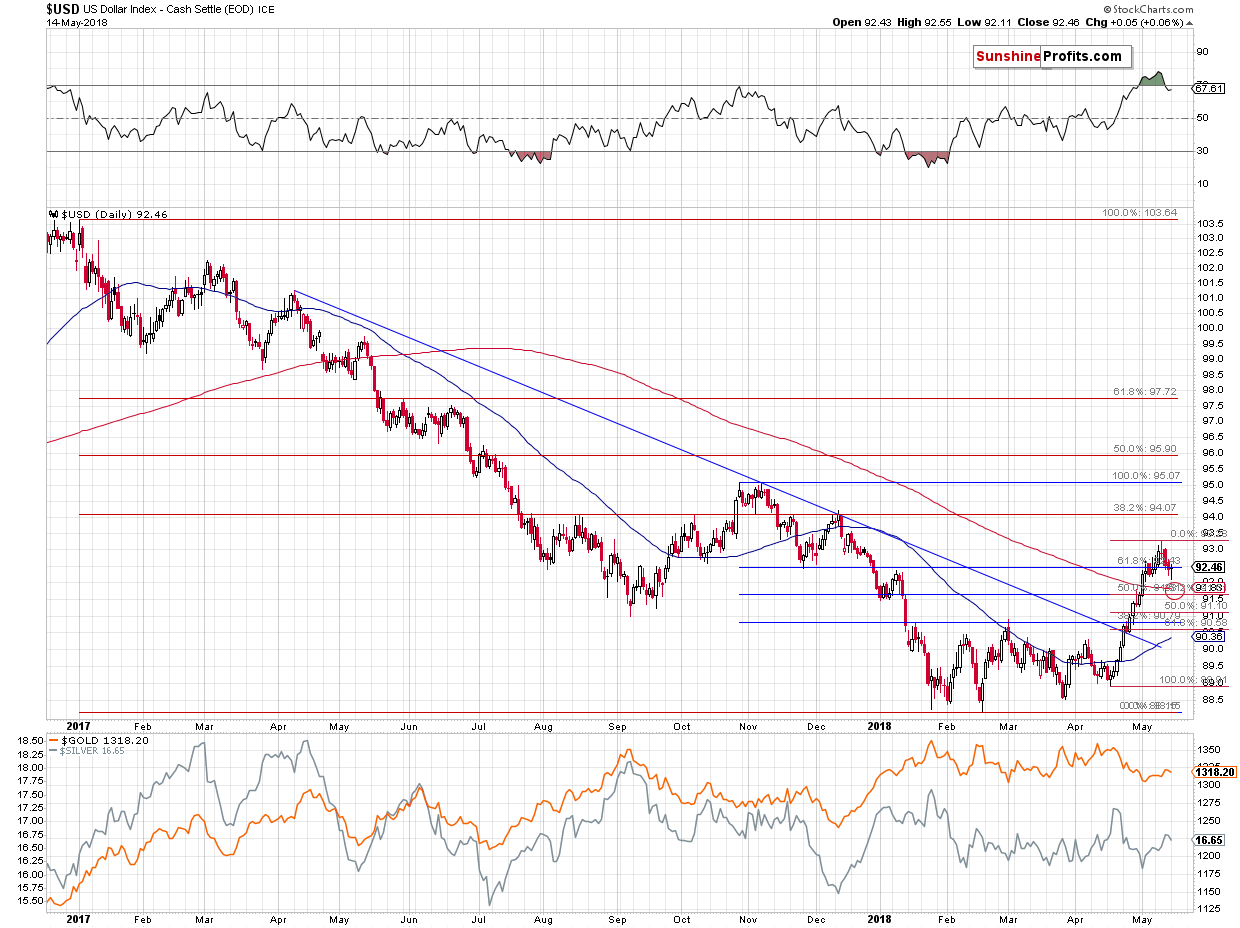
The first strong support is provided by the 38.2% Fibonacci retracement level (approximately 91.6) and it’s about 0.8 index point below Friday’s closing price. At the moment of writing these words, the USDX is already 0.17 lower, so the distance is now only 0.63 index points.
This level is a likely target also because of the analogy to the 2014 rally.
The above chart shows that last week the USD moved very close to the rising dashed green line and when that was the case in 2014, we saw the first pullback within the rally.
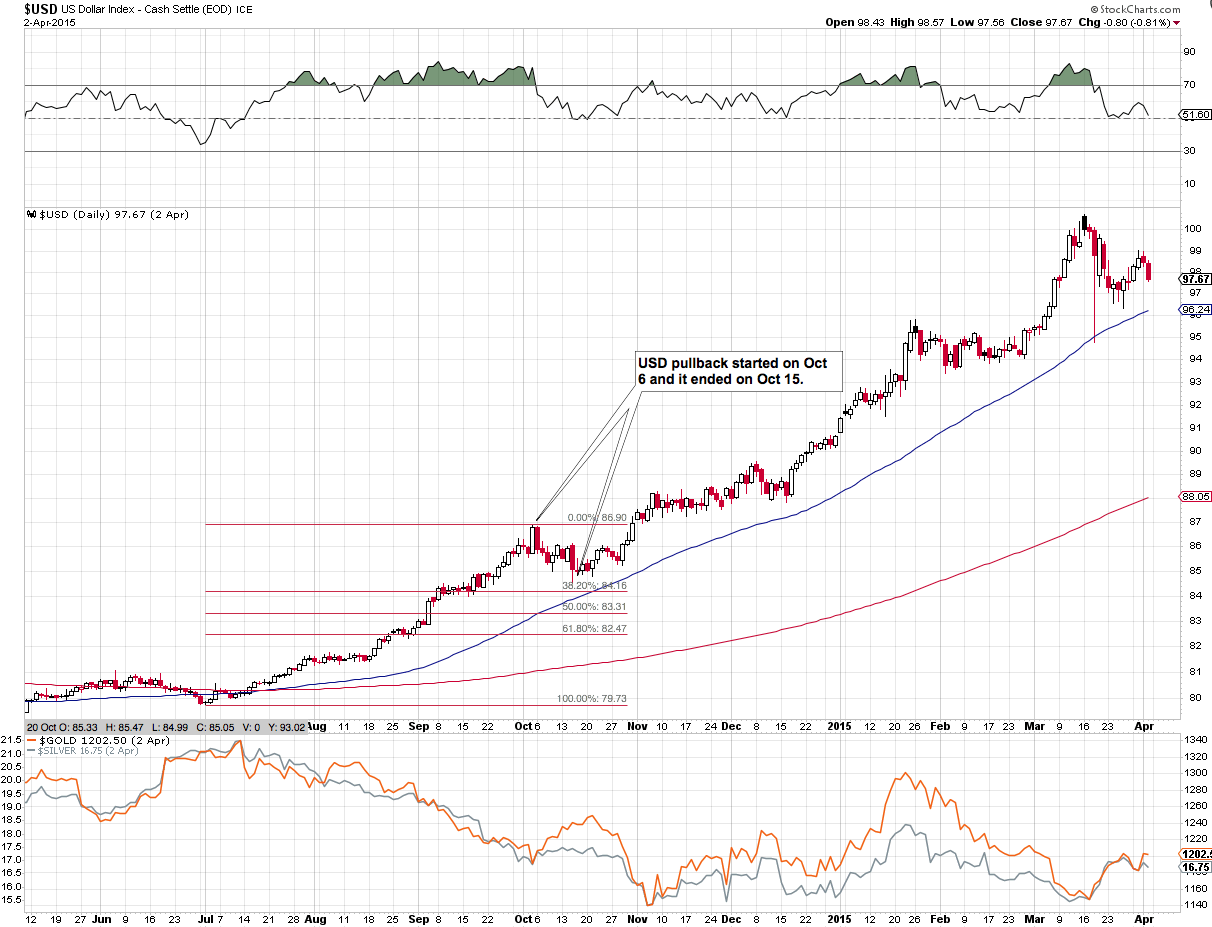
In 2014, the USD corrected to almost the 38.2% Fibonacci retracement, but only in terms of the intraday low. Therefore, if history is to repeat itself, the USD might move close to 91.6 in a sharp manner and then move back up. This would likely result in a sharp rally higher in PMs (especially in silver) and then a move back down before the end of the session.
On the other hand, please note that the October 2014 correction took more than a week to be completed and we saw the (likely) final short-term top in the USD only two days ago. This means that we could expect more weakness lasting longer than just a one-day downswing.
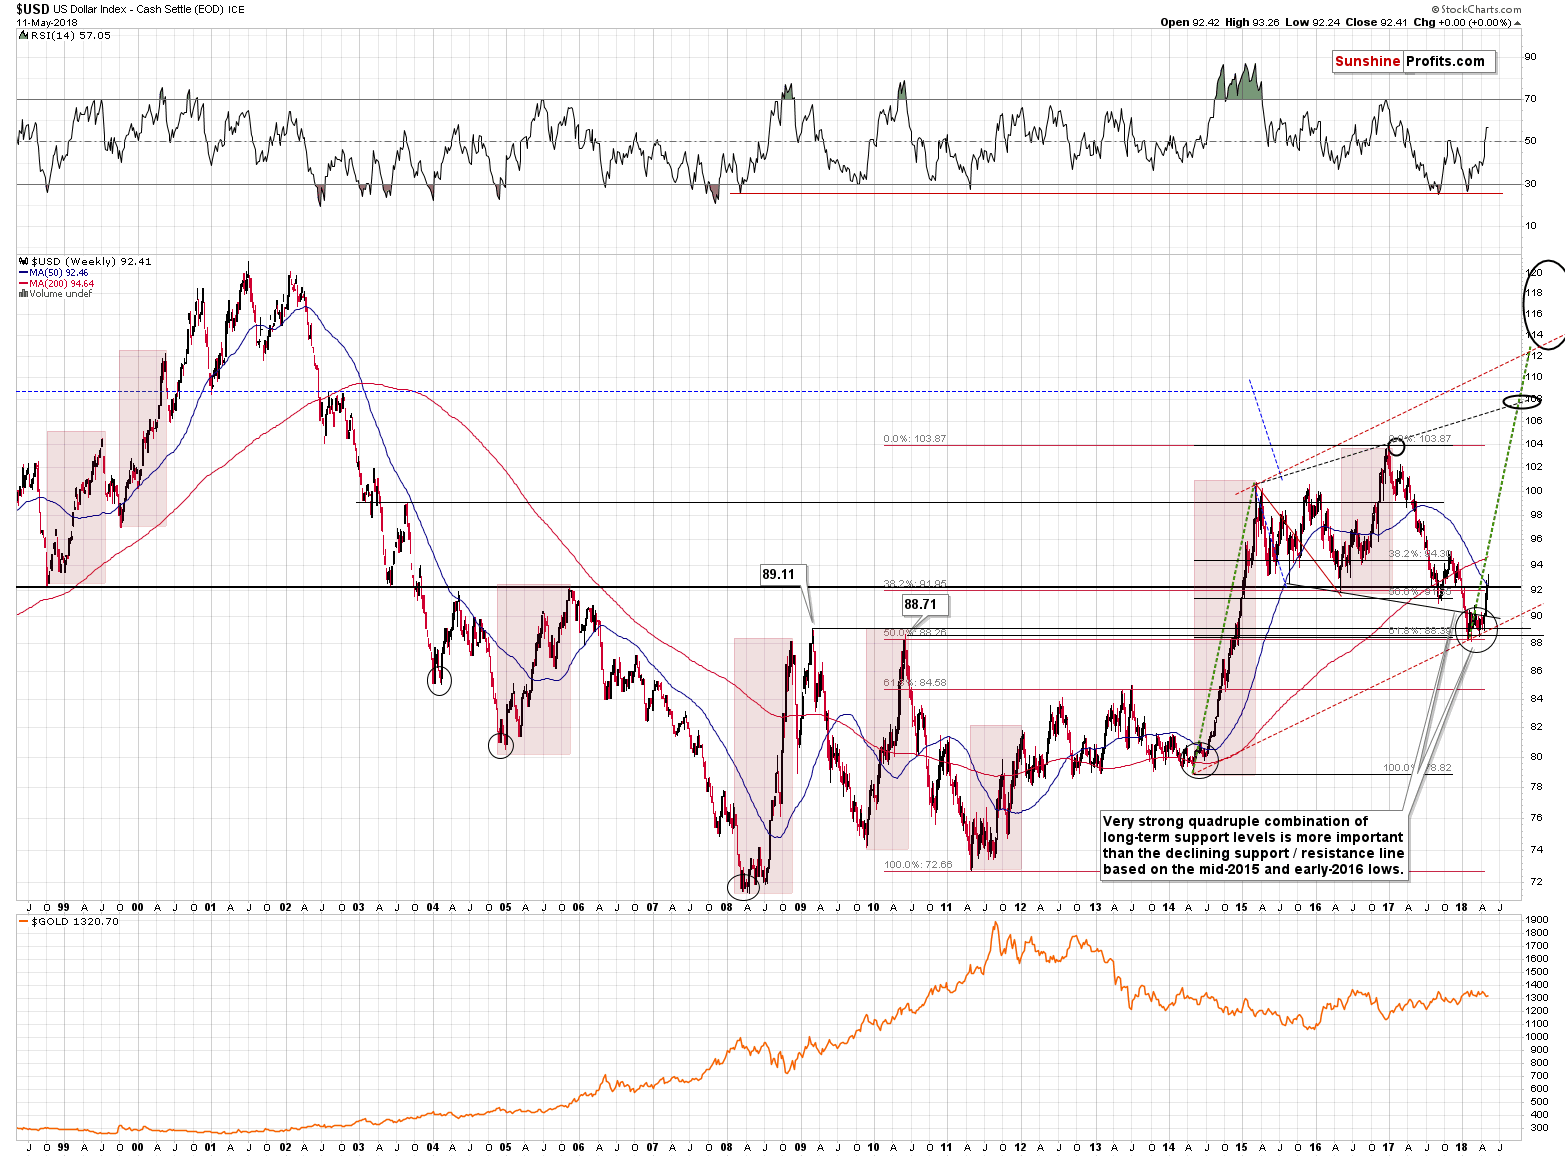
The above is generally up-to-date, but we’d like to also point out the fact that back in 2014, the USD corrected in a zigzag pattern. The first few days of declines were followed by a few days of pause and only then – in mid-October 2014 – did the USD move to the final short-term low. If the history is to repeat itself to the letter, we are now entering the “pause” moment.
This wasn’t relevant until today as we didn’t have strong signals from the metals-USD link that supported the bearish case. Since metals are unwilling to rally visibly when the USDX moves lower, and they are declining strongly when the USD moves back up, even if the USD rally is not big, we can say that the implications became strongly bearish.
In yesterday’s alert, we wrote that the major factor due to which we expected temporarily higher PM prices was the weekly reversal in the USD Index, which was likely to trigger a move lower in the USD, which was likely to translate into higher PM prices. Based on what we saw yesterday, the latter part of the above sentence is no longer up-to-date. Based on yesterday’s intraday move lower in the USD it’s no longer likely that the USD would decline shortly.
It could, but it seems to be in the “pause” stage of the correction and by the time it gets to the decline stage and forms the final bottom, the precious metals and mining stocks might already be lower, and the PMs’ rally that the USD’s final slide might cause could take metals back to the current price levels or to the previous high, but it’s unlikely that we’ll see new highs this month.
The above, plus the fact that the True Seasonals and apex-based reversals now point to lower prices makes the short-term outlook bearish, not bullish.
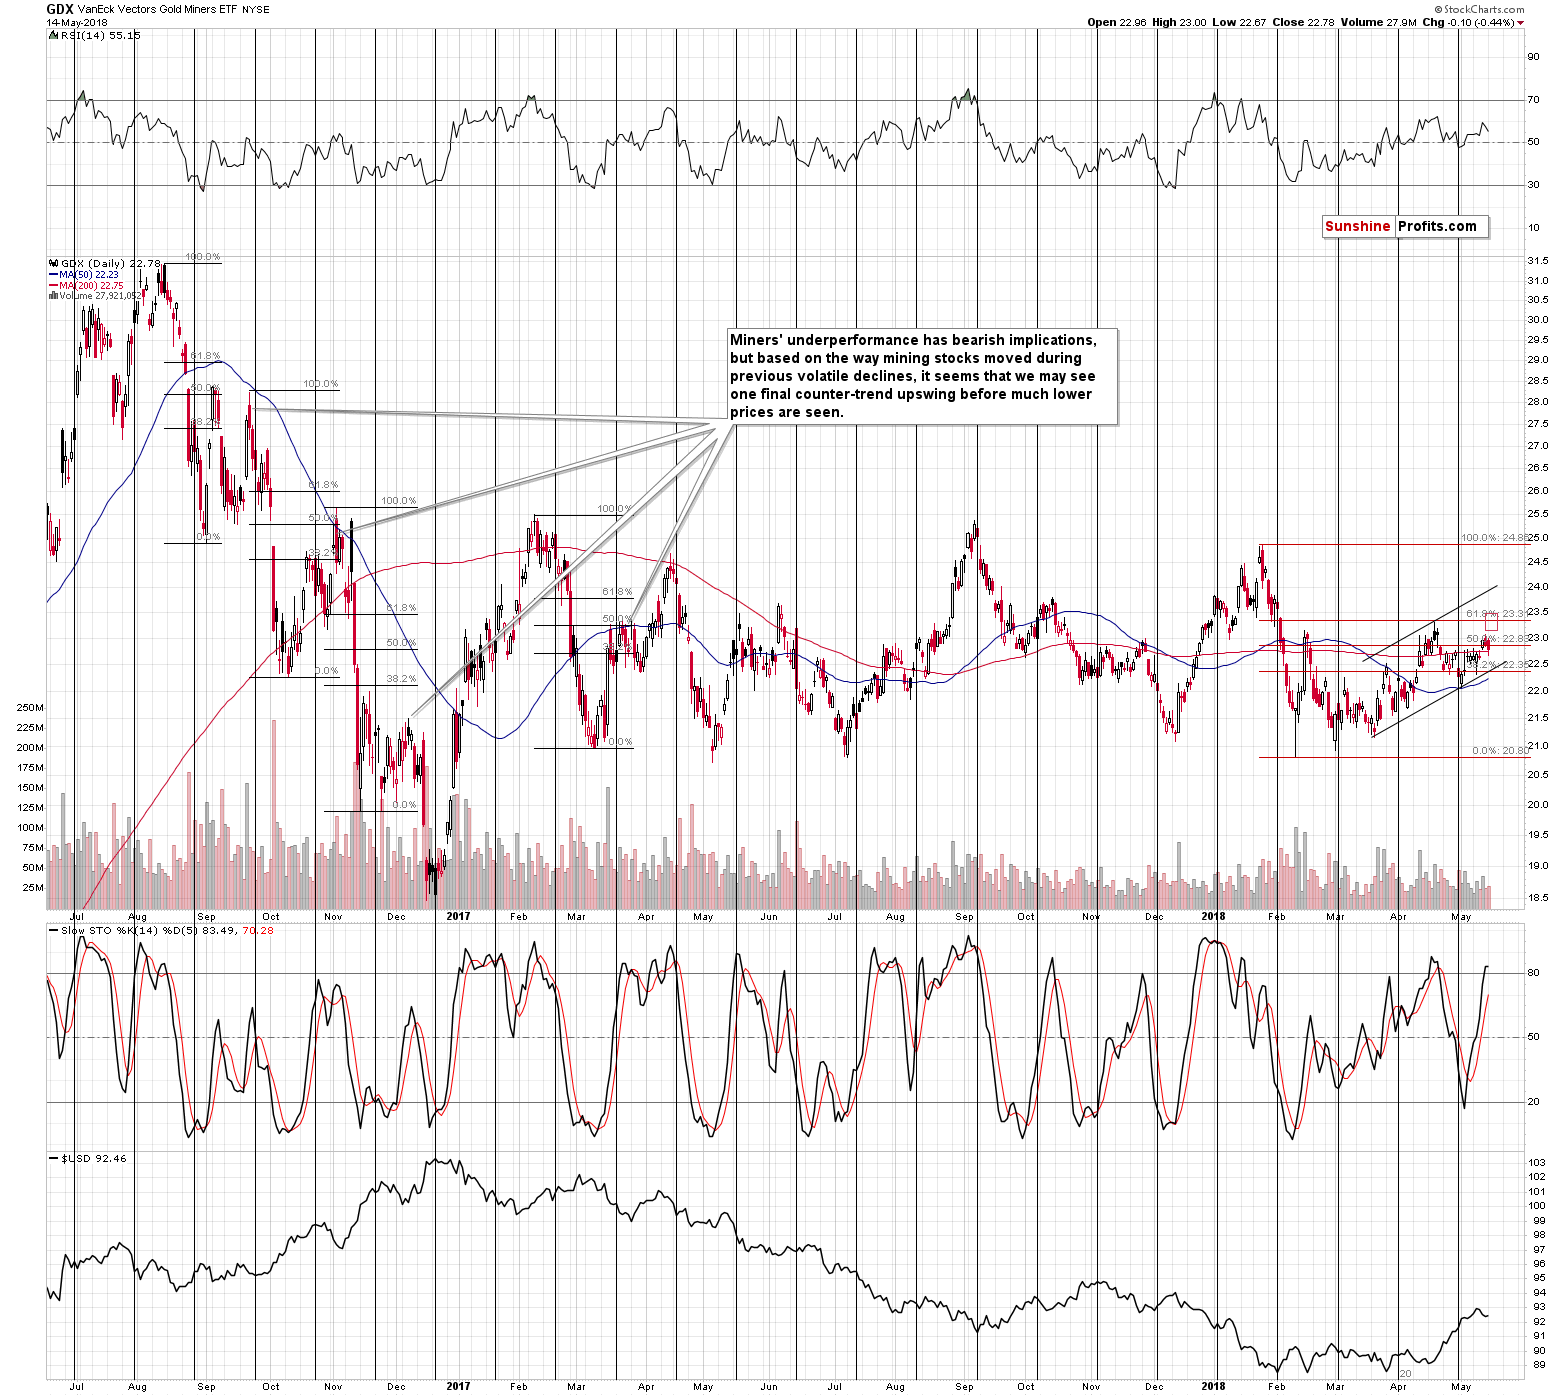
Gold, silver, and mining stocks moved lower and while no indicator flashed any important signal, based on what we already wrote above, you know that the moves were indeed meaningful.
We left the target areas intact. If the USD Index declines more than we expect it to (below 91.6), then this is where metals and miners might move before resuming the downtrend.
Congratulations
Before summarizing, we would like to congratulate you on the profits from the long trade. Metals and miners didn’t reach their upside targets, so you might feel bad about closing the trade at this time. Yet, you’ve done something very difficult – you managed to profit on a trade that was against multiple long-term signals and against a bigger trend. It’s not possible to enter and exit the market right at the tops and bottoms. Tripling the long with silver at $16.10 was quite close but this doesn’t mean that this kind of performance should be expected. Instead, one should look at the profitability over time – that’s yet another profitable trade in a row and one that was very hard to pull off as it was against the medium-term downtrend. You managed to do it and it’s a trading success – congratulations once again.
Summary
Summing up, based on the apex-based reversals, True Seasonal patterns for gold, silver and mining stocks and the way the latter performed yesterday, it seems that the local top is already in. The USD Index may move lower in the coming days, but it’s unclear if it will translate into higher precious metals prices. It’s unlikely, however, that the increase in the PM prices would be significant. Consequently, we are closing the speculative long positions in gold, silver and mining stocks and we are taking profits off the table. At the same time, we are opening speculative short positions.
As always, we will keep you – our subscribers – informed.
To summarize:
Trading capital (supplementary part of the portfolio; our opinion): Full short positions (100% of the full position) in gold, silver and mining stocks are justified from the risk/reward perspective with the following stop-loss orders and initial target price levels:
- Gold: initial target price: $1,218; stop-loss: $1,382; initial target price for the DGLD ETN: $52.98; stop-loss for the DGLD ETN $37.48
- Silver: initial target price: $14.63; stop-loss: $18.06; initial target price for the DSLV ETN: $33.48; stop-loss for the DSLV ETN $19.17
- Mining stocks (price levels for the GDX ETF): initial target price: $19.22; stop-loss: $23.54; initial target price for the DUST ETF: $39.48; stop-loss for the DUST ETF $21.16
In case one wants to bet on junior mining stocks' prices (we do not suggest doing so – we think senior mining stocks are more predictable in the case of short-term trades – if one wants to do it anyway, we provide the details), here are the stop-loss details and initial target prices:
- GDXJ ETF: initial target price: $27.82; stop-loss: $36.14
- JDST ETF: initial target price: $92.88 stop-loss: $40.86
Long-term capital (core part of the portfolio; our opinion): No positions (in other words: cash)
Insurance capital (core part of the portfolio; our opinion): Full position
Important Details for New Subscribers
Whether you already subscribed or not, we encourage you to find out how to make the most of our alerts and read our replies to the most common alert-and-gold-trading-related-questions.
Please note that the in the trading section we describe the situation for the day that the alert is posted. In other words, it we are writing about a speculative position, it means that it is up-to-date on the day it was posted. We are also featuring the initial target prices, so that you can decide whether keeping a position on a given day is something that is in tune with your approach (some moves are too small for medium-term traders and some might appear too big for day-traders).
Plus, you might want to read why our stop-loss orders are usually relatively far from the current price.
Please note that a full position doesn’t mean using all of the capital for a given trade. You will find details on our thoughts on gold portfolio structuring in the Key Insights section on our website.
As a reminder – “initial target price” means exactly that – an “initial” one, it’s not a price level at which we suggest closing positions. If this becomes the case (like it did in the previous trade) we will refer to these levels as levels of exit orders (exactly as we’ve done previously). Stop-loss levels, however, are naturally not “initial”, but something that, in our opinion, might be entered as an order.
Since it is impossible to synchronize target prices and stop-loss levels for all the ETFs and ETNs with the main markets that we provide these levels for (gold, silver and mining stocks – the GDX ETF), the stop-loss levels and target prices for other ETNs and ETF (among other: UGLD, DGLD, USLV, DSLV, NUGT, DUST, JNUG, JDST) are provided as supplementary, and not as “final”. This means that if a stop-loss or a target level is reached for any of the “additional instruments” (DGLD for instance), but not for the “main instrument” (gold in this case), we will view positions in both gold and DGLD as still open and the stop-loss for DGLD would have to be moved lower. On the other hand, if gold moves to a stop-loss level but DGLD doesn’t, then we will view both positions (in gold and DGLD) as closed. In other words, since it’s not possible to be 100% certain that each related instrument moves to a given level when the underlying instrument does, we can’t provide levels that would be binding. The levels that we do provide are our best estimate of the levels that will correspond to the levels in the underlying assets, but it will be the underlying assets that one will need to focus on regarding the signs pointing to closing a given position or keeping it open. We might adjust the levels in the “additional instruments” without adjusting the levels in the “main instruments”, which will simply mean that we have improved our estimation of these levels, not that we changed our outlook on the markets. We are already working on a tool that would update these levels on a daily basis for the most popular ETFs, ETNs and individual mining stocks.
Our preferred ways to invest in and to trade gold along with the reasoning can be found in the how to buy gold section. Additionally, our preferred ETFs and ETNs can be found in our Gold & Silver ETF Ranking.
As a reminder, Gold & Silver Trading Alerts are posted before or on each trading day (we usually post them before the opening bell, but we don't promise doing that each day). If there's anything urgent, we will send you an additional small alert before posting the main one.
=====
Latest Free Trading Alerts:
It’s back. The crucial correlation returned to the gold market. Does it herald important shifts in trends?
Bitcoin stabilized, went up, went down and now is going up again. The ride has been wild and the opinions on the outlook in the market have been shifting. We hold a steady course and strive to filter out all the noise to give you the most relevant information. An there’s rarely a more important time than now for that. The tide might have turned and we’re on the lookout for a confirmation of the trigger. Such a confirmation could increase the profits on our hypothetical position.
=====
Hand-picked precious-metals-related links:
PRECIOUS-Gold dips as dollar firms, yields rise
=====
In other news:
Global stocks sink as soft China data, trade fears weigh
What Fed Officials Are Saying About the Flattening Yield Curve
Why a rising dollar risks unbalancing the world outside the US
Bitcoin Slides as Bitcoin Cash Hard Fork Looms
=====
Thank you.
Sincerely,
Przemyslaw Radomski, CFA
Founder, Editor-in-chief, Gold & Silver Fund Manager
Gold & Silver Trading Alerts
Forex Trading Alerts
Oil Investment Updates
Oil Trading Alerts

