

Briefly: in our opinion, full (100% of the regular size of the position) speculative short positions in gold, silver and mining stocks are justified from the risk/reward perspective at the moment of publishing this alert. In other words, we are switching from a long to short trading position.
After many days of strong performance of mining stocks, we finally saw a day, when they clearly underperformed the price of gold. Both: gold and silver rallied initially yesterday, only to move back down later during the US sessions, but overall, they still moved higher yesterday. Mining stocks didn’t. The GDX formed a big red candlestick and some may say that this marks the end of the rally in the precious metals sector. Would they be correct? Is it high time to cash in the profits and move to the short side of the market?
In short, yes, but that was not the preferred course of action until we saw today’s pre-market decline. Based on yesterday’s price action alone, the outlook became much less bearish and we were leaning toward only closing the previous long positions without opening new ones. The reason is overall poor action in gold and silver during the rally and the fact that mining stocks showed weakness after reaching two important resistance levels: one in the HUI Index, and one in its ratio with gold.
Let’s take a closer look at the charts (charts courtesy of http://stockcharts.com).
Relative Performance of Gold, Silver and Gold Stocks
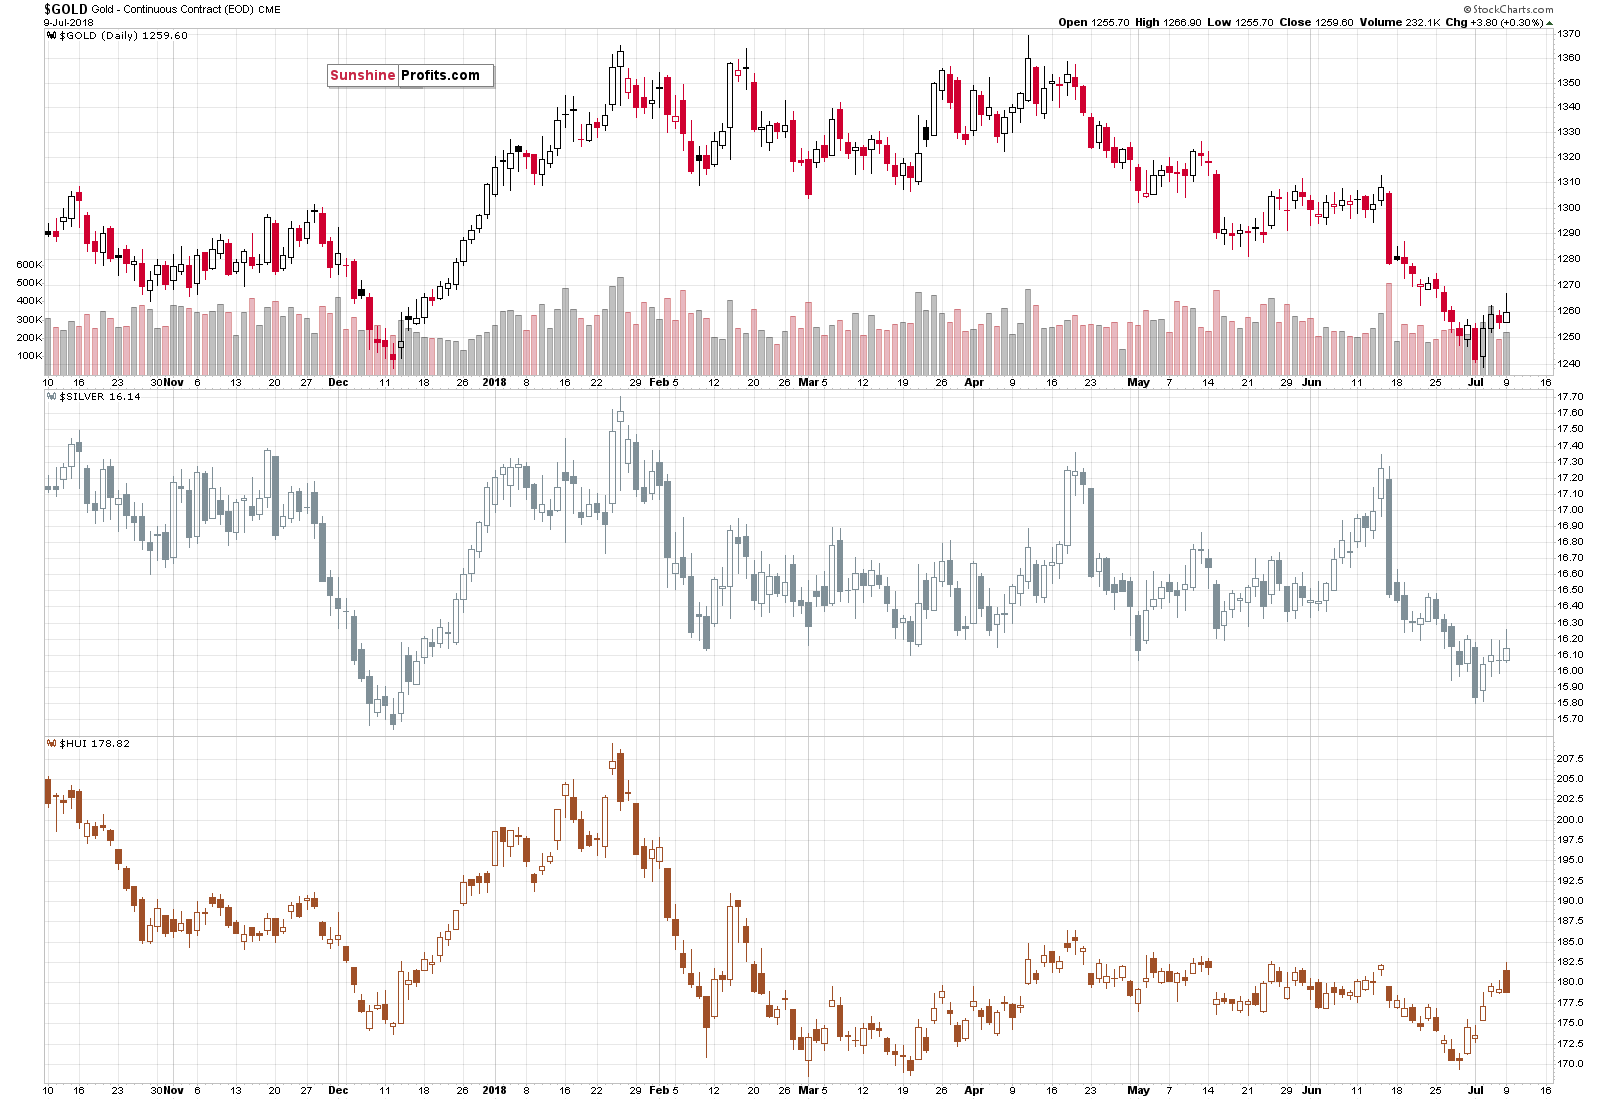
Gold and silver moved higher, while mining stocks moved lower. It was not a coincidence – the HUI Index, other proxy for mining stocks closed yesterday’s session lower as well.
Just as mining stocks’ strength was a bullish sign previously, it’s weakness was a bearish sign.
Of course, just one day and just one indication is not enough to change the outlook. But that was not the only indication.
Gold Stocks and their Ratio with Gold
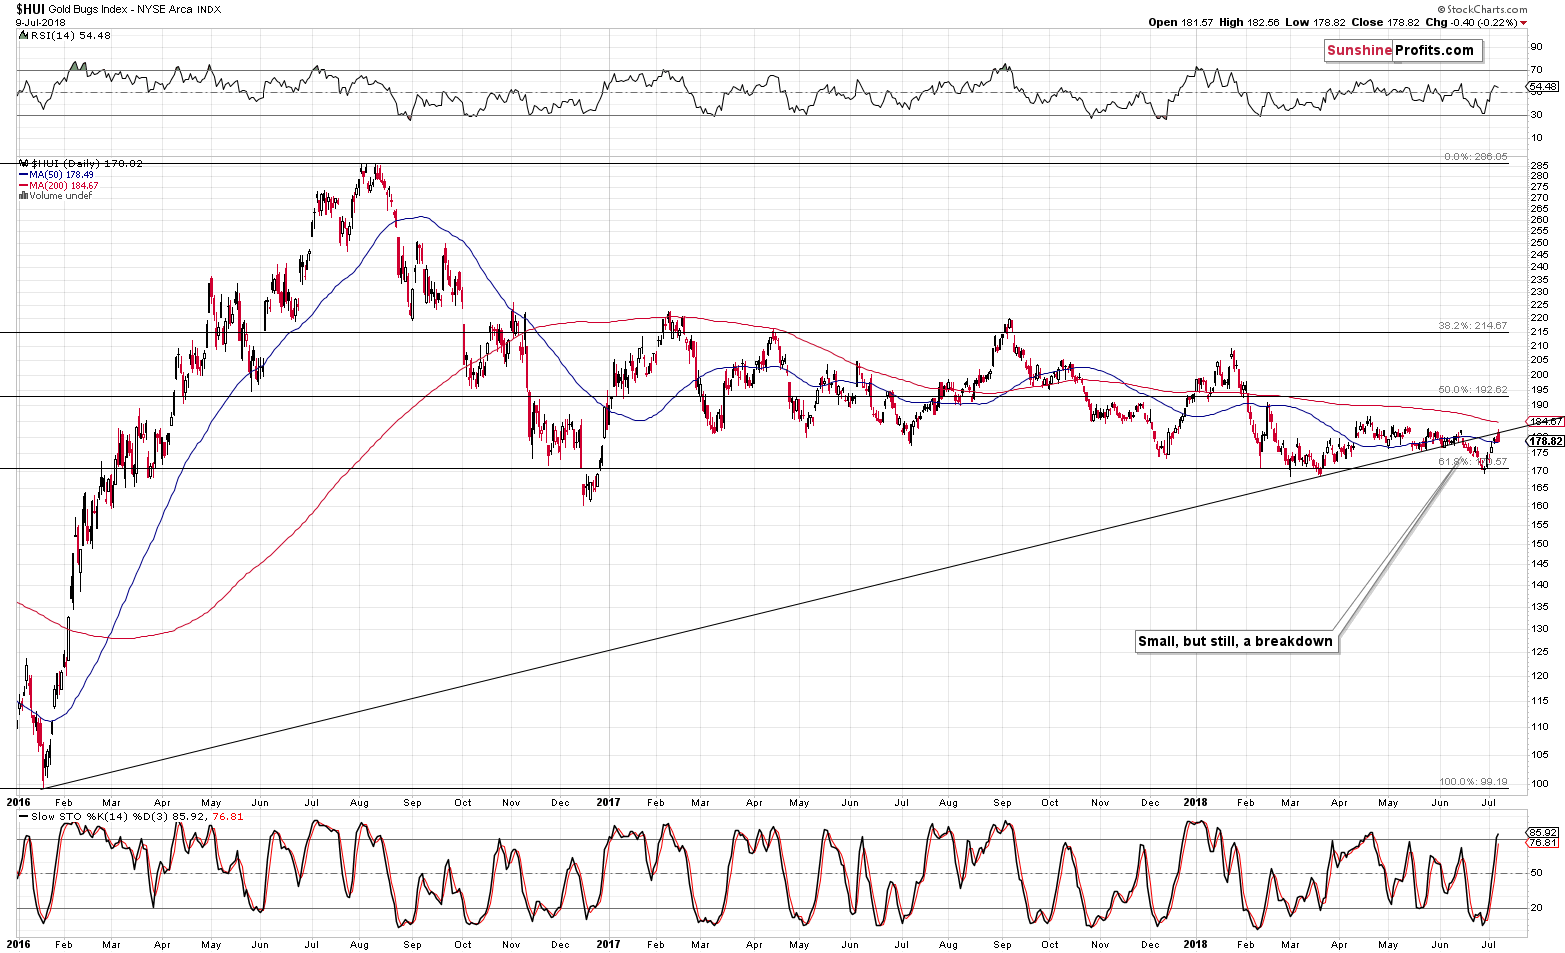
The HUI Index just moved to its June high and – more importantly – to its rising medium-term resistance line, below which it broke a few weeks ago. From the technical point of view, the breakdown was simply verified – the above chart (on its own) has no bullish implications. It has bearish ones.
After the breakdown, the rising line became a natural price target for a short-term rally and it was just reached. Combined with the previously mentioned underperformance in the miners relative to gold it seems quite toppy.
But wait, there’s more.
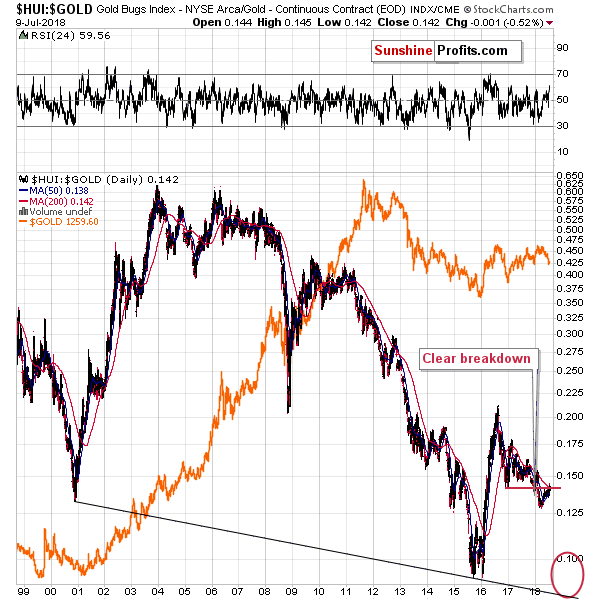
Remember the key breakdown that we saw earlier this year? Gold stocks to gold ratio broke below the long-term support created by the late-2016 low, which was a very important sign pointing to a medium-term decline in the precious metals market.
This breakdown was just verified as the ratio just moved back to the late-2016 low, tried to move above it, and failed. The long-term signals, support lines, breakdowns etc. are more important than the short-term ones, so the above is an important issue.
The implications are bearish for the entire precious metals sector in general. The above indicates that the days of gold stocks outperformance relative to gold are over and that we saw an important turnaround in the PM market in general.
Combining all the three above-mentioned factors creates a quite strong bearish case for the PMs.
Having said that, let’s take a look at gold.
Gold’s Rally and Verification
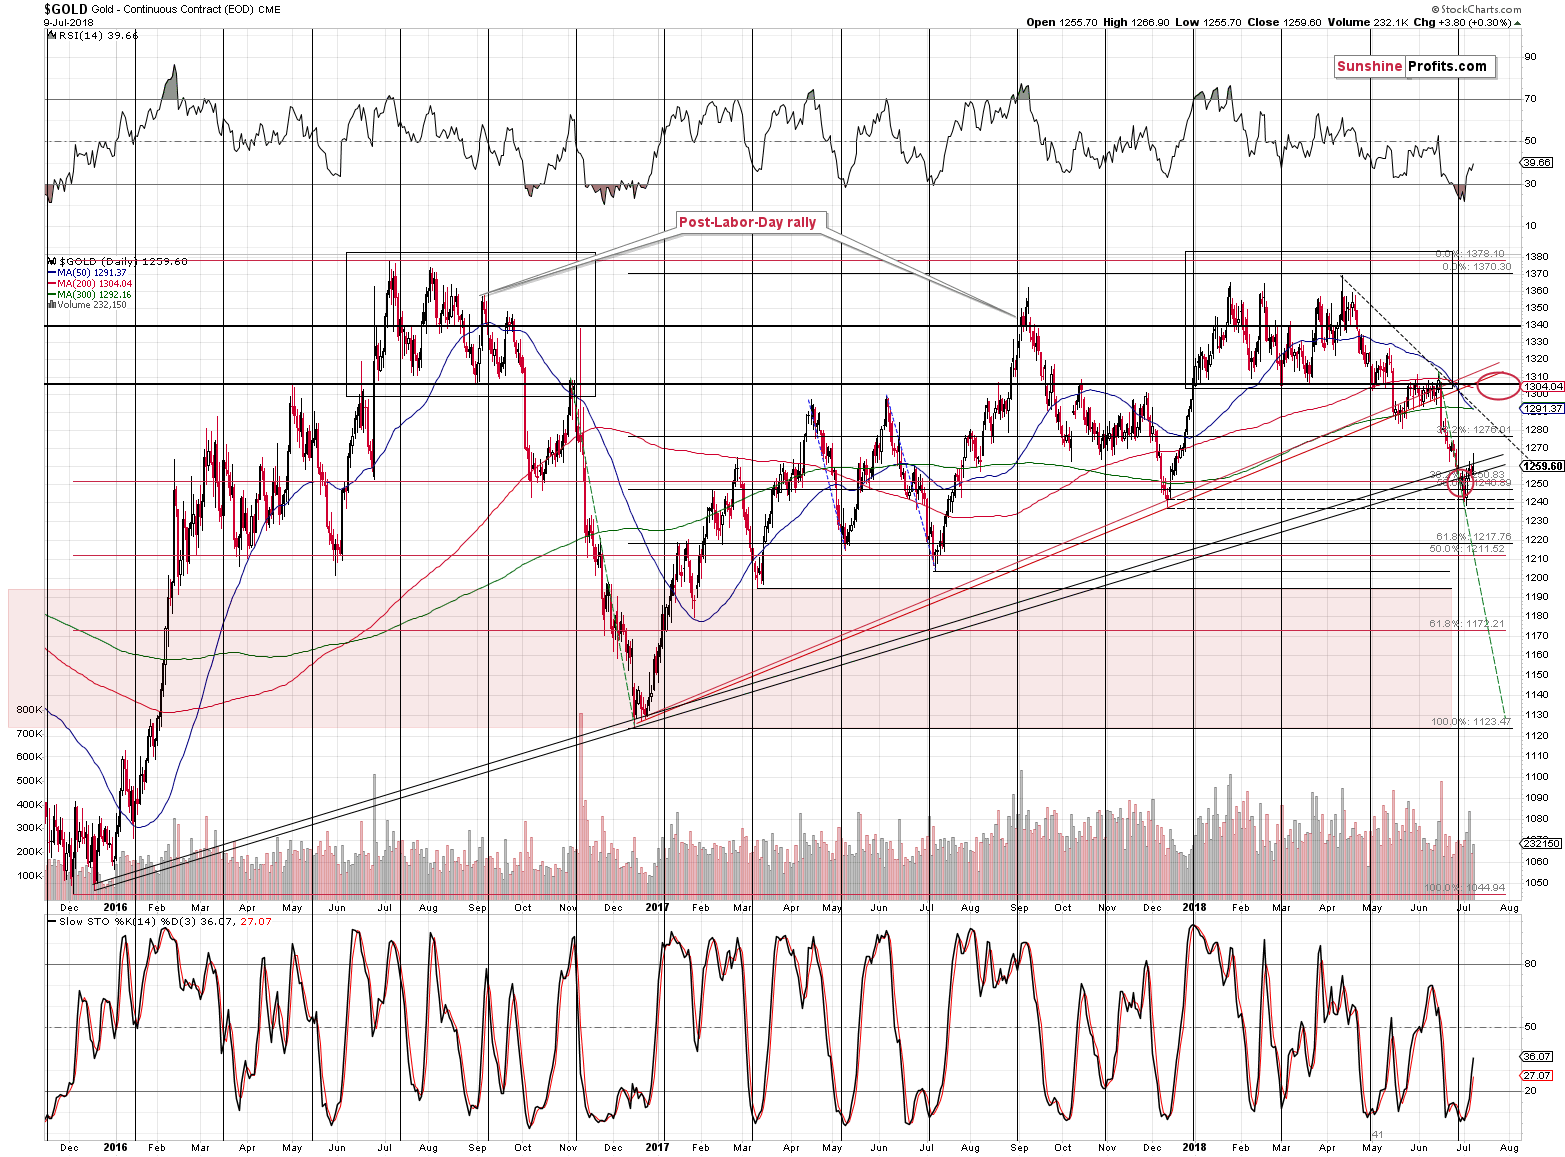
Gold moved higher in the past several days, just like it was likely to based on several techniques. One of them was gold’s move to the rising medium-term support line based on the late 2015 and late 2016 bottoms. But, instead of rallying after reaching this line, gold moved below it and then rallied back up to it. Initially, gold reacted in a strong manner, but instead of invalidating the breakdown and rallying to $1,300 (which seemed quite realistic given very oversold situation in terms of the RSI indicator), gold just moved back to the rising support line and verified it as resistance.
One could say that it just attempted to move higher yesterday, and it will be successful today, but in light of today’s pre-market decline it seems that the odds for seeing a breakout are limited.
Verifications of breakdowns are bearish developments, so the above makes the outlook more bearish for the short term.
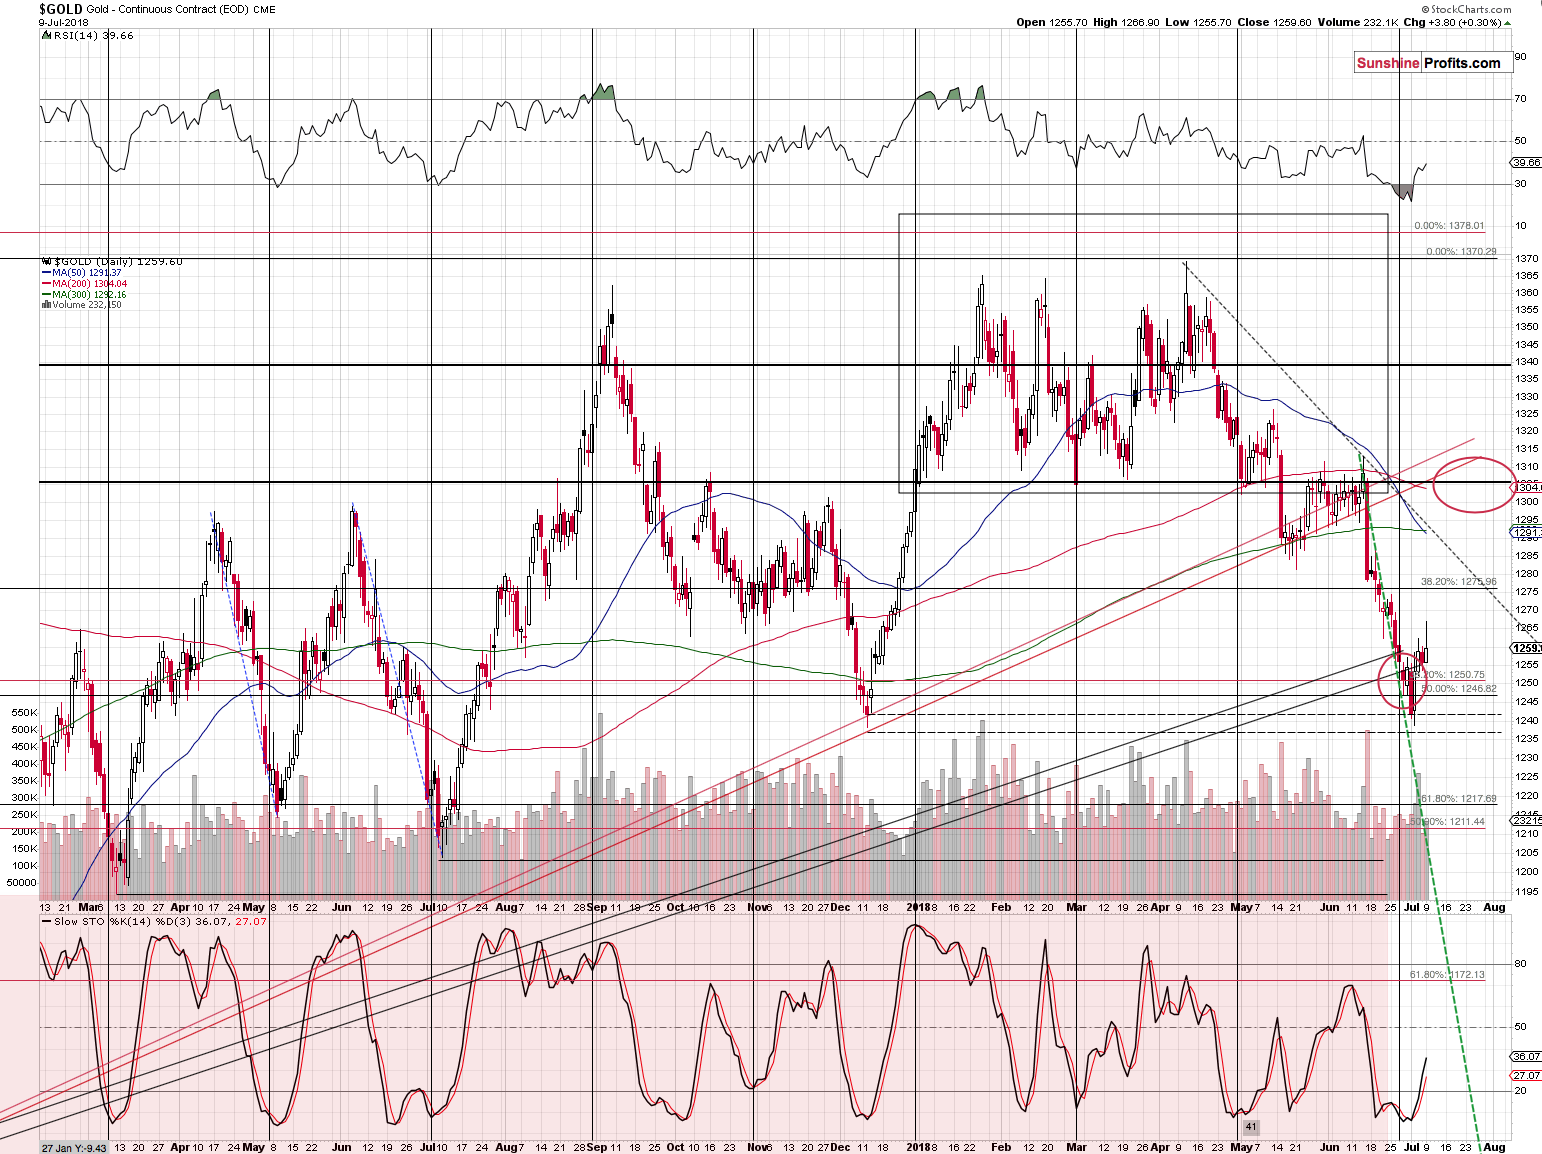
Zooming in, we see that gold formed a reversal candlestick, which is actually the weakest of the bearish signals that we have right now (it barely counts).
It would be bullish, but it was accompanied by rather average volume, not a big one. Volume confirmations are important and we haven’t seen one yesterday.
Still, we have 3 bearish factors from the mining stocks and one (breakdown’s confirmation) from gold, which is a bearish combination even without volume’s confirmation in case of the daily reversal candlestick.
But shouldn’t gold rally based on the GLD ETF chart that you discussed yesterday?
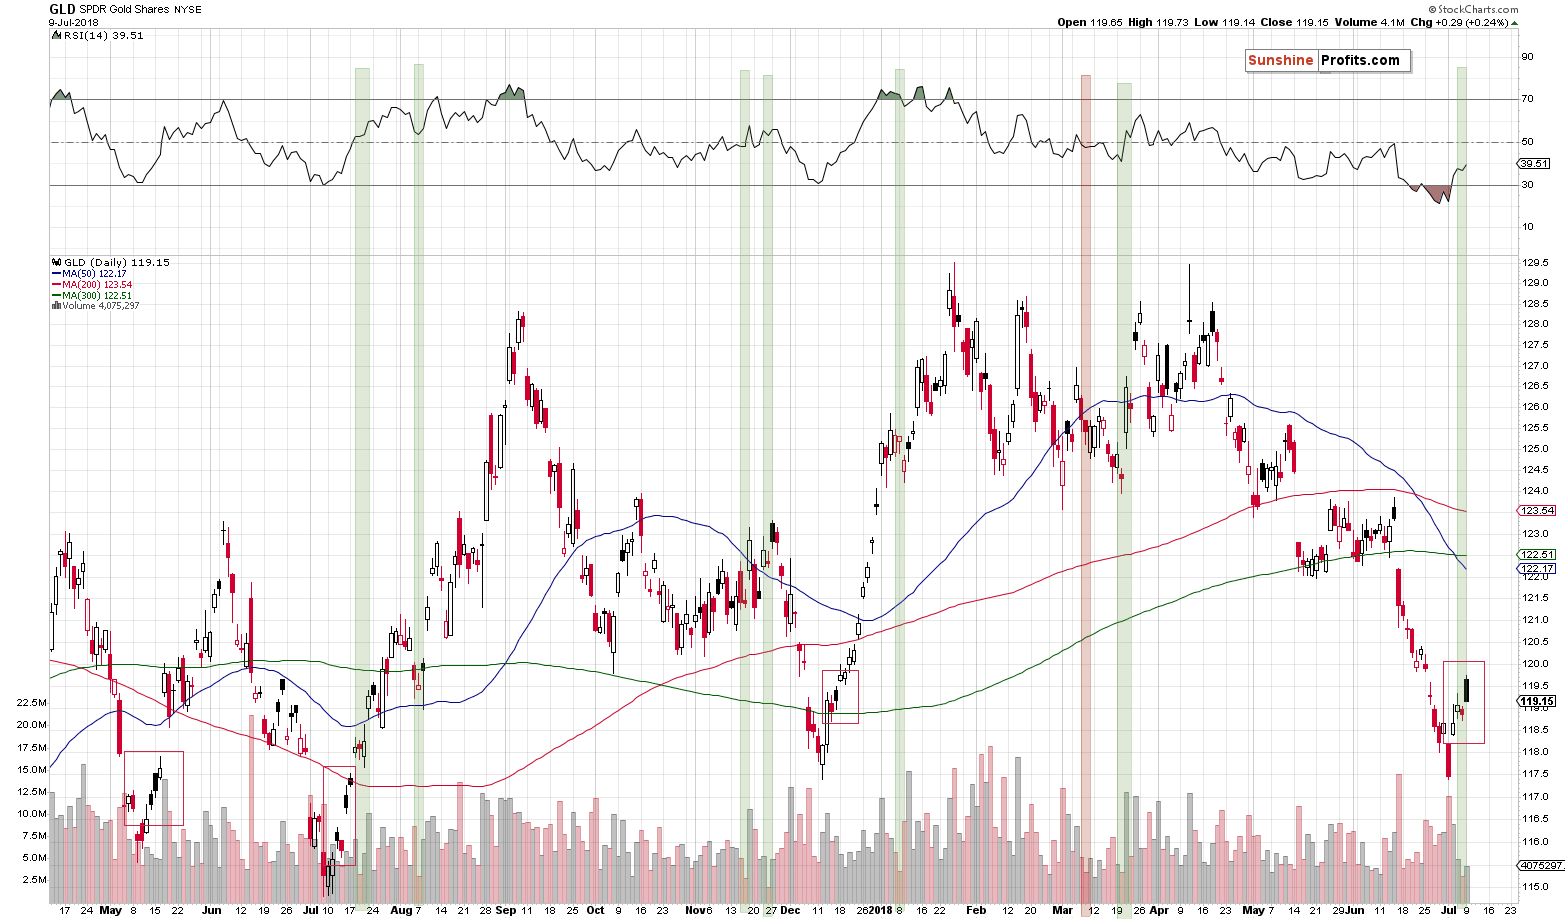
The above chart was indeed bullish based on Friday’s lack of action and tiny volume, but is currently neutral.
Yesterday we saw a specific session – the one in which GLD moved lower on an intraday basis, but still managed to close above the previous day’s closing price. These sessions are often seen right before declines, like the one in mid-June and in the second half of April. But, there were also a few cases when we saw them in the early part of a bigger rally. We marked those cases with red rectangles.
Since the rally that we saw was not huge so far, it’s not clear whether the shape of yesterday’s session should be interpreted as something normal in the early part of a bigger rally, or as an indication of rally’s end.
The jury is still out on this issue, but the previously described 4 bearish factors are enough to make the outlook bearish for the short term.
Silver’s Low-volume Rally
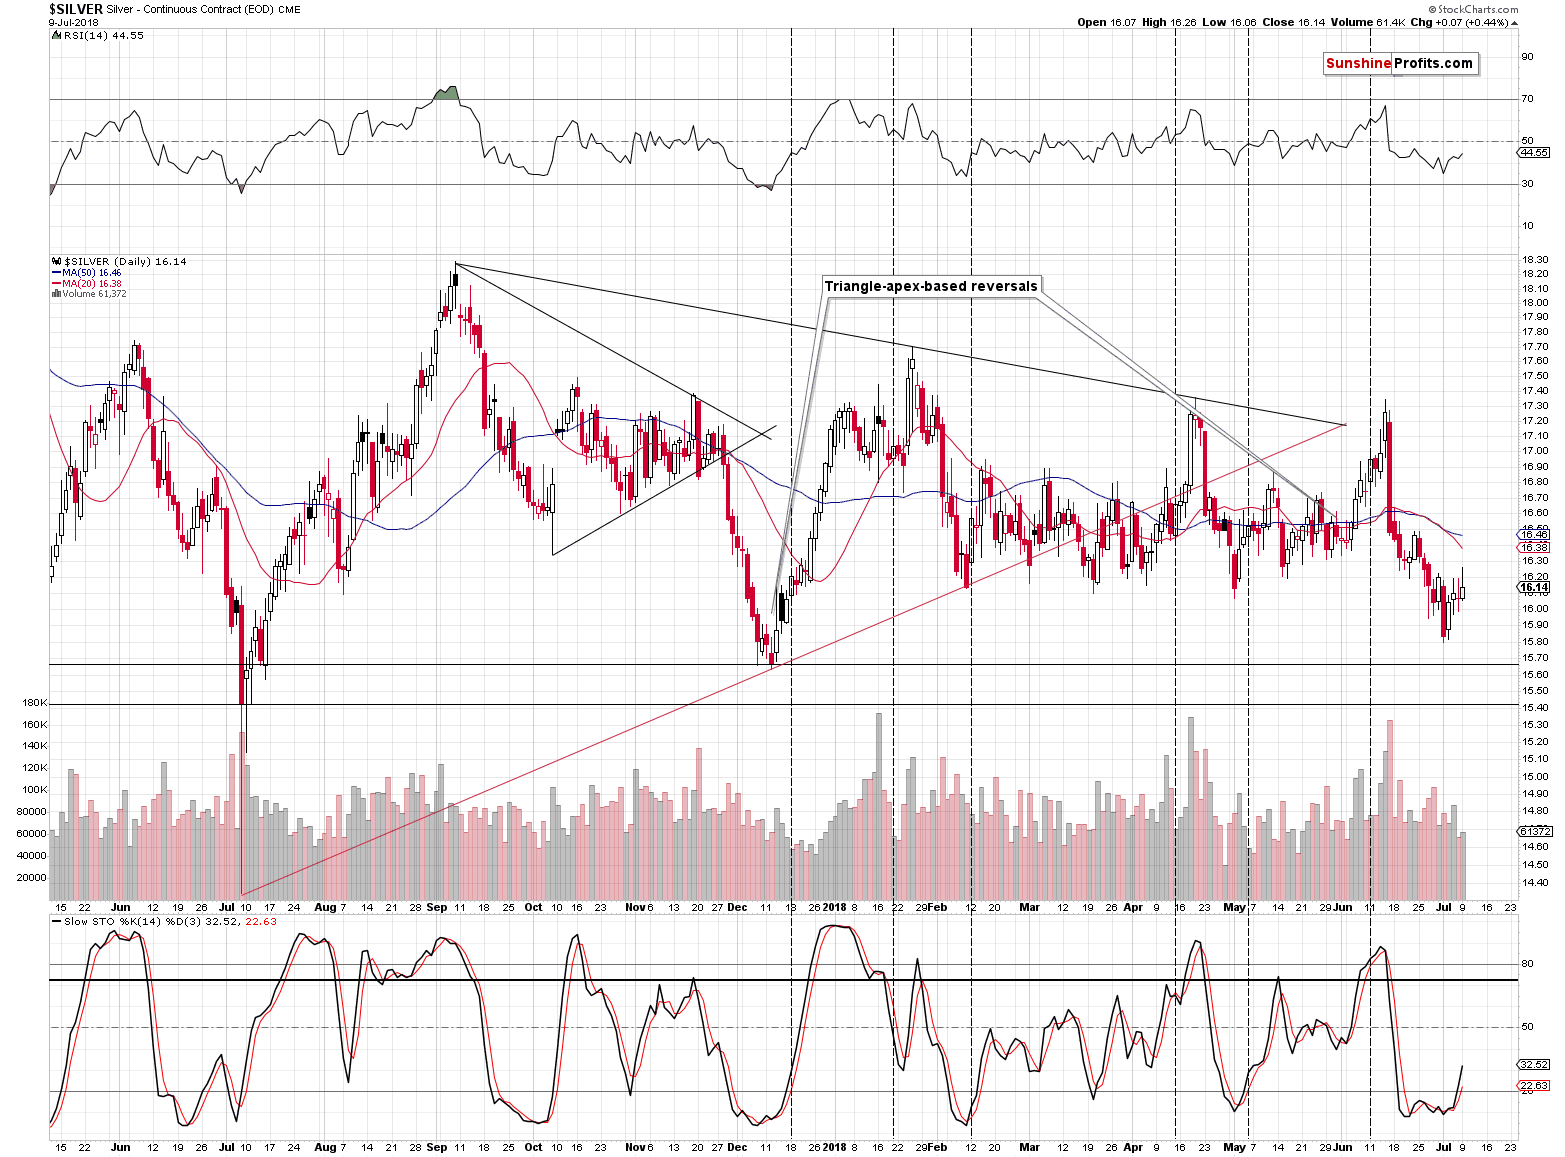
Silver moved higher on volume that was a bit lower than what we saw previously, and it reversed before the end of the day. As it is the case with gold, the reversal is not really bearish since the volume was not huge.
In fact, there were quite a few cases when silver’s low-volume rallies were followed by higher prices and we marked those cases with dashed lines. The implications are only somewhat bullish on this analogy, because low volume sessions sometimes ended rallies as well. For instance,the early-June 2017 top in silver was formed on relatively low volume and it was what started the most profound decline of the recent past.
So, the silver chart actually seems to have bullish implications despite the bearishness in gold and mining stocks, but let’s keep in mind that the strength of the bullish implications here is limited.
Forex Reaction
Earlier today gold and silver took a dive given a relatively small (less than 0.4) move higher in the USD Index, which is a sign of weakness.
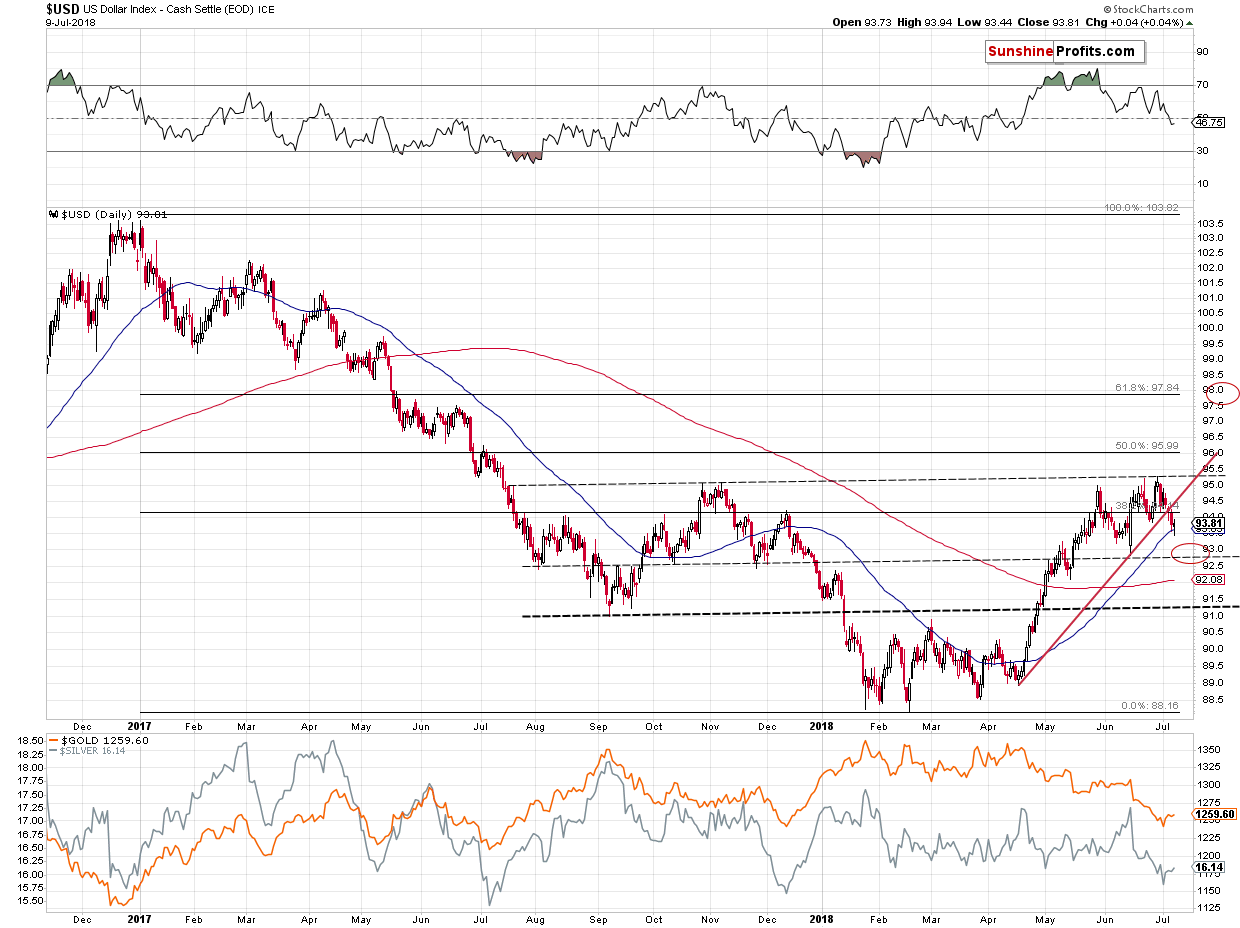
If the USD Index is going to move lower – to our target area it’s not a big deal. After all, with lower USD, gold is still likely to be higher. But, if gold’s starting to magnify USD’s upswings, while mostly ignoring its downswings (even if USD is only halfway done declining, gold is not halfway up toward $1,300), it is indeed a big deal. The reason is that the shift in the way gold reacts to USD’s strengths and weaknesses changes the overall implications that the forex has in the PM market.
Rather unclear short-term situation plus bearish relative strength equals rather bearish overall implications.
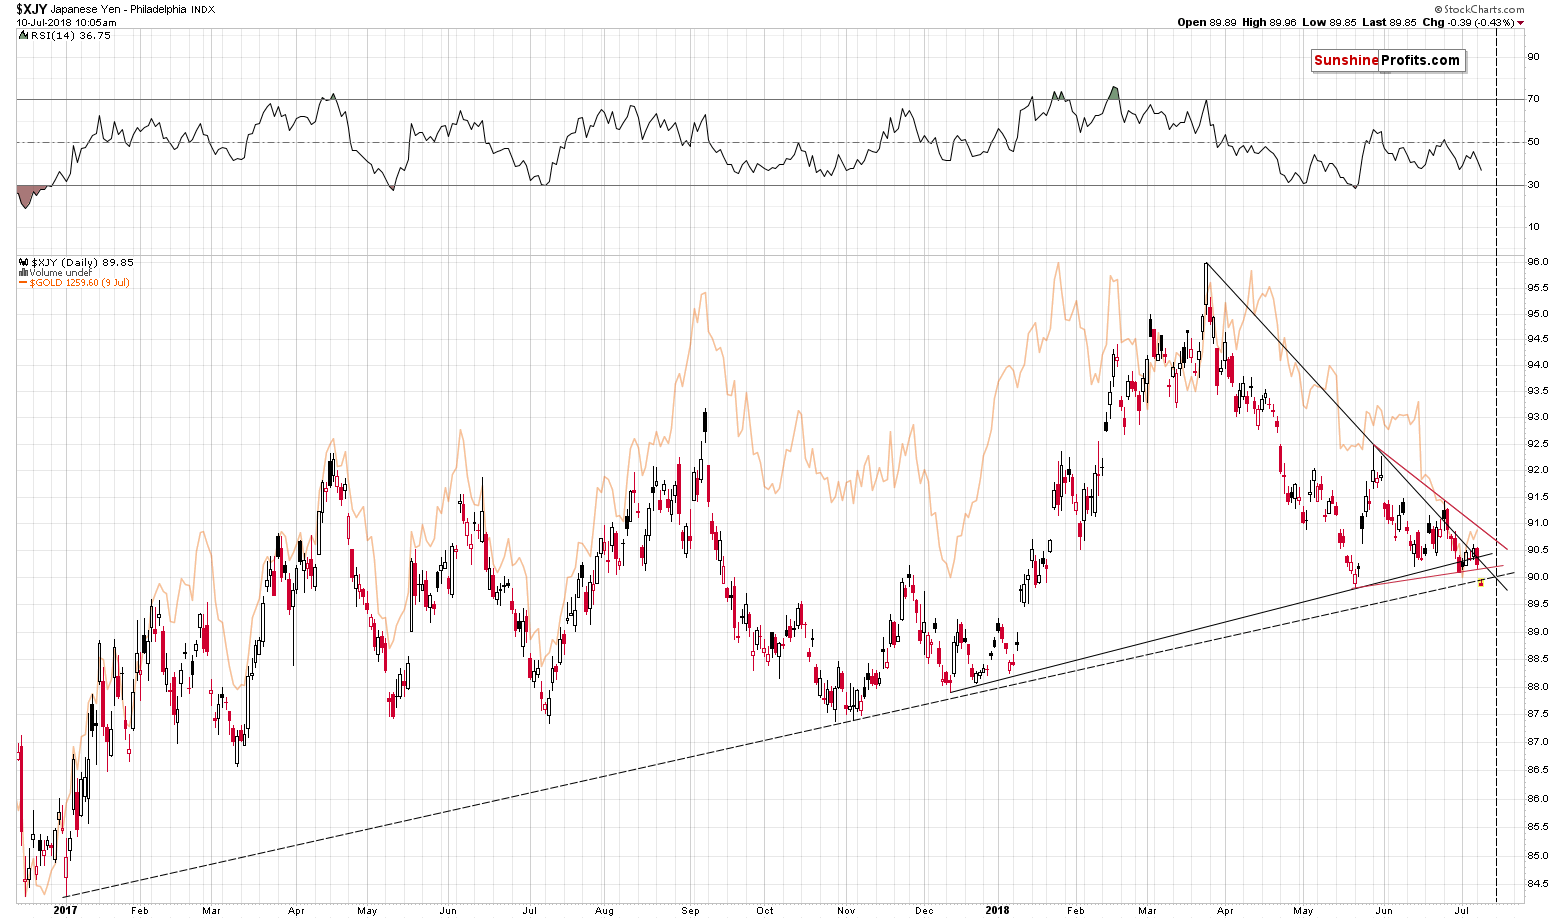
The gold price quite often moves in tune with the Japanese yen. The latter just broke below several support levels, which has very bearish implications going forward. Naturally, the breakdowns were not confirmed, but it’s clear that the implications for the precious metals market are much more bearish than bullish.
Summary
Summing up, due to several developments, the outlook for the precious metals market in the short term has just significantly deteriorated. Mining stocks’ underperformance, HUI reaching its target, HUI to gold ratio at a critical resistance, the relative strength of gold vs. the USD, the breakdown in the Japanese yen all point to lower precious metals prices. There are some bullish signs left, but overall the outlook is already bearish enough to justify a short position. We will likely increase the size of this position once we get more bearish confirmations, but we are not doing so at this time.
We previously wrote that profiting on a counter-trend bounce during a strong medium-term downtrend will be a very difficult thing to do, but it seems that we managed to do it. The positions in gold and silver are being closed a bit below their entry prices, but we are cashing in substantial profits from the mining stocks, so the overall position from the entire trio is profitable. That’s yet another profitable trade in a row.
As always, we’ll keep you – our subscribers – informed.
To summarize:
Trading capital (supplementary part of the portfolio; our opinion): Full short positions (100% of the full position) in gold, silver and mining stocks are justified from the risk/reward perspective with the following stop-loss orders and initial target price levels:
- Gold: initial target price: $1,142; stop-loss: $1,272; initial target price for the DGLD ETN: $63.96; stop-loss for the DGLD ETN $46.38
- Silver: initial target price: $14.42; stop-loss: $16.46; initial target price for the DSLV ETN: $32.97; stop-loss for the DSLV ETN $24.07
- Mining stocks (price levels for the GDX ETF): initial target price: $19.12; stop-loss: $23.64; initial target price for the DUST ETF: $37.97; stop-loss for the DUST ETF $20.87
In case one wants to bet on junior mining stocks' prices (we do not suggest doing so – we think senior mining stocks are more predictable in the case of short-term trades – but if one wants to do it anyway, we provide the details), here are the stop-loss details and initial target prices:
- GDXJ ETF: initial target price: $28.10; stop-loss: $34.82
- JDST ETF: initial target price: $74.83 stop-loss: $42.78
Long-term capital (core part of the portfolio; our opinion): No positions (in other words: cash)
Insurance capital (core part of the portfolio; our opinion): Full position
Important Details for New Subscribers
Whether you already subscribed or not, we encourage you to find out how to make the most of our alerts and read our replies to the most common alert-and-gold-trading-related-questions.
Please note that the in the trading section we describe the situation for the day that the alert is posted. In other words, it we are writing about a speculative position, it means that it is up-to-date on the day it was posted. We are also featuring the initial target prices, so that you can decide whether keeping a position on a given day is something that is in tune with your approach (some moves are too small for medium-term traders and some might appear too big for day-traders).
Plus, you might want to read why our stop-loss orders are usually relatively far from the current price.
Please note that a full position doesn’t mean using all of the capital for a given trade. You will find details on our thoughts on gold portfolio structuring in the Key Insights section on our website.
As a reminder – “initial target price” means exactly that – an “initial” one, it’s not a price level at which we suggest closing positions. If this becomes the case (like it did in the previous trade) we will refer to these levels as levels of exit orders (exactly as we’ve done previously). Stop-loss levels, however, are naturally not “initial”, but something that, in our opinion, might be entered as an order.
Since it is impossible to synchronize target prices and stop-loss levels for all the ETFs and ETNs with the main markets that we provide these levels for (gold, silver and mining stocks – the GDX ETF), the stop-loss levels and target prices for other ETNs and ETF (among other: UGLD, DGLD, USLV, DSLV, NUGT, DUST, JNUG, JDST) are provided as supplementary, and not as “final”. This means that if a stop-loss or a target level is reached for any of the “additional instruments” (DGLD for instance), but not for the “main instrument” (gold in this case), we will view positions in both gold and DGLD as still open and the stop-loss for DGLD would have to be moved lower. On the other hand, if gold moves to a stop-loss level but DGLD doesn’t, then we will view both positions (in gold and DGLD) as closed. In other words, since it’s not possible to be 100% certain that each related instrument moves to a given level when the underlying instrument does, we can’t provide levels that would be binding. The levels that we do provide are our best estimate of the levels that will correspond to the levels in the underlying assets, but it will be the underlying assets that one will need to focus on regarding the signs pointing to closing a given position or keeping it open. We might adjust the levels in the “additional instruments” without adjusting the levels in the “main instruments”, which will simply mean that we have improved our estimation of these levels, not that we changed our outlook on the markets. We are already working on a tool that would update these levels on a daily basis for the most popular ETFs, ETNs and individual mining stocks.
Our preferred ways to invest in and to trade gold along with the reasoning can be found in the how to buy gold section. Additionally, our preferred ETFs and ETNs can be found in our Gold & Silver ETF Ranking.
As a reminder, Gold & Silver Trading Alerts are posted before or on each trading day (we usually post them before the opening bell, but we don't promise doing that each day). If there's anything urgent, we will send you an additional small alert before posting the main one.
=====
Latest Free Trading Alerts:
Tightening is coming, brace yourself! And we mean ‘tightening’, not just the removal of monetary accommodation. Why we think so? Let’s read our article about the recent FOMC minutes and find out!
=====
Hand-picked precious-metals-related links:
PRECIOUS-Gold prices slip on dollar rebound, seen re-testing low
2,500 job cuts weren’t enough for world’s no. 2 platinum miner
=====
In other news:
A U.S. Recession Indicator Flashes Red for Leuthold's Paulsen
South Korea policy rate seen on hold in July, could be raised by year-end: Reuters poll
Could Trump's tariff race shift the global economic balance?
Here’s What the World’s Biggest Investor Thinks the Markets Will Do Next
Do not blame OPEC, oil producer group says of Trump criticism
=====
Thank you.
Sincerely,
Przemyslaw Radomski, CFA
Founder, Editor-in-chief, Gold & Silver Fund Manager
Gold & Silver Trading Alerts
Forex Trading Alerts
Oil Investment Updates
Oil Trading Alerts

