

Briefly: In our opinion, full (200% of the regular size of the position) speculative short positions in gold, silver and mining stocks are justified from the risk/reward perspective at the moment of publishing this alert.
The precious metals market reversed and declined just as we’d been expecting it to and this year’s profits from the short positions have further increased. It seems that the best is yet to come, though.
Today’s alert is going to be rather short as basically everything that we have written so far this week remains up-to-date and the most recent price performance of gold, silver and mining stocks confirms it. They all declined yesterday and are moving lower in today’s pre-market trading as well.
Let’s take a closer look at what happened, starting with gold (chart courtesy of http://stockcharts.com).
Gold and Silver Reversals
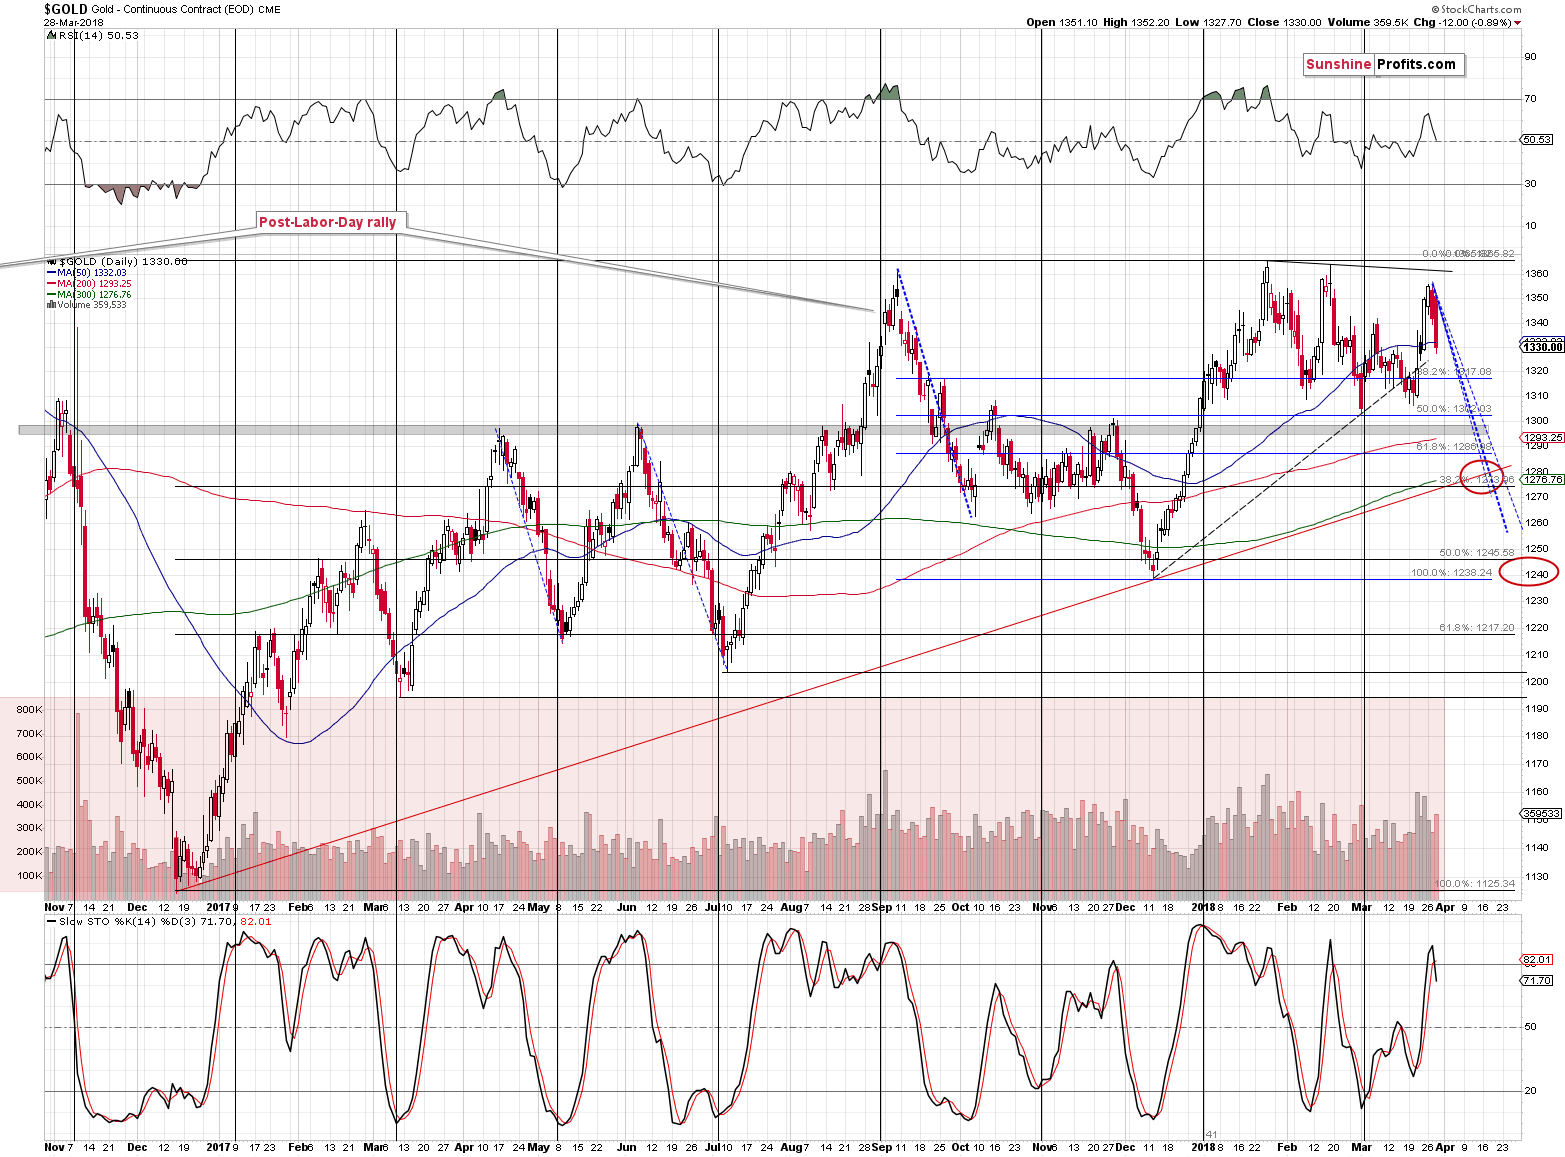
Gold declined substantially and erased the previous several days in just one day. At the same time, gold closed below its 50-day moving average and the early-March high. Both are bearish developments and the sell signal from the Stochastic indicator serves as a confirmation.
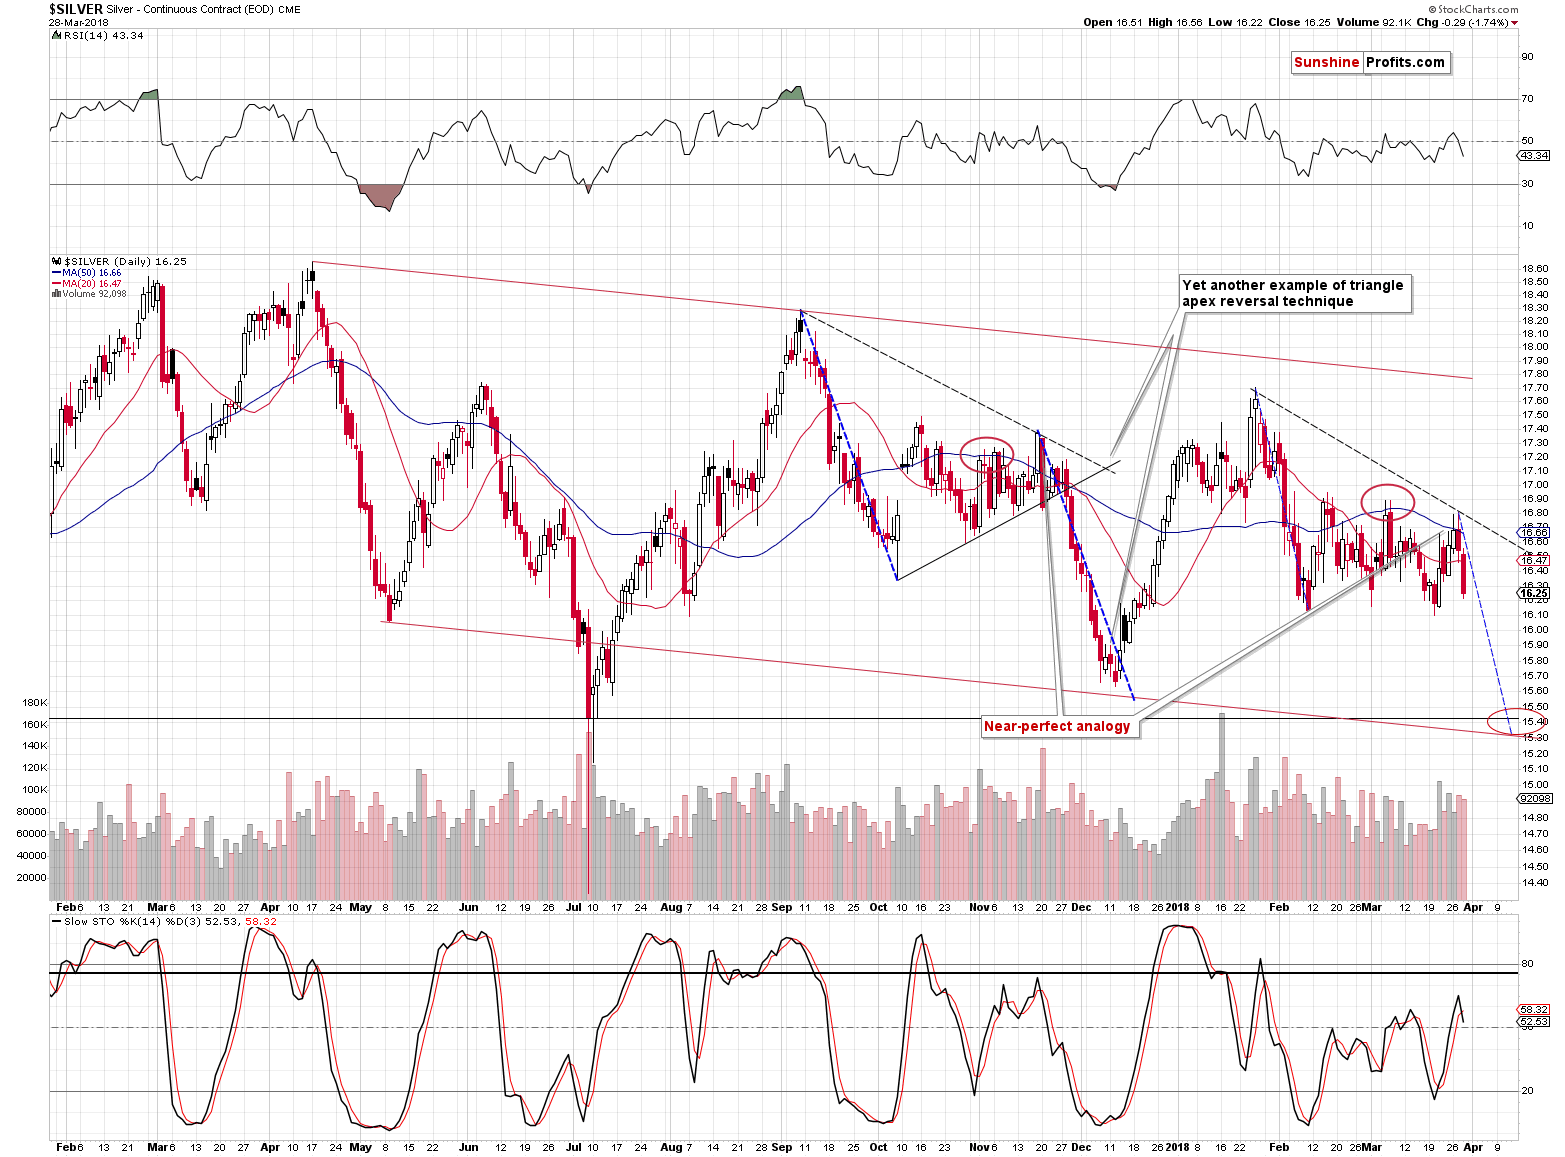
The price of silver declined as well and yesterday’s closing price was the second lowest that we saw this month. The analogy to silver’s price performance in late November 2017 remains intact and so do our comments on it:
The particularly noteworthy thing on the white metal’s chart is the way in which we can view the self-similar pattern between now and back in November 2017. After the early-March volatile daily upswing, we thought that it was a direct analogy to the mid-November upswing that had been the final rally before the decline. And this might have been the case but based on the fundamental news (Powell-related-uncertainty and trade conflict) gold rallied and thus silver more or less had to rally as well. Consequently, the pattern changed, but not completely. The pattern still seems to be intact, but in a slightly different way.
You see, there were actually three smaller tops in October and November 2017 before silver started to slide – if we count the early-November high as well. The early-March high was the second top and we’re seeing the third – and most likely final – top right now. In fact, it seems that we already saw it this week. Silver moved above the 50-day moving average and once again invalidated this move almost instantly. It’s moving lower also during today’s pre-market trading.
Consequently, even though silver’s self-similar pattern is slightly different, it still has the same bearish implications.
Self-similarity in Gold Stocks
In yesterday’s alert, we wrote that silver was not the only market that featured a self-similar pattern. There was also one in gold stocks. We wrote the following:
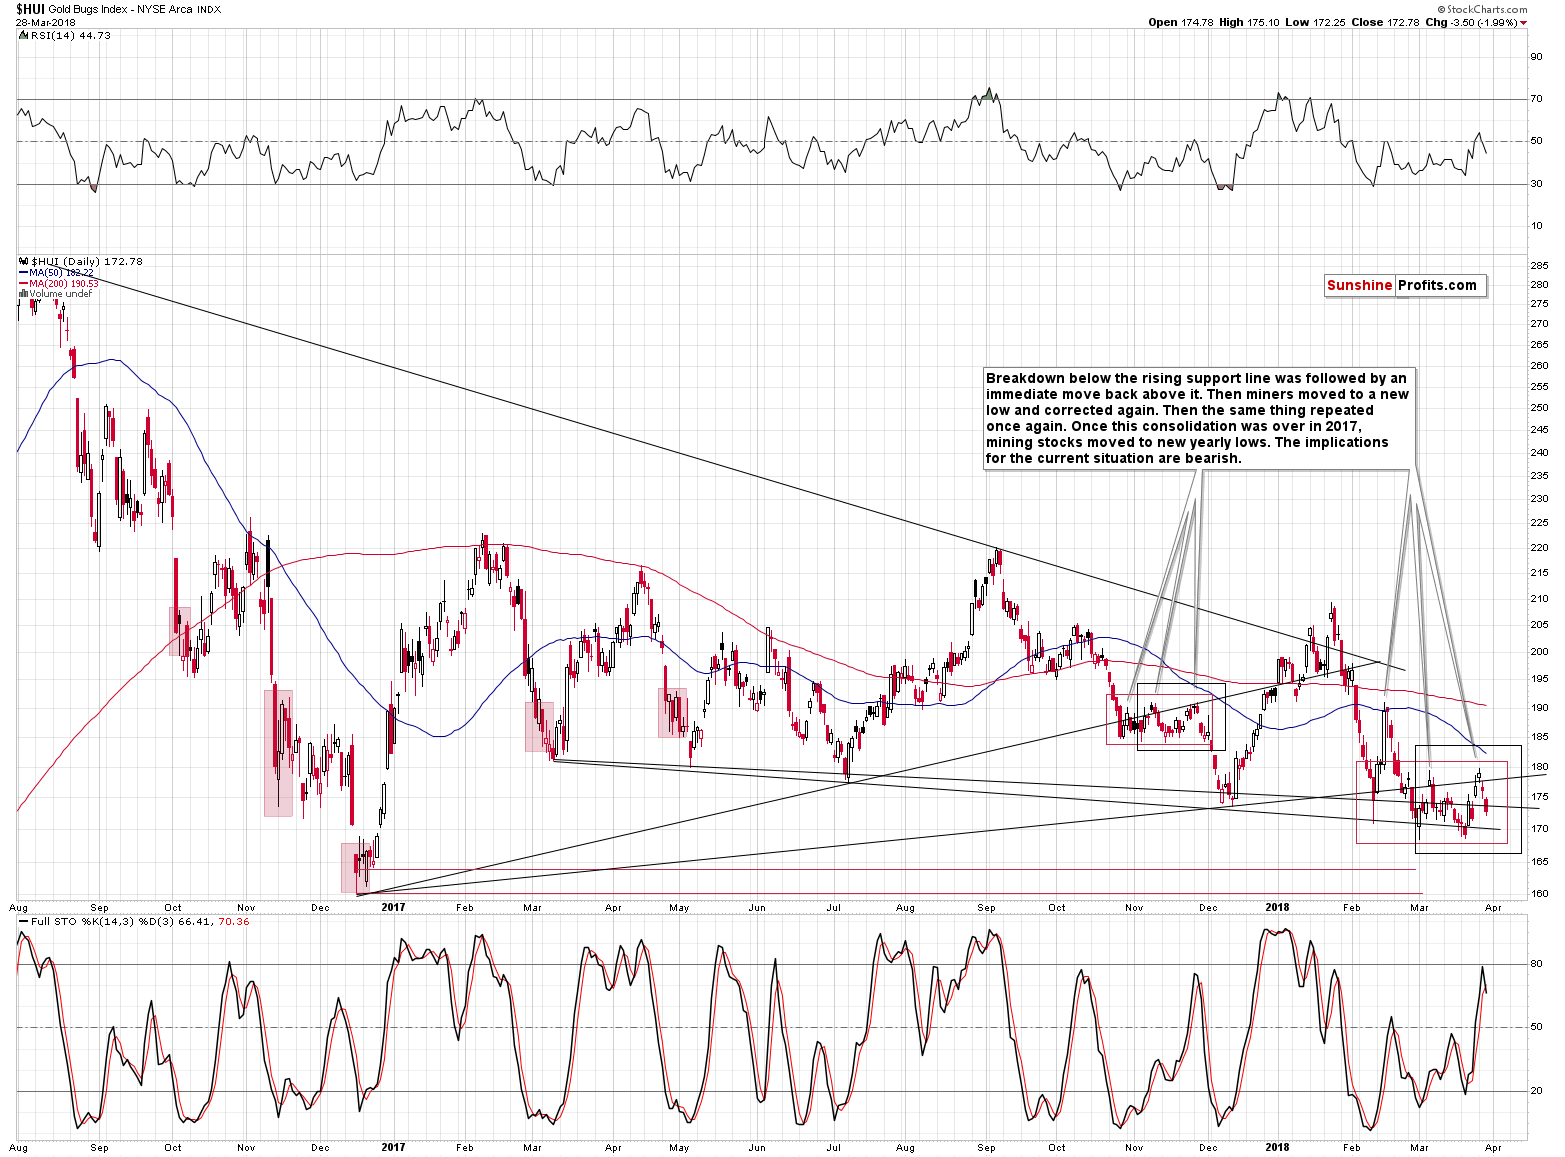
In the case of the HUI Index, the thing that we see is a similarity between the current consolidation and the consolidation that we saw in November 2017, which confirms the analogy in the silver market.
Back in late October 2017, gold miners broke below the rising support line that’s based on the late 2016 bottom and one of the 2017 bottoms. In February 2018, gold miners broke below the rising support line that’s based on the late 2016 bottom and another 2017 bottom.
(…) in both cases after the initial rally and move back above the rising support line, the HUI declined once again and formed a new short-term low. Then we saw another rally, more or less to the previous high, and a subsequent decline. That’s the action that we saw most recently and that’s exactly what preceded the bigger decline in early December 2017. Naturally, the implications of this self-similar pattern are bearish.
Gold miners moved visibly lower yesterday and it seems that this fact confirms that the pattern remains intact. The implications continue to be bearish.
Please note that the moves that follow a consolidation tend to be similar to the ones that preceded it. In the case of the HUI Index, it’s not clear which decline should be taken into account for this technique. One decline that we can see is from the January top to the late-February bottom and the other one is from the mid-February high to the late-February bottom. Assuming that the current decline is going to be similar to the smaller of the above two price moves, we can still expect the HUI to move below 160. The similarity to the bigger decline would imply a move to 150 or even below it.
At this moment both scenarios seem probable. It seems that we’ll have to wait and see what kind of signals and confirmations become available when we get closer to the April 9th reversal date. If, for instance, gold and silver move to important support levels and the HUI is still above 160, then it might be this level that stops the decline. If, however, gold and silver are still somewhat above the key support levels and the HUI is already below 160, then 150 will become a more likely target for the final short-term bottom.
Depending on what kind of confirmations we get, we might limit, close or even reverse the current short position – it’s too early to say which will be the case based on the data that we have right now.
Also, since we’re discussing the short-term bottom, we would like to reply to a question that we received about it from one of our subscribers. The question is if we expect gold to bottom at our initial target price of $1,218 close to April 9th, or do we think that there will be only a temporary bottom close to this date. The latter seems more likely at this time. The target at about $1,200 is the price level that is likely to trigger a more visible corrective upswing, but given the shapes of the previous declines in the price of gold, it doesn’t seem likely that gold would decline that far in less than two weeks.
No price level above levels close to $1,200 seems strong enough to trigger a reversal on its own and thus that’s what we feature as our initial target price. It doesn’t, however, mean that we won’t adjust (limit, close or even reverse) the position before this price level is reached. If we get enough confirmations other than gold’s price level itself (for instance, mining stocks show strength and silver reaches a very important support level, while the USD reaches a key resistance), then we might do it, just like we’ve done previously (which ultimately caused the short position to be more profitable).
Summary
Summing up, based on the trade conflict between the U.S. and China, gold, silver and mining stocks moved higher recently, but it didn’t change the implications of the key short- and medium-term analogies. The long-term signals were not invalidated either and thus the overall outlook for the following weeks remains bearish.
On an administrative note, there will be no regular Gold & Silver Trading Alert tomorrow and on Monday due to your Editor’s holiday travel schedule. Consequently, the next regular alert is scheduled for Tuesday, April 3rd. However, if anything major happens, we’ll keep you updated through short intraday alerts anyway.
As always, we will keep you – our subscribers – informed.
To summarize:
Trading capital (supplementary part of the portfolio; our opinion): Full short positions (200% of the full position) in gold, silver and mining stocks are justified from the risk/reward perspective with the following stop-loss orders and initial target price levels:
- Gold: initial target price: $1,218; stop-loss: $1,382; initial target price for the DGLD ETN: $53.98; stop-loss for the DGLD ETN $37.68
- Silver: initial target price: $14.63; stop-loss: $17.33; initial target price for the DSLV ETN: $33.88; stop-loss for the DSLV ETN $21.48
- Mining stocks (price levels for the GDX ETF): initial target price: $19.22; stop-loss: $23.54; initial target price for the DUST ETF: $39.88; stop-loss for the DUST ETF $21.46
In case one wants to bet on junior mining stocks' prices (we do not suggest doing so – we think senior mining stocks are more predictable in the case of short-term trades – if one wants to do it anyway, we provide the details), here are the stop-loss details and initial target prices:
- GDXJ ETF: initial target price: $27.82; stop-loss: $36.14
- JDST ETF: initial target price: $94.88 stop-loss: $41.86
Long-term capital (core part of the portfolio; our opinion): No positions (in other words: cash)
Insurance capital (core part of the portfolio; our opinion): Full position
Important Details for New Subscribers
Whether you already subscribed or not, we encourage you to find out how to make the most of our alerts and read our replies to the most common alert-and-gold-trading-related-questions.
Please note that the in the trading section we describe the situation for the day that the alert is posted. In other words, it we are writing about a speculative position, it means that it is up-to-date on the day it was posted. We are also featuring the initial target prices, so that you can decide whether keeping a position on a given day is something that is in tune with your approach (some moves are too small for medium-term traders and some might appear too big for day-traders).
Plus, you might want to read why our stop-loss orders are usually relatively far from the current price.
Please note that a full position doesn’t mean using all of the capital for a given trade. You will find details on our thoughts on gold portfolio structuring in the Key Insights section on our website.
As a reminder – “initial target price” means exactly that – an “initial” one, it’s not a price level at which we suggest closing positions. If this becomes the case (like it did in the previous trade) we will refer to these levels as levels of exit orders (exactly as we’ve done previously). Stop-loss levels, however, are naturally not “initial”, but something that, in our opinion, might be entered as an order.
Since it is impossible to synchronize target prices and stop-loss levels for all the ETFs and ETNs with the main markets that we provide these levels for (gold, silver and mining stocks – the GDX ETF), the stop-loss levels and target prices for other ETNs and ETF (among other: UGLD, DGLD, USLV, DSLV, NUGT, DUST, JNUG, JDST) are provided as supplementary, and not as “final”. This means that if a stop-loss or a target level is reached for any of the “additional instruments” (DGLD for instance), but not for the “main instrument” (gold in this case), we will view positions in both gold and DGLD as still open and the stop-loss for DGLD would have to be moved lower. On the other hand, if gold moves to a stop-loss level but DGLD doesn’t, then we will view both positions (in gold and DGLD) as closed. In other words, since it’s not possible to be 100% certain that each related instrument moves to a given level when the underlying instrument does, we can’t provide levels that would be binding. The levels that we do provide are our best estimate of the levels that will correspond to the levels in the underlying assets, but it will be the underlying assets that one will need to focus on regarding the signs pointing to closing a given position or keeping it open. We might adjust the levels in the “additional instruments” without adjusting the levels in the “main instruments”, which will simply mean that we have improved our estimation of these levels, not that we changed our outlook on the markets. We are already working on a tool that would update these levels on a daily basis for the most popular ETFs, ETNs and individual mining stocks.
Our preferred ways to invest in and to trade gold along with the reasoning can be found in the how to buy gold section. Additionally, our preferred ETFs and ETNs can be found in our Gold & Silver ETF Ranking.
As a reminder, Gold & Silver Trading Alerts are posted before or on each trading day (we usually post them before the opening bell, but we don't promise doing that each day). If there's anything urgent, we will send you an additional small alert before posting the main one.
=====
Latest Free Trading Alerts:
Remember LIBOR? The interest rate which soared during the global financial crisis? It’s on the rise again, but almost no one is paying adequate attention to it. We are – and we will analyze for you what this means for the gold market.
Wednesday's trading session was pretty uneventful compared to Friday's, Monday's and Tuesday's volatility. Stocks fluctuated along their Tuesday's closing prices, as investors hesitated after slightly better-than-expected Final GDP number release. Will stocks rebound today? Or is this just a consolidation before another leg lower? It seems that there are still two possible future scenarios.
Stocks End a Wild Quarter, as Bulls Scratch Their Heads
=====
Hand-picked precious-metals-related links:
PRECIOUS-Gold steadies as N. Korea, global trade concerns ease
=====
In other news:
Stocks reboot after tech problems, first quarter losses loom
North, South Korea fix April date for first summit in years
Global credit markets showing signs of danger
Tesla 'On The Verge' of Bankruptcy: Vilas Capital
OPEC could accidentally sink oil prices
US shale pumping will see oil prices slide back to $50, JP Morgan analyst predicts
China central bank will launch crackdown on virtual currencies
=====
Thank you.
Sincerely,
Przemyslaw Radomski, CFA
Founder, Editor-in-chief, Gold & Silver Fund Manager
Gold & Silver Trading Alerts
Forex Trading Alerts
Oil Investment Updates
Oil Trading Alerts

