

Briefly: In our opinion, full (150% of the regular size of the position) speculative short positions in gold, silver and mining stocks are justified from the risk/reward perspective at the moment of publishing this alert.
During yesterday’s session silver moved back and forth in a volatile manner on volume that was the highest since April 2013. There were a few volume spikes in the meantime, but none as big as what we saw yesterday. The silver market is being very loud. But are you listening?
It may be hard to notice silver’s signs with all that’s happening in the USD Index and given the rally in gold stocks, but it’s definitely worth it.
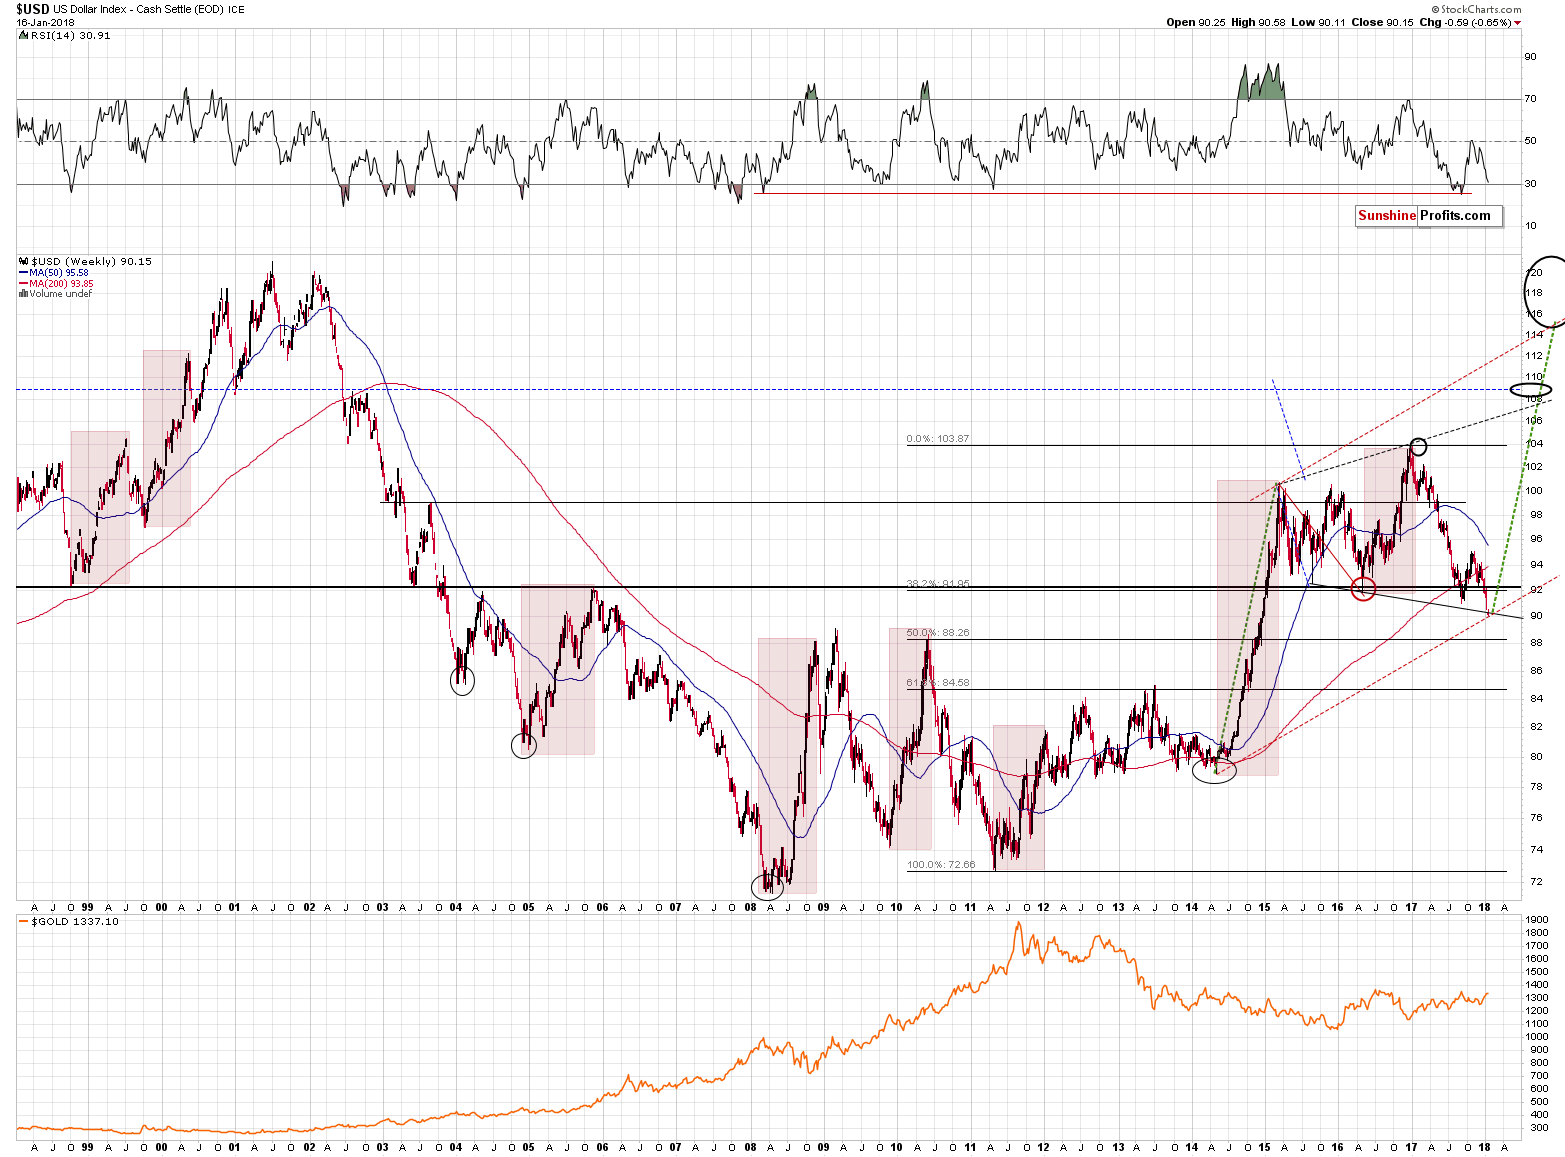
Still, before we move to silver’s extreme volume, let’s discuss the context. The chart below provides it by showing the USD’s decline (chart courtesy of http://stockcharts.com).
In our previous alert, we wrote the following:
The context is that the two of the sharpest rallies of the past 20 years and two other major upswings started with a small breakdown. This includes the 2014 bottom and the subsequent rally.
Besides, please note that the rally that we saw in the second half of 2015 started after the USD moved a bit below the previous low in mid-2015. The 2016 rally started after the USD moved a bit below the mid-2015 low. The late 2017 rally started after the USD moved a bit below the 2016 low. Now the USD moved a bit below the 2017 low.
If something analogous to what we just saw happened in few of the most bullish situations in the recent and not-so-recent history, then how can we view it as something bearish?
We shouldn’t. At least not yet. If the USD Index continues to slide, then at some point the situation will indeed become bearish, but a single session is definitely not enough to make the picture bearish.
There is a declining support line that could stop the current decline – the one based on the 2015 and 2016 lows. It’s currently at about 90.2.
Since we wrote the above, the USD Index moved to the mentioned declining resistance line and moved back up. At the moment of writing these words, it’s trading at about 90.6 – not very high, but well above the 90.2. In other words, we saw a reversal, which is a bullish piece of information.
In the previous alert, we also wrote the following:
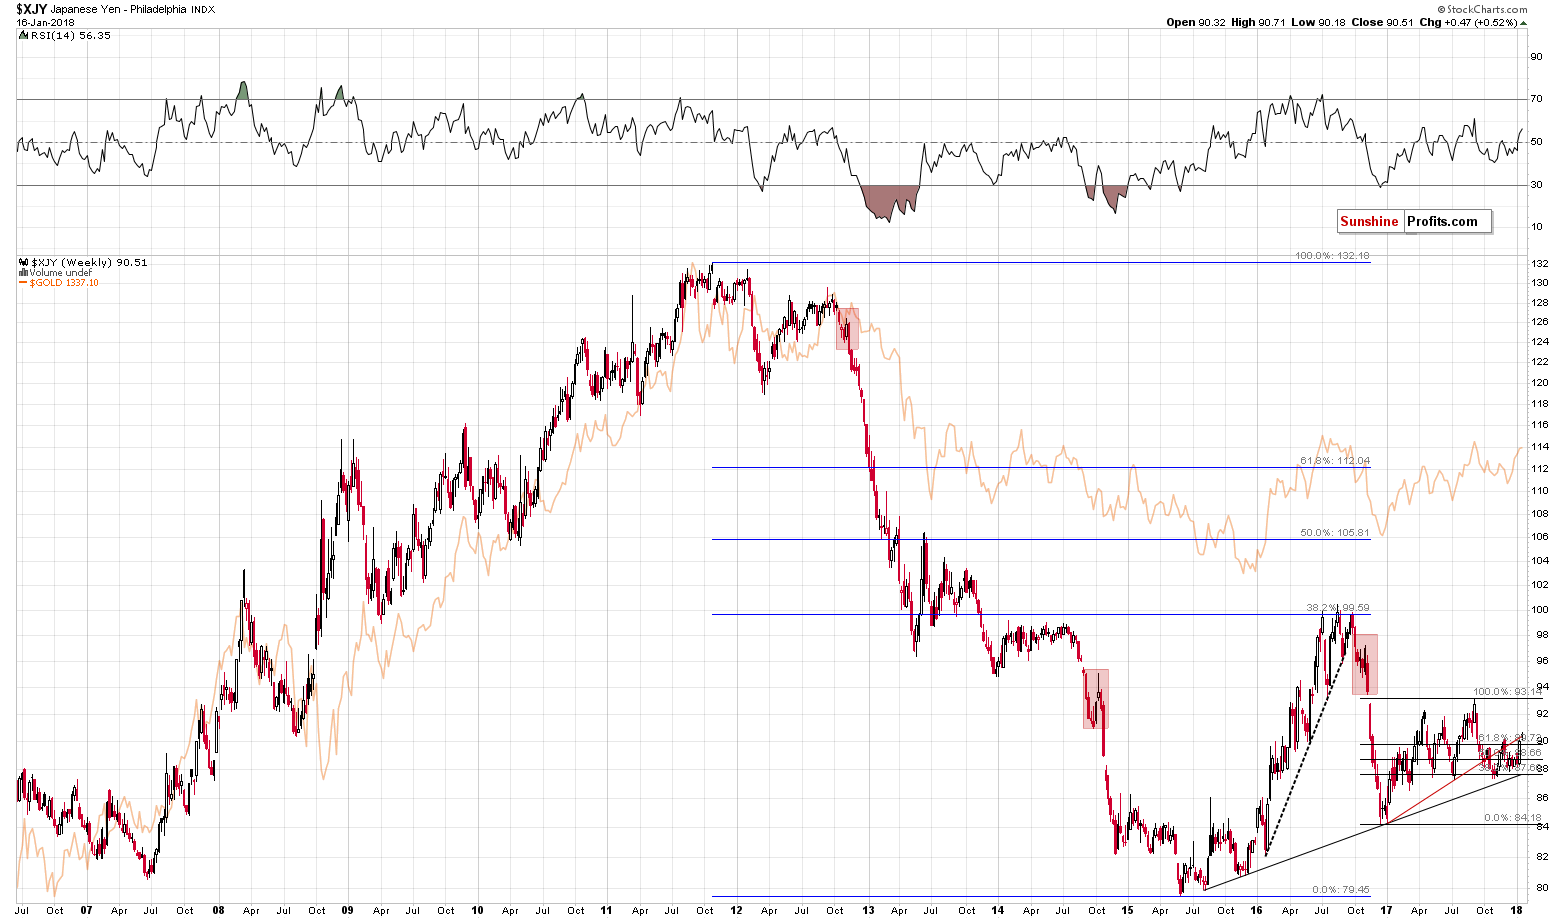
One of the reasons behind the USD’s decline and gold’s upswing was the rally in the Japanese yen. Please note that the value of the Japanese currency moved higher, but it stopped at the rising red resistance line. The same line stopped the late-2017 rally, so we could see a repeat of the above also this time. Still, back then the yen moved temporarily above the line before reversing, so Friday’s action might have not been the final top. Today’s intra-day top, however, might already be the final reversal.
The mentioned line was temporarily broken yesterday, but the yen closed the session back below it. The top might already be in or it could be at hand.
What happened in gold in the meantime?
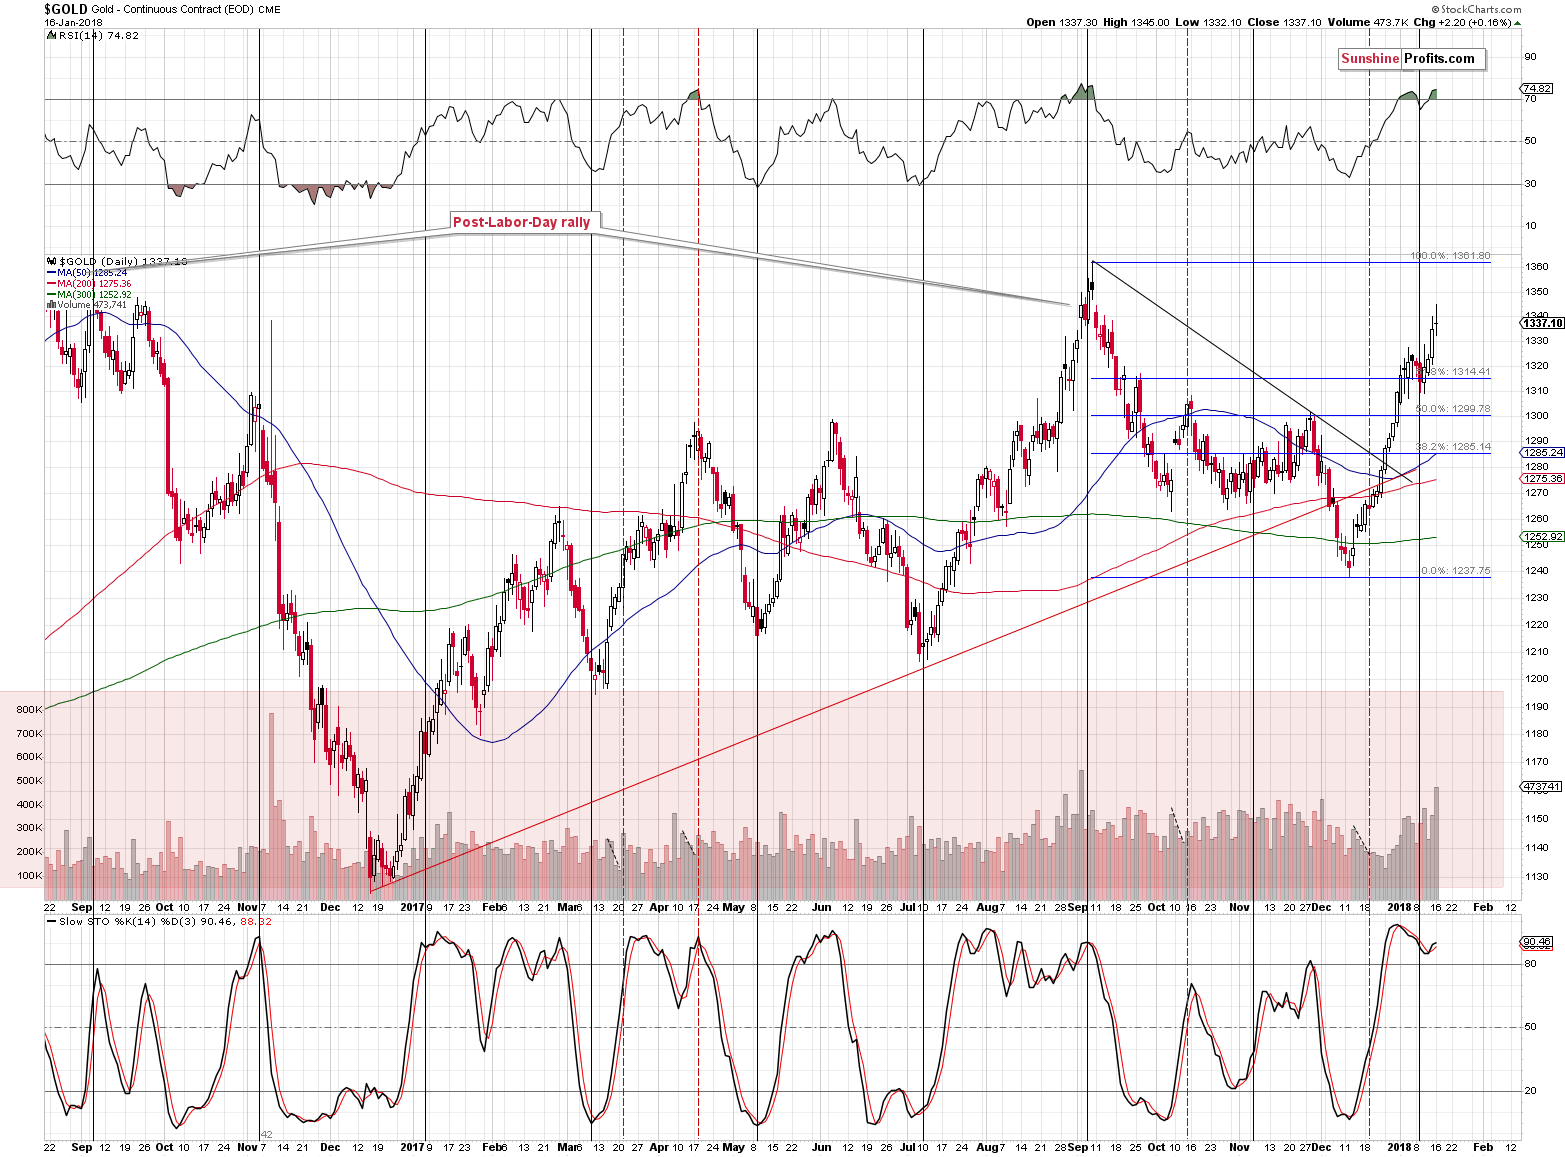
Gold seems to have reversed as well. The reversal took place on sizable volume (highest since early September 2017), which suggests that the session is meaningful. Back in September, the analogous session was seen right before the top, but it was not the top, so the implications are bearish, but not necessarily for today.
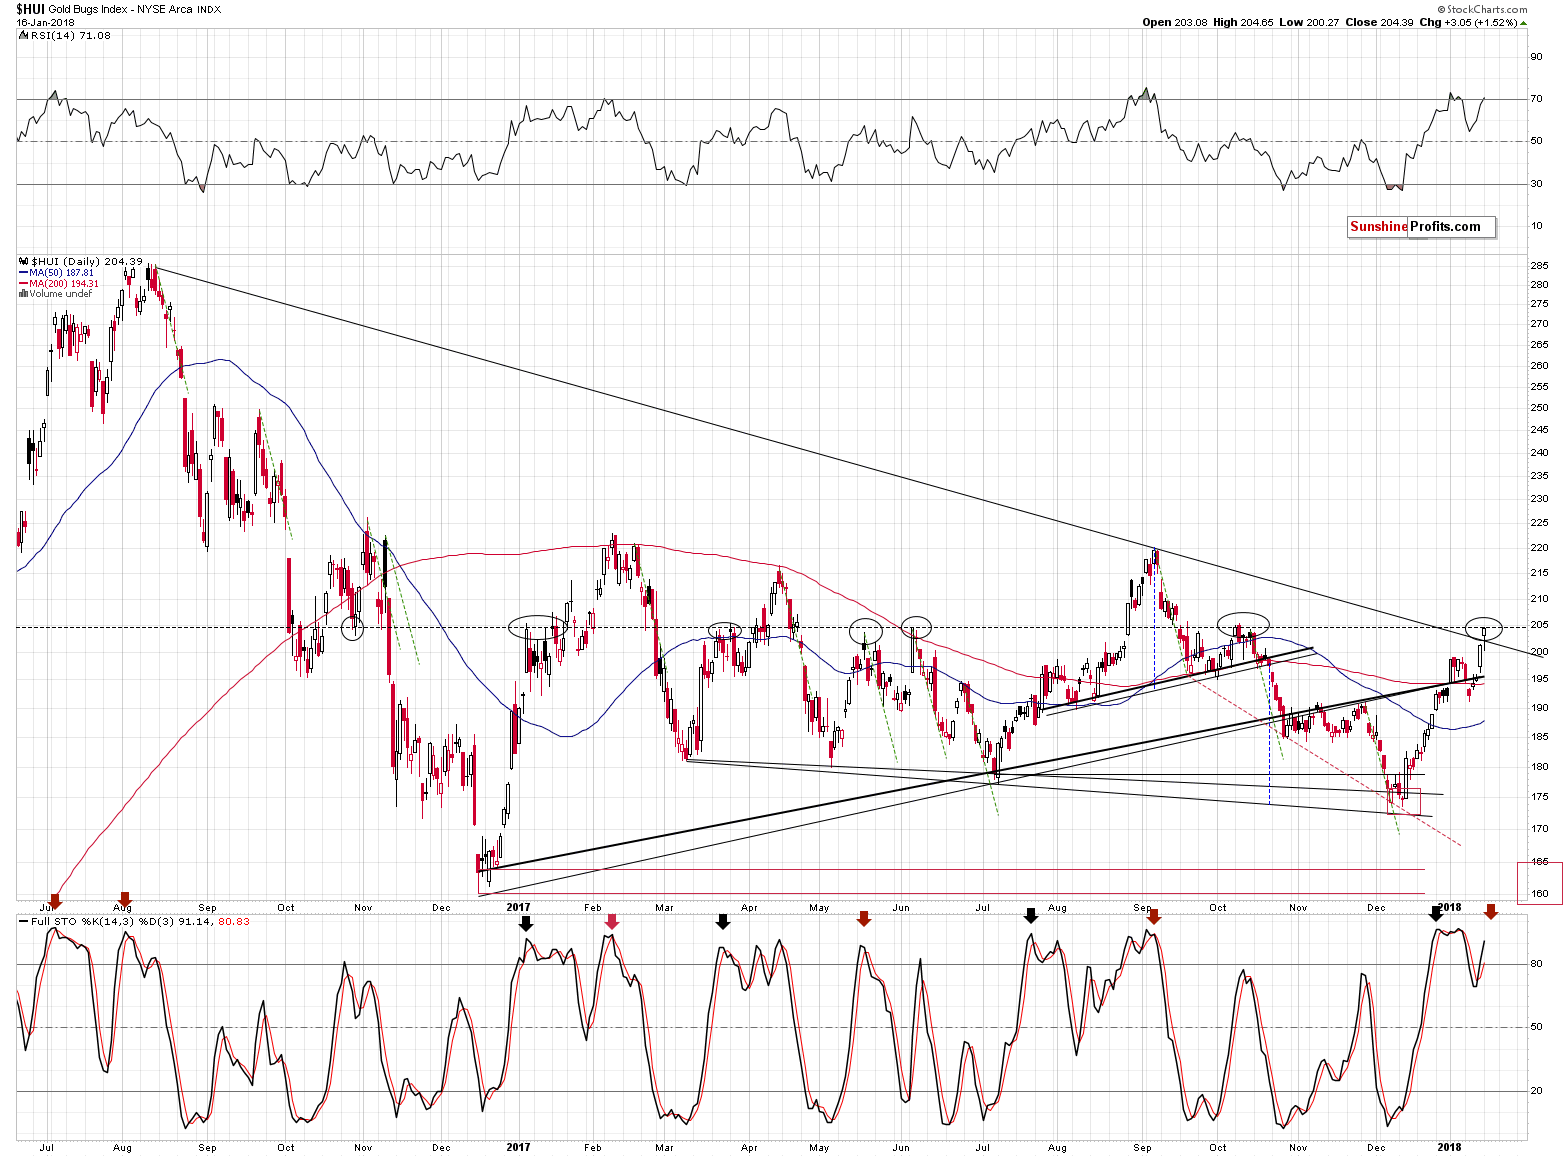
Gold stocks are after a move above the declining resistance line and at a level that stopped rallies several times in the past (marked with ellipses on the above chart). This, along with the RSI above 70, makes us doubt the bullish nature of the recent rally and strength relative to gold.
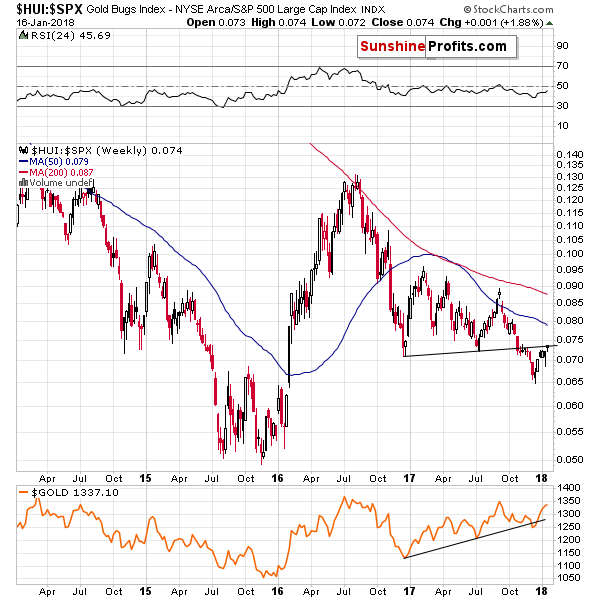
This is especially the case given that there was no invalidation of the breakdown in the case of the gold stocks to the general stock market ratio. Yes, miners moved higher yesterday, while the main stock indices didn’t, but that’s just one session. One swallow doesn’t make a summer.
There is also an interesting rule in the case of the sell signals from the Stochastic indicator – it turned out that every other sell signal was followed by a bigger decline and the remaining ones were just initial tops during rallies. This has been the case for over a year now. If this rule is to continue, then the upcoming sell signal will be the real one. All mining stocks have to do for the signal to materialize is to decline a bit. In other words, once miners decline, they are likely to decline significantly.
Having said all the above, let’s move to the most significant daily development that we saw yesterday.
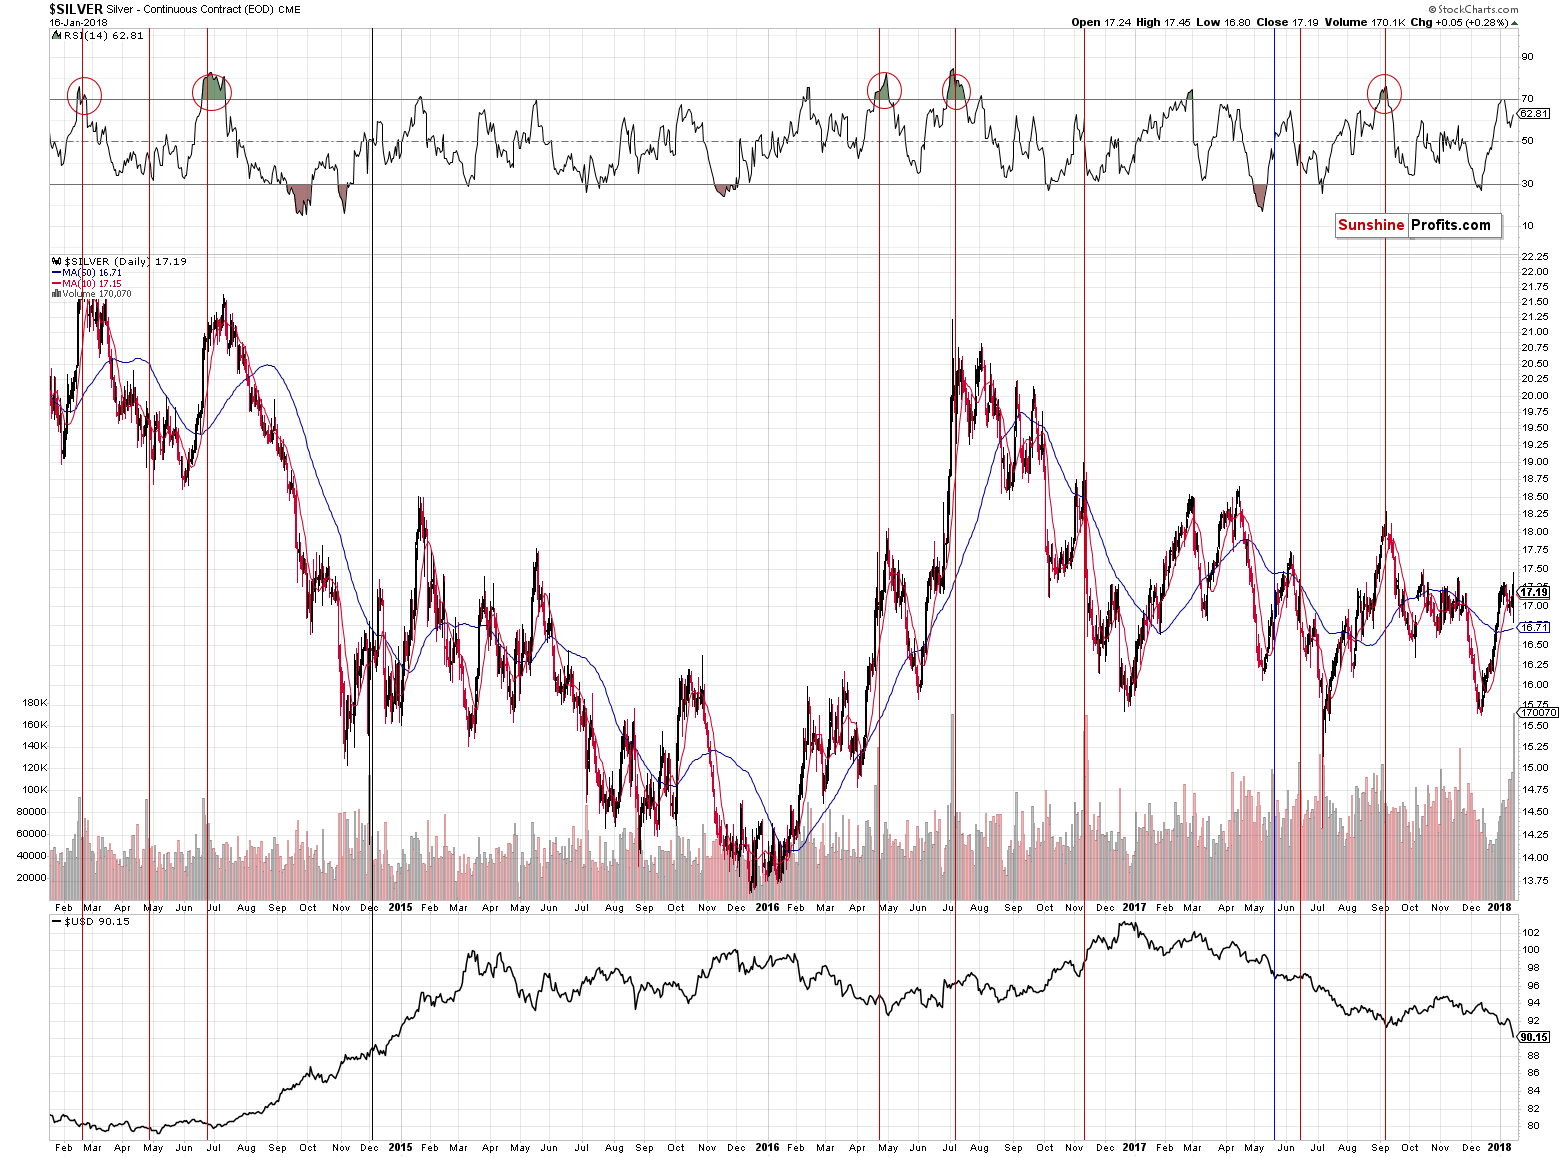
The volume in silver was epic. One could say that it’s because there was no regular session on Monday, but during the previous years there were also other cases when there were market holidays and in no other case was the volume this big. In other words, the volume is extreme even if we take the above effect into account.
However, it is most important that the volume was extremely big – not that it broke a few records. History tends to repeat itself, so the key question is what silver did after previous sessions when it traded on huge volume.
It usually declined. We marked the similar sessions with vertical lines and we used the red color for the cases when a bigger decline followed either immediately or shortly. The black line represents the session that was not followed by anything specific and the blue session was followed by higher silver prices in the short term.
The red sessions dominate, which makes the current session bearish. However, what makes it very bearish is considering the above together with the RSI indicator. The latter shows the status of the market when the huge-volume upswing was seen.
Whenever silver moved higher on huge volume when the RSI was above 60, it meant that a top was in or at hand. We marked those situations with red ellipses. The RSI closed at 62 yesterday, which makes the current combination of signals very bearish.
Has silver topped based the extreme volume reading? It could be the case, but this is not what the above chart is saying. It’s saying that a big decline is just around the corner and paying a lot of attention to bullish signs might be misleading.
Summing up, similar performance in the USD Index had very bullish implications too many times in the past for us to view the current breakdown as something profoundly bearish. The recent weakness in the way gold reacted to the USD’s movement continues to point to lower gold prices. The same goes for the extremely high volume reading in silver that we saw after a sizable upswing and with the RSI above 60. The next big downswing seems to be just around the corner.
As always, we will keep you – our subscribers – informed.
To summarize:
Trading capital (supplementary part of the portfolio; our opinion): Full short positions (150% of the full position) in gold, silver and mining stocks are justified from the risk/reward perspective with the following stop-loss orders and initial target price levels:
- Gold: initial target price: $1,218; stop-loss: $1,364; initial target price for the DGLD ETN: $53.98; stop-loss for the DGLD ETN $38.28
- Silver: initial target price: $14.63; stop-loss: $17.72; initial target price for the DSLV ETN: $33.88; stop-loss for the DSLV ETN $21.28
- Mining stocks (price levels for the GDX ETF): initial target price: $19.22; stop-loss: $26.14; initial target price for the DUST ETF: $39.88; stop-loss for the DUST ETF $19.78
In case one wants to bet on junior mining stocks' prices (we do not suggest doing so – we think senior mining stocks are more predictable in the case of short-term trades – if one wants to do it anyway, we provide the details), here are the stop-loss details and initial target prices:
- GDXJ ETF: initial target price: $27.82; stop-loss: $38.22
- JDST ETF: initial target price: $94.88 stop-loss: $37.78
Long-term capital (core part of the portfolio; our opinion): No positions (in other words: cash)
Insurance capital (core part of the portfolio; our opinion): Full position
Important Details for New Subscribers
Whether you already subscribed or not, we encourage you to find out how to make the most of our alerts and read our replies to the most common alert-and-gold-trading-related-questions.
Please note that the in the trading section we describe the situation for the day that the alert is posted. In other words, it we are writing about a speculative position, it means that it is up-to-date on the day it was posted. We are also featuring the initial target prices, so that you can decide whether keeping a position on a given day is something that is in tune with your approach (some moves are too small for medium-term traders and some might appear too big for day-traders).
Plus, you might want to read why our stop-loss orders are usually relatively far from the current price.
Please note that a full position doesn’t mean using all of the capital for a given trade. You will find details on our thoughts on gold portfolio structuring in the Key Insights section on our website.
As a reminder – “initial target price” means exactly that – an “initial” one, it’s not a price level at which we suggest closing positions. If this becomes the case (like it did in the previous trade) we will refer to these levels as levels of exit orders (exactly as we’ve done previously). Stop-loss levels, however, are naturally not “initial”, but something that, in our opinion, might be entered as an order.
Since it is impossible to synchronize target prices and stop-loss levels for all the ETFs and ETNs with the main markets that we provide these levels for (gold, silver and mining stocks – the GDX ETF), the stop-loss levels and target prices for other ETNs and ETF (among other: UGLD, DGLD, USLV, DSLV, NUGT, DUST, JNUG, JDST) are provided as supplementary, and not as “final”. This means that if a stop-loss or a target level is reached for any of the “additional instruments” (DGLD for instance), but not for the “main instrument” (gold in this case), we will view positions in both gold and DGLD as still open and the stop-loss for DGLD would have to be moved lower. On the other hand, if gold moves to a stop-loss level but DGLD doesn’t, then we will view both positions (in gold and DGLD) as closed. In other words, since it’s not possible to be 100% certain that each related instrument moves to a given level when the underlying instrument does, we can’t provide levels that would be binding. The levels that we do provide are our best estimate of the levels that will correspond to the levels in the underlying assets, but it will be the underlying assets that one will need to focus on regarding the signs pointing to closing a given position or keeping it open. We might adjust the levels in the “additional instruments” without adjusting the levels in the “main instruments”, which will simply mean that we have improved our estimation of these levels, not that we changed our outlook on the markets. We are already working on a tool that would update these levels on a daily basis for the most popular ETFs, ETNs and individual mining stocks.
Our preferred ways to invest in and to trade gold along with the reasoning can be found in the how to buy gold section. Additionally, our preferred ETFs and ETNs can be found in our Gold & Silver ETF Ranking.
As a reminder, Gold & Silver Trading Alerts are posted before or on each trading day (we usually post them before the opening bell, but we don't promise doing that each day). If there's anything urgent, we will send you an additional small alert before posting the main one.
=====
Latest Free Trading Alerts:
The Commodity Futures Trading Commission has released the latest CoT report. What can we learn from it about the gold market?
Does CoT Show Battle over Gold?
=====
Hand-picked precious-metals-related links:
PRECIOUS-Gold prices slip as dollar recovers from 3-yr low
Gold Losses in Years Past Keep Producers From Buying More Mines
Eldorado Gold reports in-line 2017 gold production
Barrick just makes 2017 production guidance
=====
In other news:
As Trump heads to Davos, survey points to rising risk of war
Did Bitcoin Just Burst? How It Compares to History's Big Bubbles
Which Central Bank Is the Most Accurate Forecaster?
Juncker says would like Britain to rejoin EU after Brexit
France would 'look with kindess' on UK Brexit change of mind: Macron adviser
Nearly half a million UK firms facing 'significant' financial distress
NYSE to launch new national exchange in second quarter
=====
Thank you.
Sincerely,
Przemyslaw Radomski, CFA
Founder, Editor-in-chief, Gold & Silver Fund Manager
Gold & Silver Trading Alerts
Forex Trading Alerts
Oil Investment Updates
Oil Trading Alerts

