

Briefly: In our opinion, full (100% of the regular size of the position) speculative short positions in gold, silver and mining stocks is justified from the risk/reward perspective at the moment of publishing this alert.
In yesterday’s analysis entitled “Silver Soared, So It’s Bullish, Right? Wrong.”, we emphasized that silver’s strong daily upswing was not something bullish, but bearish and we didn’t have to wait for long to see the results. Almost the entire Tuesday’s rally was erased yesterday. Moreover, we discussed the analogy to the post-September decline. Silver’s yesterday performance fits this analogy like a hand fits a glove. Consequently, the follow-up is very likely to be alike as well. In today’s alert, we discuss the details for the silver roadmap.
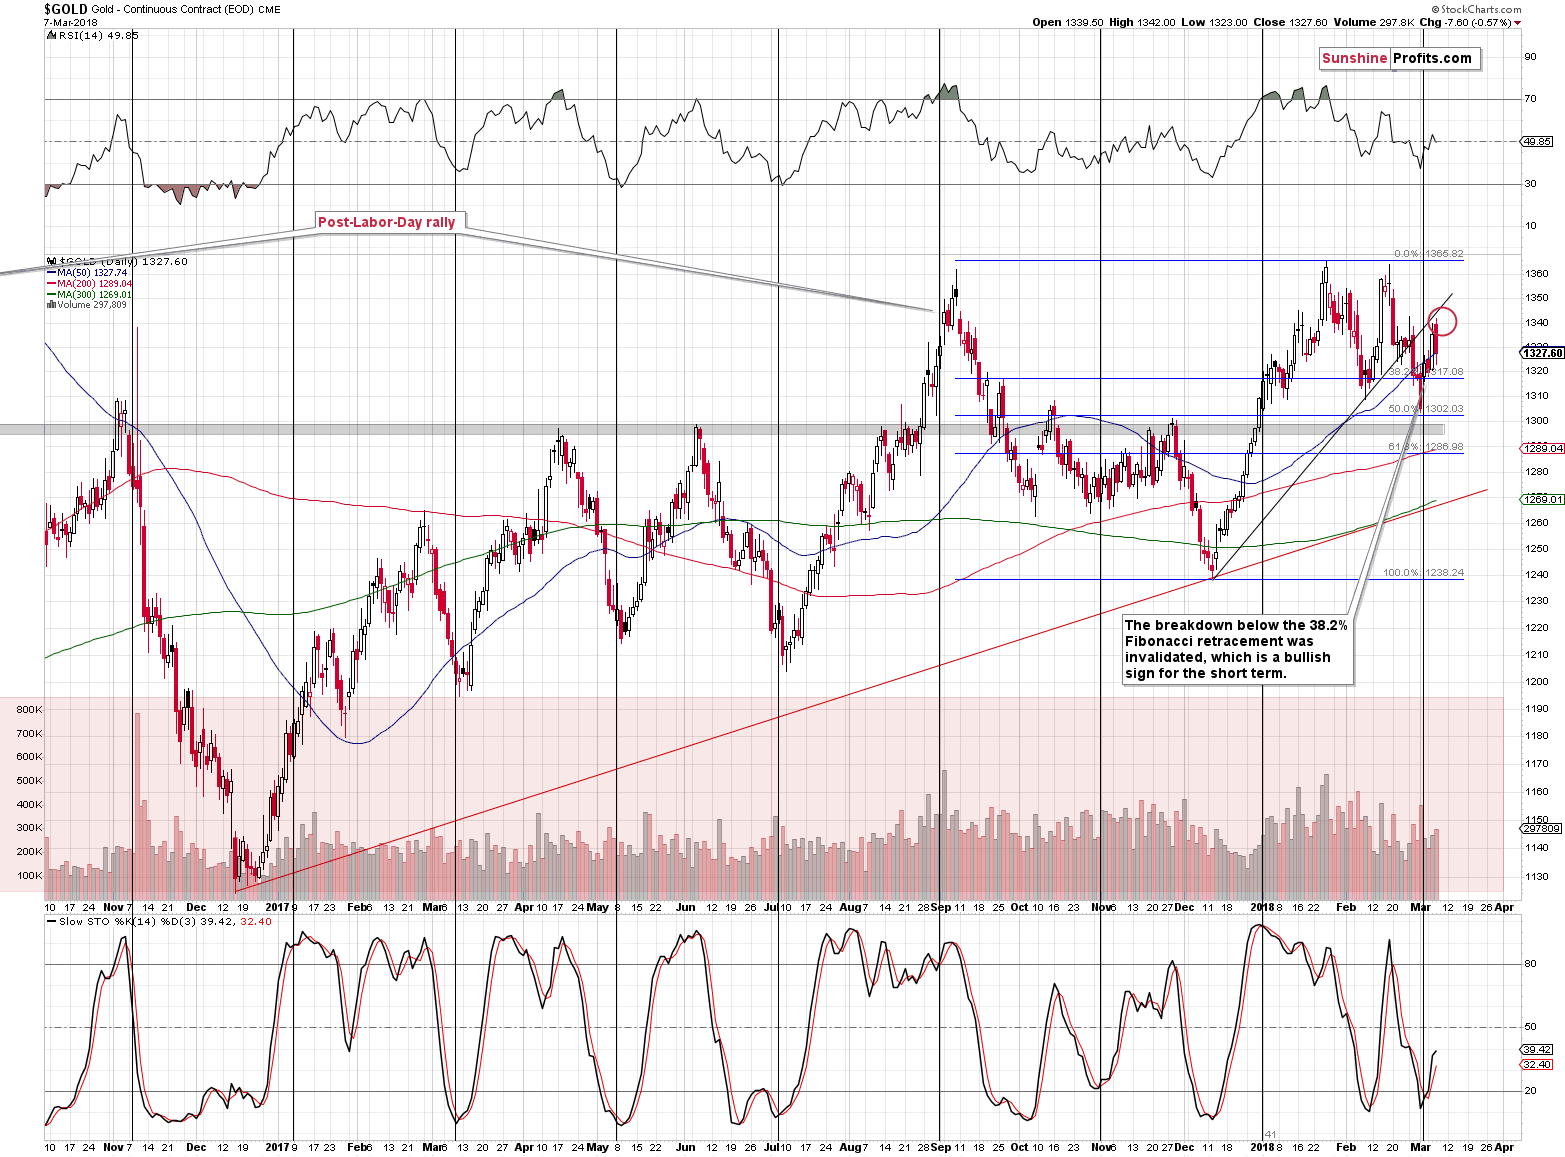
But first, let’s take a look at silver’s bigger brother – gold (chart courtesy of http://stockcharts.com).
Gold’s Target Reached
Let’s start with quoting our yesterday’s comments:
On Monday we argued that gold could move to the $1,340s before the rally is over and we marked this level with the red ellipse. Why there? That’s where we have the previous intraday high and the rising resistance line. The combination of these short-term resistance levels and the pace at which gold usually rallied both fit a scenario in which gold forms the next local top about $20 higher at the end of the week or very close to it.
But, gold has already moved to the middle of the target area, so is there any point in waiting an additional few days before viewing the outlook as bearish? After all, gold shouldn’t rally much higher from here if the rising resistance line is to hold.
In short, the above is mostly true – yesterday’s rally made the situation already somewhat bearish, but at the same time it’s not certain if the final short-term top for this week is already in. We could have a daily pause or so and another upswing before the final top is in. Still, it seems that we are already close to the top.
The most important bearish signs, however, don’t come from the gold market, but from the confirmations that we saw in other parts of the precious metals sector.
In short, the above remains up-to-date. Gold has already declined after we wrote the above and our short positions became profitable practically immediately, but it could still be the case that the yellow metals moves higher today, tomorrow or on Monday. Our guesstimate (it’s impossible to know for sure) is that the big decline will start on Friday, close to the release of the jobs report. In particular, let’s keep in mind that there were many cases when the tensions preceding the report pushed the precious metals sector higher and once they subsided, the price fell. This could be the way in which the next big decline starts.
But, will it start from the levels higher than yesterday’s intraday high? It’s rather unclear. Both options: the one in which gold moves higher just a bit, and the one in which gold moves above the previous March high (to $1,345 or so) seem probable. It’s also possible that the decline resumes right away, as we saw important bearish signs already on Tuesday (the way gold, silver, and mining stocks rallied).
Overall, in our opinion keeping the short position in its current form (100% of the regular position) and adding to it once the risk to reward ratio becomes more favorable is a good way to go. Naturally, we’ll keep you informed.
Silver’s Crystal-clear Sign
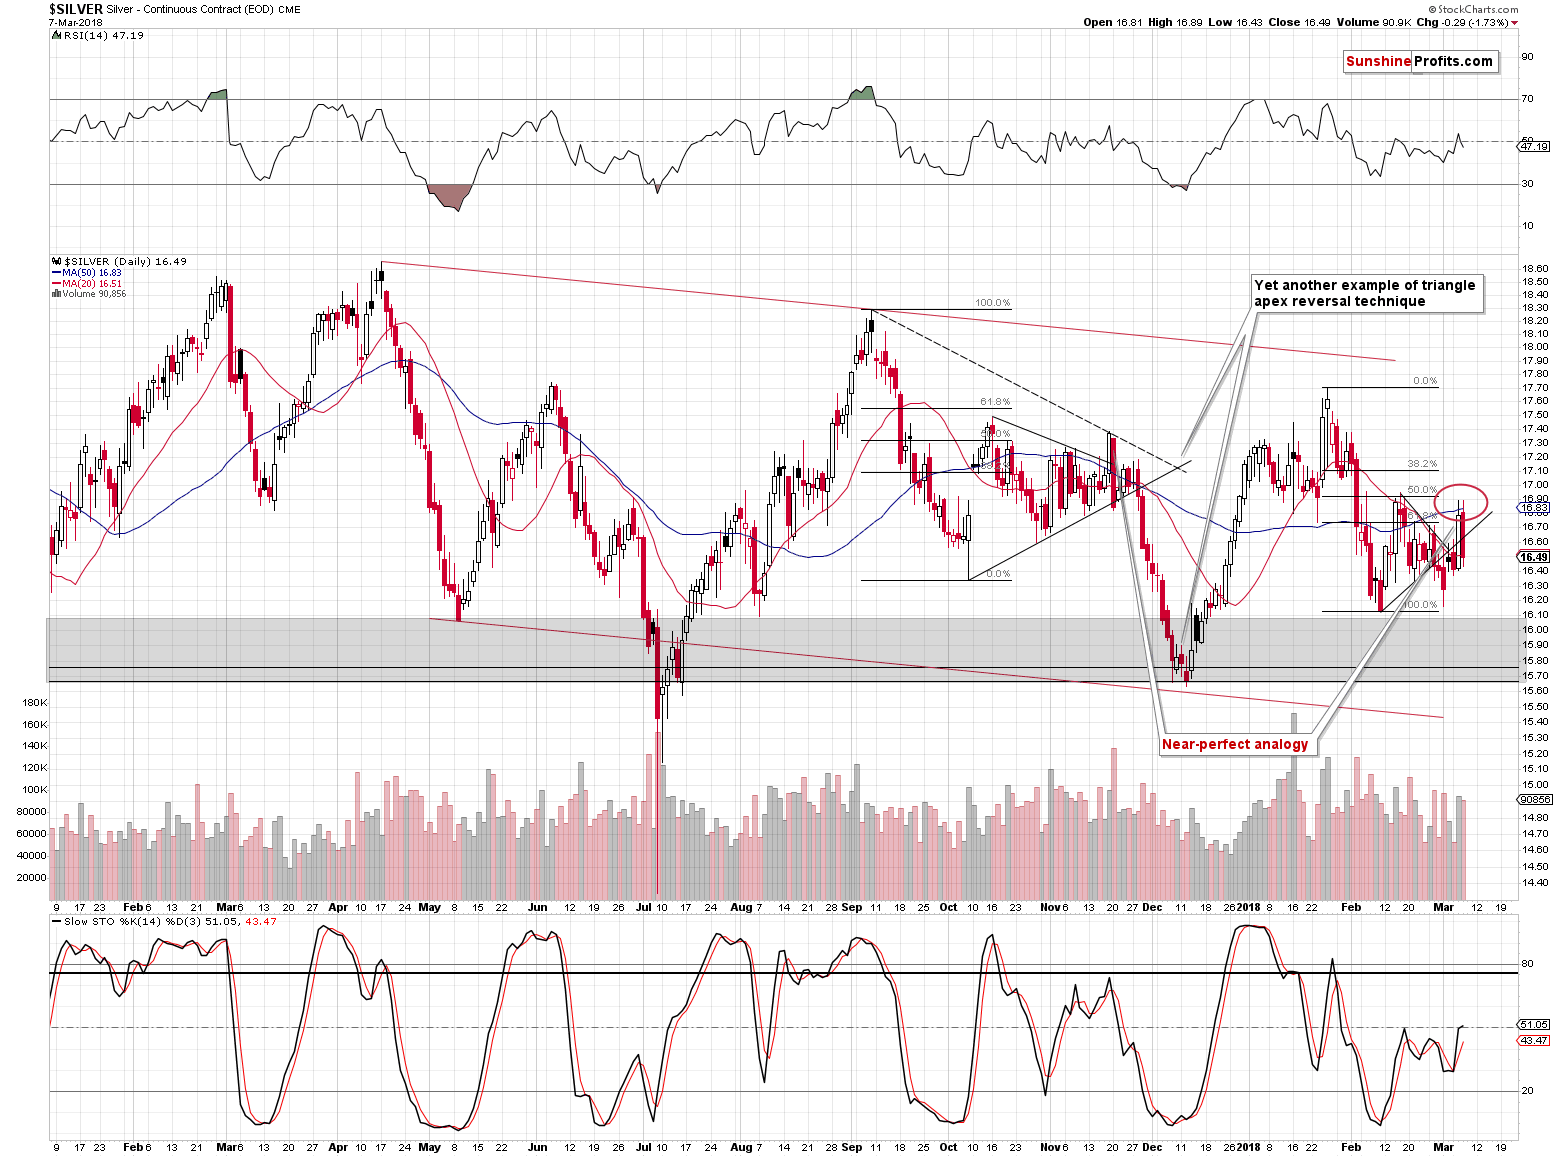
On Monday, we described silver’s similarity to the post-September 2017 decline, so we won’t get into the details again here, but quoting yesterday’s analysis seems particularly useful:
(…) we want to emphasize that that the pattern continues with remarkable accuracy.
The sudden jump in the price of silver that we saw yesterday is most likely the analogy to the November 17, 2017 daily rally. The rally that preceded the big daily downswing and that was shortly followed by a decline of over $1.50. The implications here are bearish, not only in light of this specific analogy, but because silver outperformed gold on a very short-term basis right before declining multiple times in the past.
We wrote that silver was likely to rally above its short-term declining resistance line and the 50-day moving average and to top close to its mid-February high, likely outperforming gold. This is exactly what we saw yesterday when silver moved to our target area and thus it seems that a bearish outlook is once again justified.
The action that followed the mentioned November 17, 2017 session is almost the same action that we saw yesterday. Silver erased almost the entire daily upswing yesterday. The analogy is indeed remarkably accurate.
This gives us a good chance that the analogy will continue further. So, let’s look at what happened in late November 2017. Silver moved higher once again, but there was no new spectacular daily upswing. After a few days, silver started to decline without looking back.
How does this fit the current situation? It fits it very well. If gold is to reverse on Friday or so, then that’s when silver can reverse and start its huge decline as well. In the meantime (today and to some extent tomorrow), it could move slowly higher. At the moment of writing these words, silver is about 6 cents higher, which seems to confirm the above.
Miners’ Second Rally and Continued Weakness
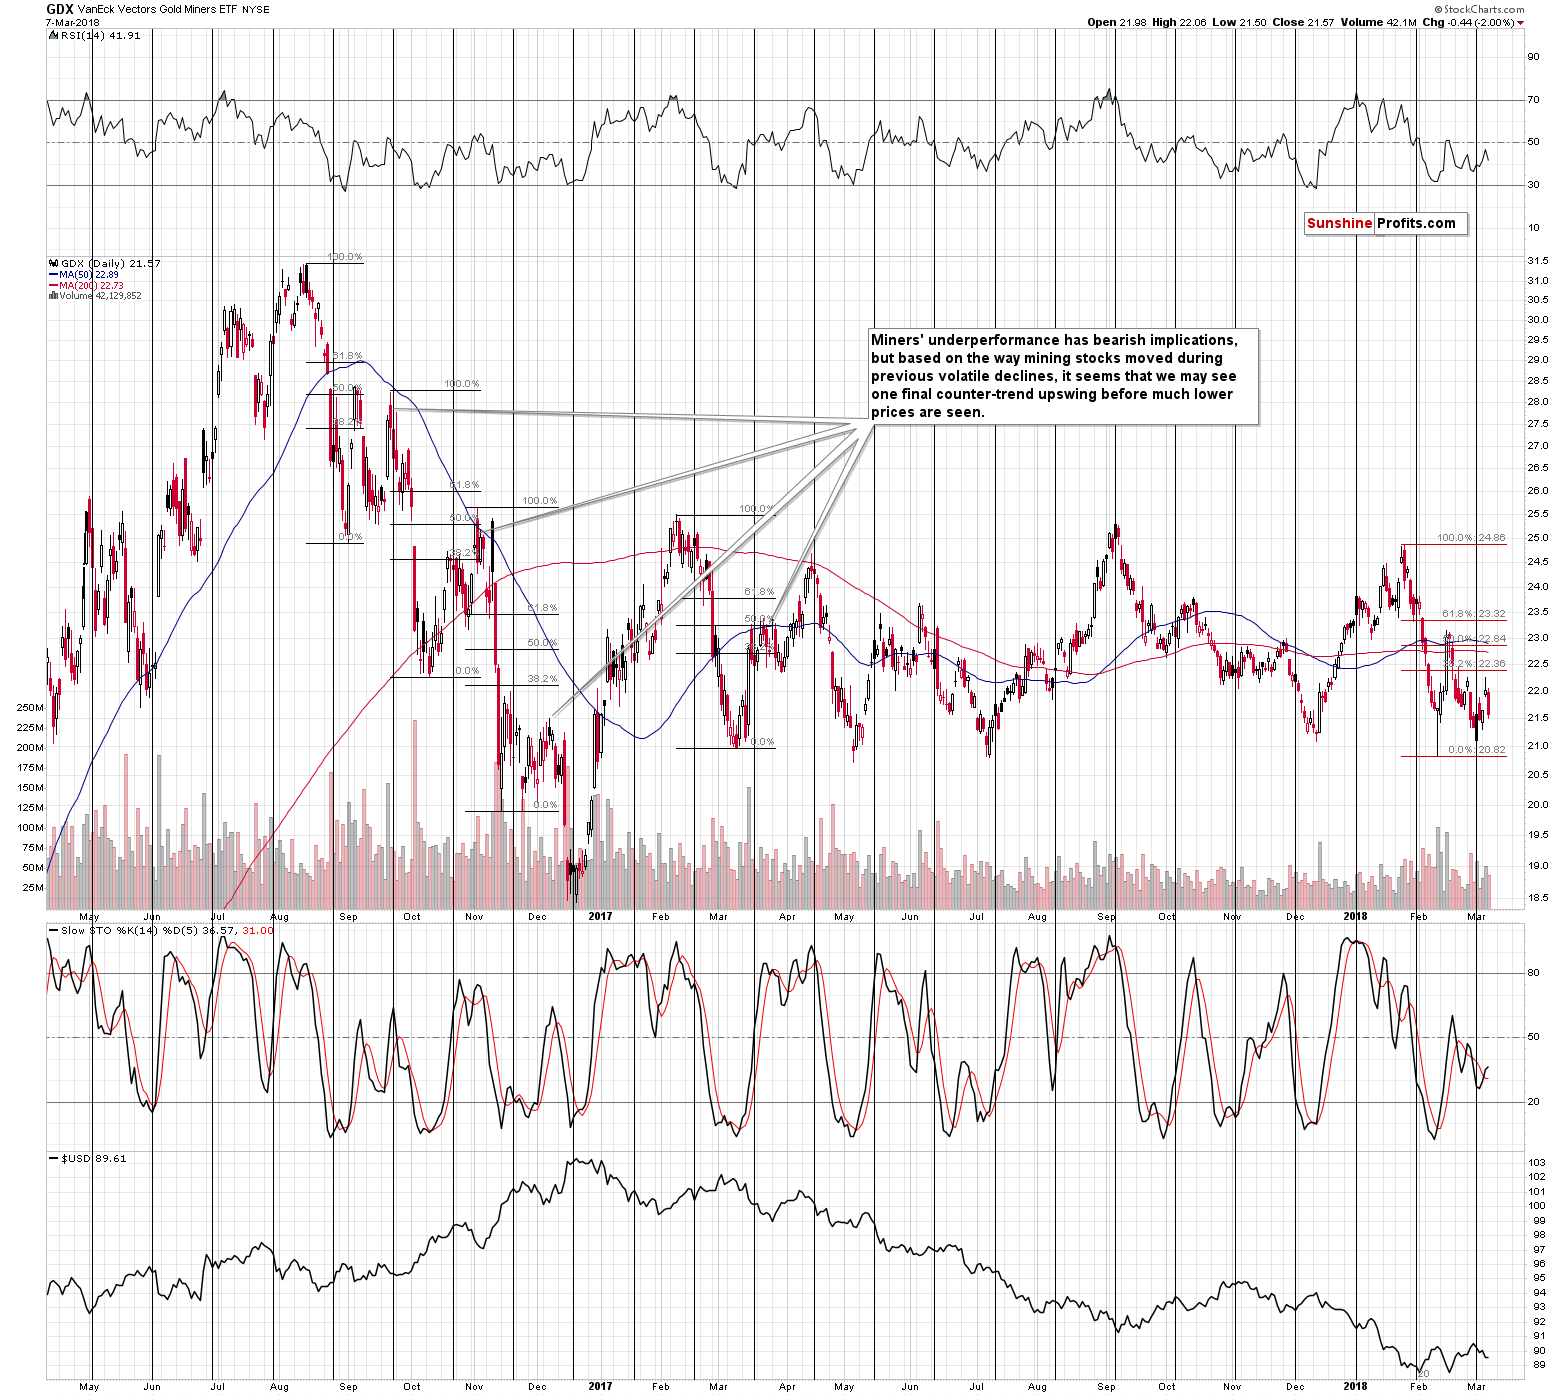
In the case of mining stocks, our yesterday’s comments are generally up-to-date as well:
Mining stocks are underperforming not only relative to the late-February decline. They underperform also relative to the previous cases that we marked on the above chart. During the previous volatile declines, mining stocks used to bounce twice before the decline resumed and the second bounce was not as small as what we saw this week. The implications of the underperformance are bearish.
Moreover, please note that yesterday’s session took form of a shooting star candlestick, which is a classic reversal sign if it is accompanied by sizable volume. The latter was not huge, but it was definitely sizable, and the bearish implications are already present.
The shooting star was indeed followed by a daily decline and the thing that’s worth emphasizing is that while gold and silver closed above their Monday’s closing prices, the GDX ETF didn’t. That’s a clear sign of underperformance, especially that we can say exactly the same thing about the HUI and XAU indices. The implications are bearish.
If gold does indeed move higher in the coming days and mining stocks continue to underperform during the upswing, it will serve as a good indication that a bigger slide is to be expected. This might make us increase the size of our speculative short position.
USD Index and Its Short-term Downswing
The situation in the USD Index practically didn’t change yesterday, so everything that we wrote previously remains up-to-date:
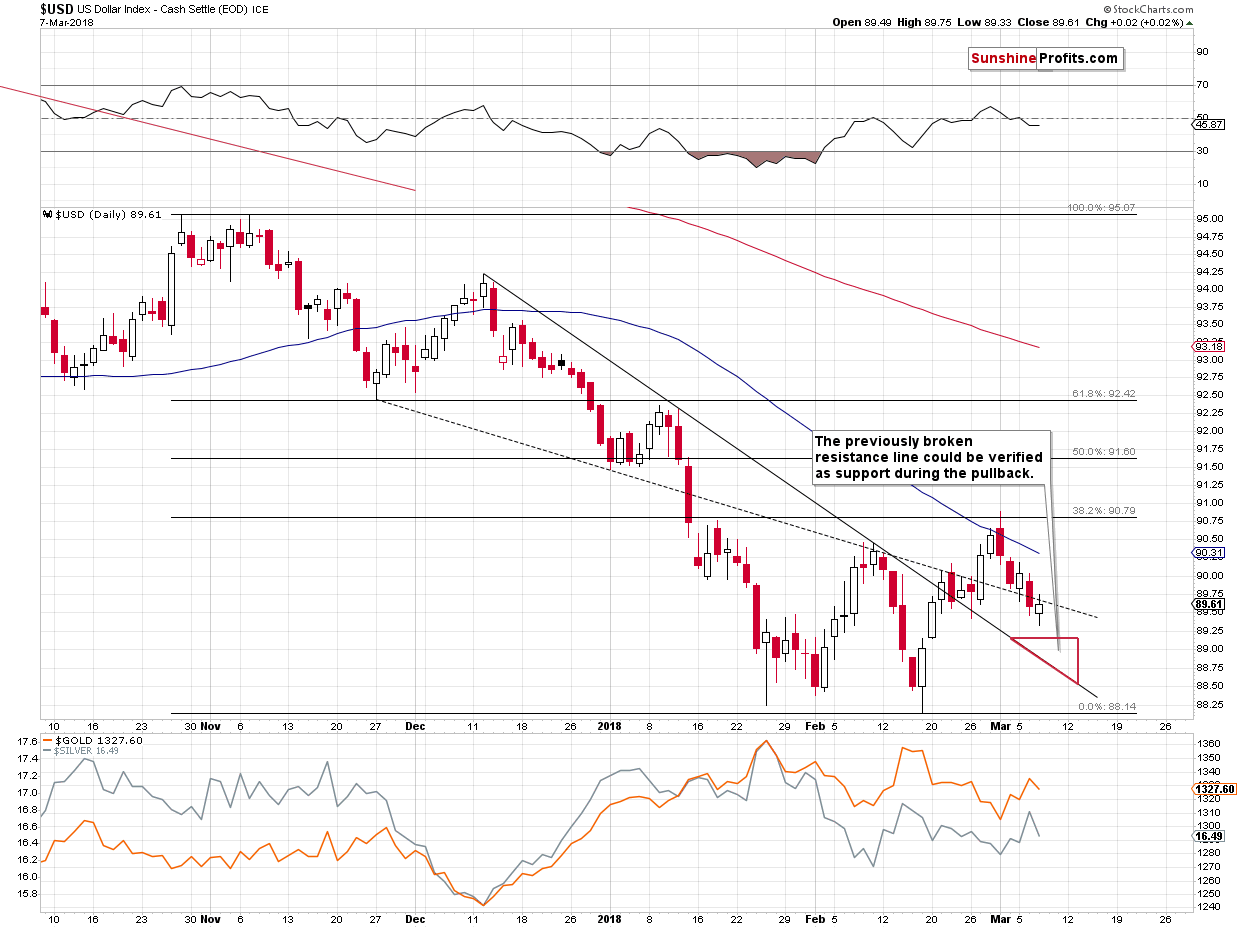
On Monday, we wrote that the decline to the February low could be seen, but that we doubted it. The reason was that the USD was after breakouts above the declining short-term support / resistance lines, so a move back to one of them seemed more likely. The implication is the above red triangle target area.
So far, the USD Index hasn’t moved to it, stopping at the late February lows. But does it have to move lower? Not necessarily.
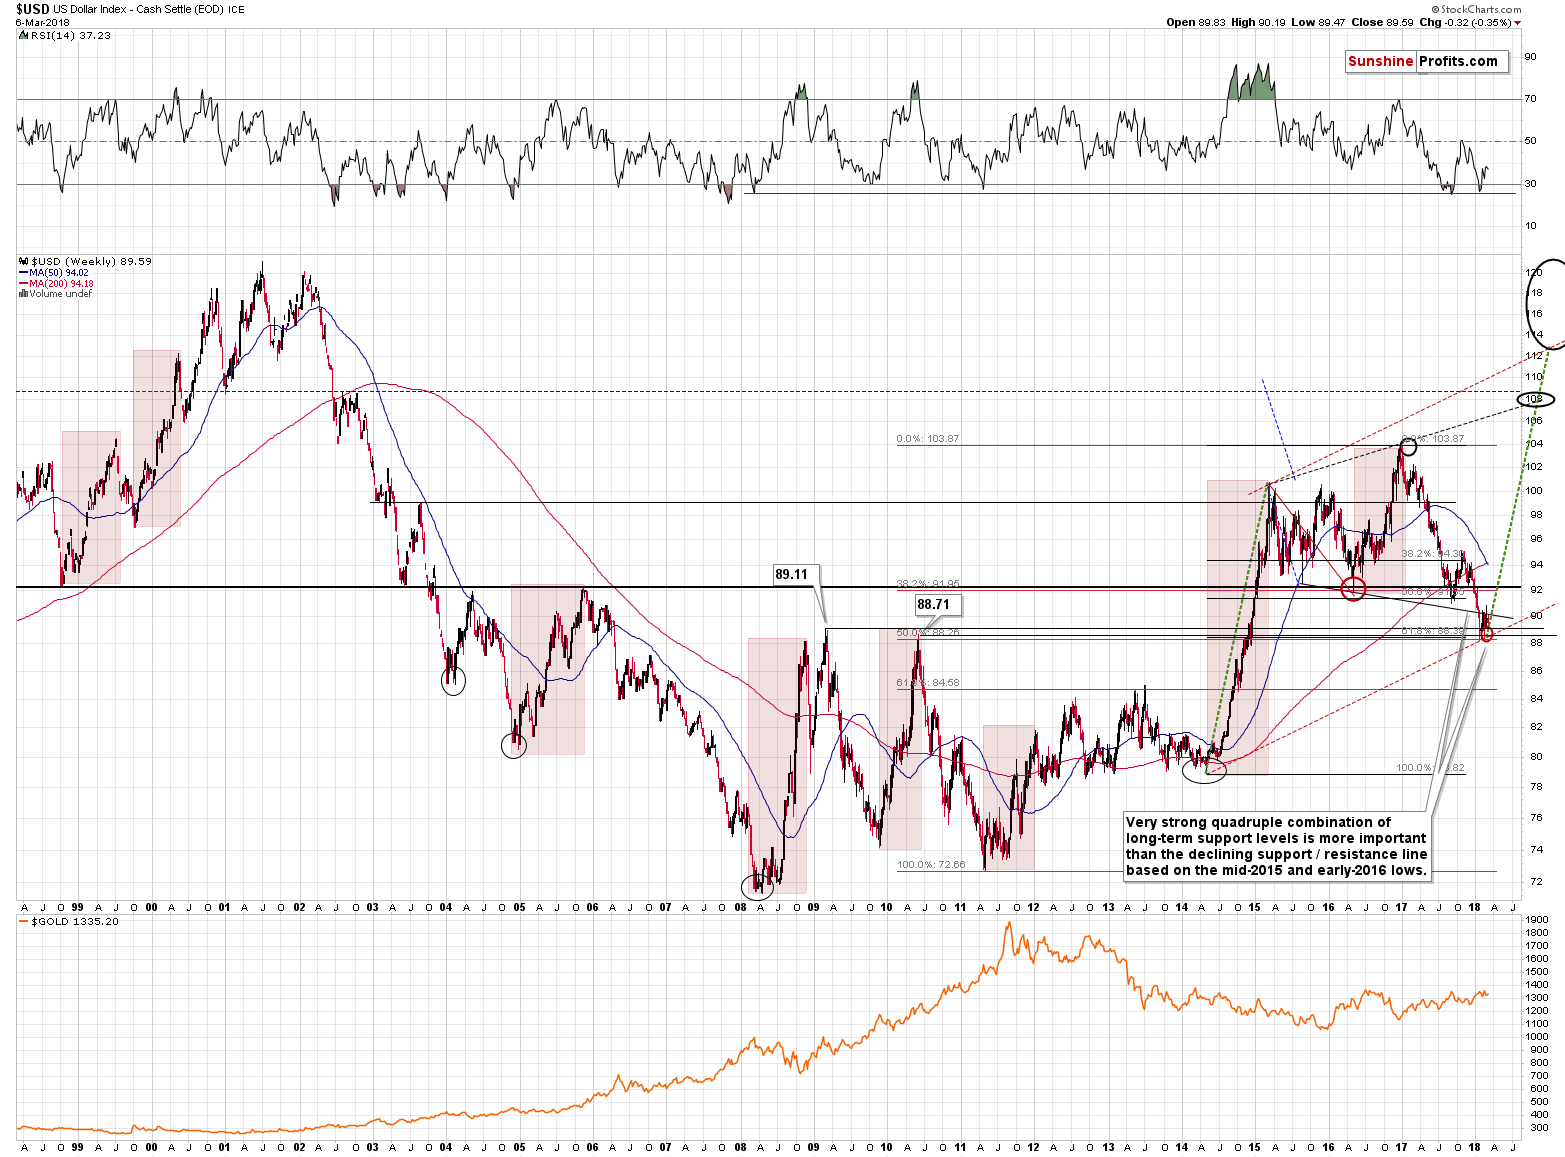
Let’s keep in mind that the USD Index is above a combination of very strong support levels and the big picture remains bullish. Consequently, the surprises are likely to be to the upside.
Still, with looming comments from Mario Draghi and the employment numbers, it seems that we could see some short-term volatility before the end of the week.
Will the USD decline further? It’s possible, but not inevitable. Will gold, silver and mining stocks rally further? They could, but we have already seen bearish confirmations and our target areas were reached, so the outlook is already bearish. It could get more bearish (or it could be invalidated) if the USD Index moves significantly lower in the following days and PMs refuse to really react to this sign. If this is the case, we’ll send follow-up alerts.
Summary
Summing up, a major top in gold, silver and mining stocks is probably in, and based on the events that are scheduled for this week (Draghi’s comments and the U.S. jobs report), we could see another attempt of precious metals to move higher. We already saw the key short-term signs: silver’s outperformance and miners’ underperformance on Tuesday, so a short position is already justified from the risk to reward point of view, but we might get the additional bearish signs shortly. We might see them at higher prices, which would allow us to add to the short position on better terms.
As always, we will keep you – our subscribers – informed.
To summarize:
Trading capital (supplementary part of the portfolio; our opinion): Full short positions (100% of the full position) in gold, silver and mining stocks are justified from the risk/reward perspective with the following stop-loss orders and initial target price levels:
- Gold: initial target price: $1,218; stop-loss: $1,382; initial target price for the DGLD ETN: $53.98; stop-loss for the DGLD ETN $37.68
- Silver: initial target price: $14.63; stop-loss: $17.33; initial target price for the DSLV ETN: $33.88; stop-loss for the DSLV ETN $21.48
- Mining stocks (price levels for the GDX ETF): initial target price: $19.22; stop-loss: $23.54; initial target price for the DUST ETF: $39.88; stop-loss for the DUST ETF $21.46
In case one wants to bet on junior mining stocks' prices (we do not suggest doing so – we think senior mining stocks are more predictable in the case of short-term trades – if one wants to do it anyway, we provide the details), here are the stop-loss details and initial target prices:
- GDXJ ETF: initial target price: $27.82; stop-loss: $36.14
- JDST ETF: initial target price: $94.88 stop-loss: $41.86
Long-term capital (core part of the portfolio; our opinion): No positions (in other words: cash)
Insurance capital (core part of the portfolio; our opinion): Full position
Important Details for New Subscribers
Whether you already subscribed or not, we encourage you to find out how to make the most of our alerts and read our replies to the most common alert-and-gold-trading-related-questions.
Please note that the in the trading section we describe the situation for the day that the alert is posted. In other words, it we are writing about a speculative position, it means that it is up-to-date on the day it was posted. We are also featuring the initial target prices, so that you can decide whether keeping a position on a given day is something that is in tune with your approach (some moves are too small for medium-term traders and some might appear too big for day-traders).
Plus, you might want to read why our stop-loss orders are usually relatively far from the current price.
Please note that a full position doesn’t mean using all of the capital for a given trade. You will find details on our thoughts on gold portfolio structuring in the Key Insights section on our website.
As a reminder – “initial target price” means exactly that – an “initial” one, it’s not a price level at which we suggest closing positions. If this becomes the case (like it did in the previous trade) we will refer to these levels as levels of exit orders (exactly as we’ve done previously). Stop-loss levels, however, are naturally not “initial”, but something that, in our opinion, might be entered as an order.
Since it is impossible to synchronize target prices and stop-loss levels for all the ETFs and ETNs with the main markets that we provide these levels for (gold, silver and mining stocks – the GDX ETF), the stop-loss levels and target prices for other ETNs and ETF (among other: UGLD, DGLD, USLV, DSLV, NUGT, DUST, JNUG, JDST) are provided as supplementary, and not as “final”. This means that if a stop-loss or a target level is reached for any of the “additional instruments” (DGLD for instance), but not for the “main instrument” (gold in this case), we will view positions in both gold and DGLD as still open and the stop-loss for DGLD would have to be moved lower. On the other hand, if gold moves to a stop-loss level but DGLD doesn’t, then we will view both positions (in gold and DGLD) as closed. In other words, since it’s not possible to be 100% certain that each related instrument moves to a given level when the underlying instrument does, we can’t provide levels that would be binding. The levels that we do provide are our best estimate of the levels that will correspond to the levels in the underlying assets, but it will be the underlying assets that one will need to focus on regarding the signs pointing to closing a given position or keeping it open. We might adjust the levels in the “additional instruments” without adjusting the levels in the “main instruments”, which will simply mean that we have improved our estimation of these levels, not that we changed our outlook on the markets. We are already working on a tool that would update these levels on a daily basis for the most popular ETFs, ETNs and individual mining stocks.
Our preferred ways to invest in and to trade gold along with the reasoning can be found in the how to buy gold section. Additionally, our preferred ETFs and ETNs can be found in our Gold & Silver ETF Ranking.
As a reminder, Gold & Silver Trading Alerts are posted before or on each trading day (we usually post them before the opening bell, but we don't promise doing that each day). If there's anything urgent, we will send you an additional small alert before posting the main one.
=====
Latest Free Trading Alerts:
“So it begins.” This is what King Theoden said right before the Battle of Helm’s Deep in the Lord of the Rings. Fortunately, the army of Uruk-hai doesn’t threaten the kingdom of men. But something else – also dreadful – endangers us. Trade wars.
Sounds crazy, right? But from time to time crazy is something that does indeed take place, and these are the times when the prepared are much more profitable than those who were caught with their guard down. There is one analogy that points to the possibility of seeing such a big move in the price of crude oil. What if?
$10 Move in Crude Oil in Just 1 Month? Impossible vs. “I’m Possible”
Stocks closed virtually flat on Wednesday, despite Tuesday's potentially negative resignation of Gary Cohn, the head of President’s National Economic Council. It heightened trade war fears. The market opened lower, but it reversed its intraday downtrend, as investors used the opportunity to buy stocks. The S&P 500 index extended its short-term consolidation following Friday's bounce and Monday's advance. Will it break higher today?
Stock Market Shrugs Off Trade War Fears, But Will It Go Higher?
=====
Hand-picked precious-metals-related links:
PRECIOUS-Gold steadies ahead of ECB meeting
Exclusive: Five banks open up trillion dollar gold club
Hungarian National Bank Decides to Bring Gold Reserves Back Home
Chinese Gold demand likely to continue in 2018
=====
In other news:
Trump Set to Impose Steel Tariffs in Face of Retaliation Threats
Europe has 'arsenal of weapons' to respond to Trump's tariffs: EU's Moscovici
China warns of 'necessary response' in event of trade war with U.S.
World's Oldest Central Bank Has Hit a Dangerous Inflation Wall
Bitcoin’s Tokyo Whale Sold $400 Million and He’s Not Done Yet
=====
Thank you.
Sincerely,
Przemyslaw Radomski, CFA
Founder, Editor-in-chief, Gold & Silver Fund Manager
Gold & Silver Trading Alerts
Forex Trading Alerts
Oil Investment Updates
Oil Trading Alerts

