

Briefly: In our opinion, full (150% of the regular full position) speculative short positions in gold, silver and mining stocks are justified from the risk/reward perspective at the moment of publishing this alert.
In yesterday’s alert, we discussed how tricky the current upswing in the precious metals sector could be and it seems that this has been the case. Mining stocks ended the session a little higher, but gold and silver erased their early gains before the session was over. The situation is tricky also from the USD Index point of view. Let’s start with the latter (chart courtesy of http://stockcharts.com).
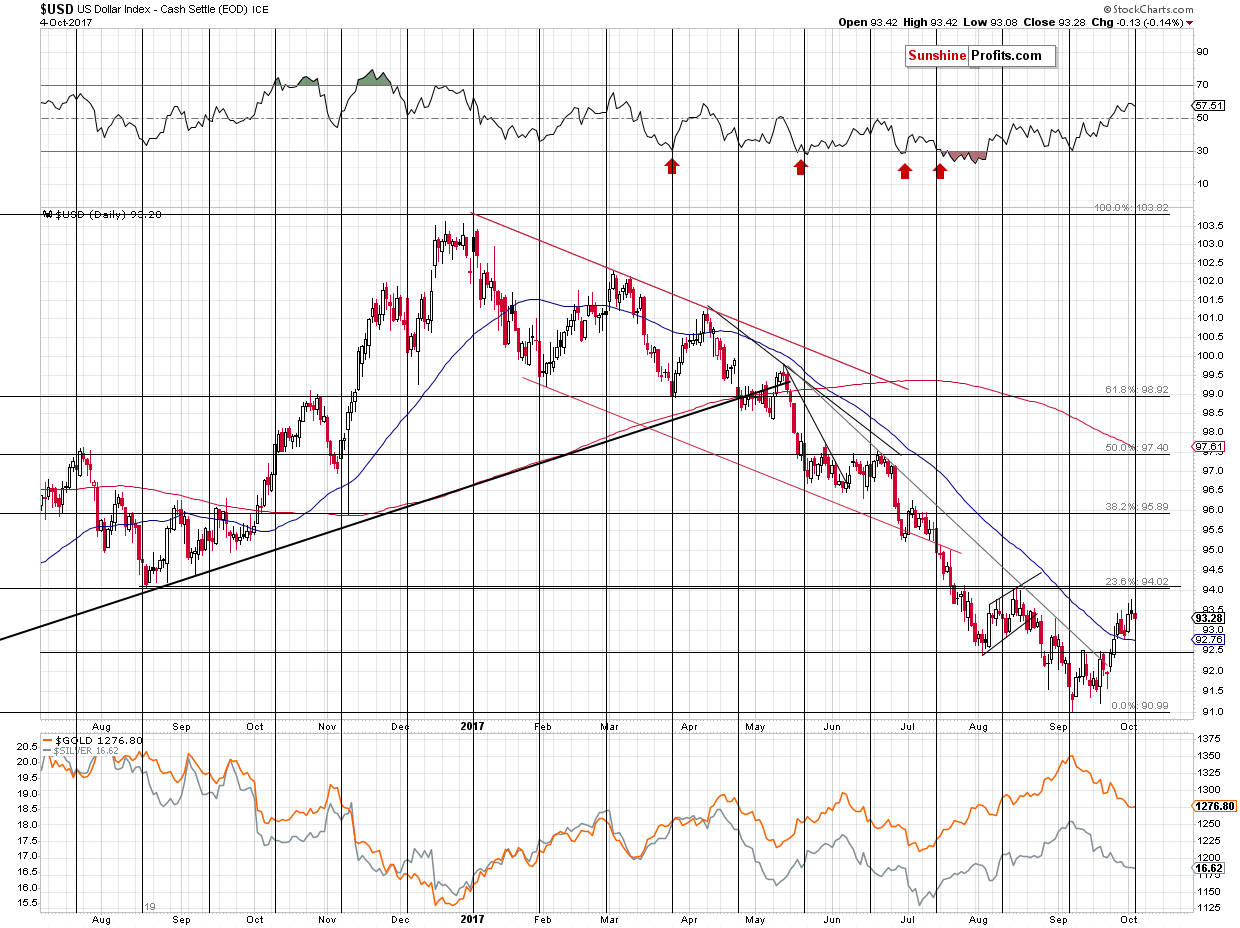
The situation here is tricky, because the key details are not visible on the above chart. The intraday high that we saw two days ago was almost 94 and its not reflected on the above chart and thus the size of the decline that we have seen so far appears smaller than it actually is. The USD Index has actually corrected by almost a full index point.
This is particularly important because of the turning point. If there had been no decline and the previous trend had been up, then the turning point would have bearish implications. However, since we have already seen the USD decline almost a full index point, then perhaps the decline that was likely to be seen, has already taken place and the uptrend can now resume. The implications thereof would be bullish.
The other things that are not visible on the above chart are the important support/resistance levels that are based on more distant events that are visible from the short-term perspective.
In yesterday’s alert, we wrote the following:
The USD just broke back above the long-term lows and it could be verifying this move by trading back and forth above these lows.
The key nearby lows in both: intraday and closing price terms are:
- May 2015: 93.17 and 93.18
- June 2015: 93.30 (intraday)
- August 2015: 92.52 and 93.36
- May 2016: 91.88 and 92.62
4 out of the 7 mentioned support levels are above 93 and the highest of them is at 93.30. Today’s pre-market low was 93.293, so the corrective downswing could already be over. Is it worth betting on a continuation of the USD’s decline and, in consequence, on gold’s short-term corrective upswing? It doesn’t seem worth it from our point of view, but it might still be something to consider for day-traders.
The intraday low was 93.08 and right now the USD Index is trading at 93.45, so the correction already took USD to several important support levels and was followed by an upswing. Therefore, it could already be over.
We could also see a temporary downswing to 92.5 or so, but it doesn’t seem to be likely enough to bet on such a move.
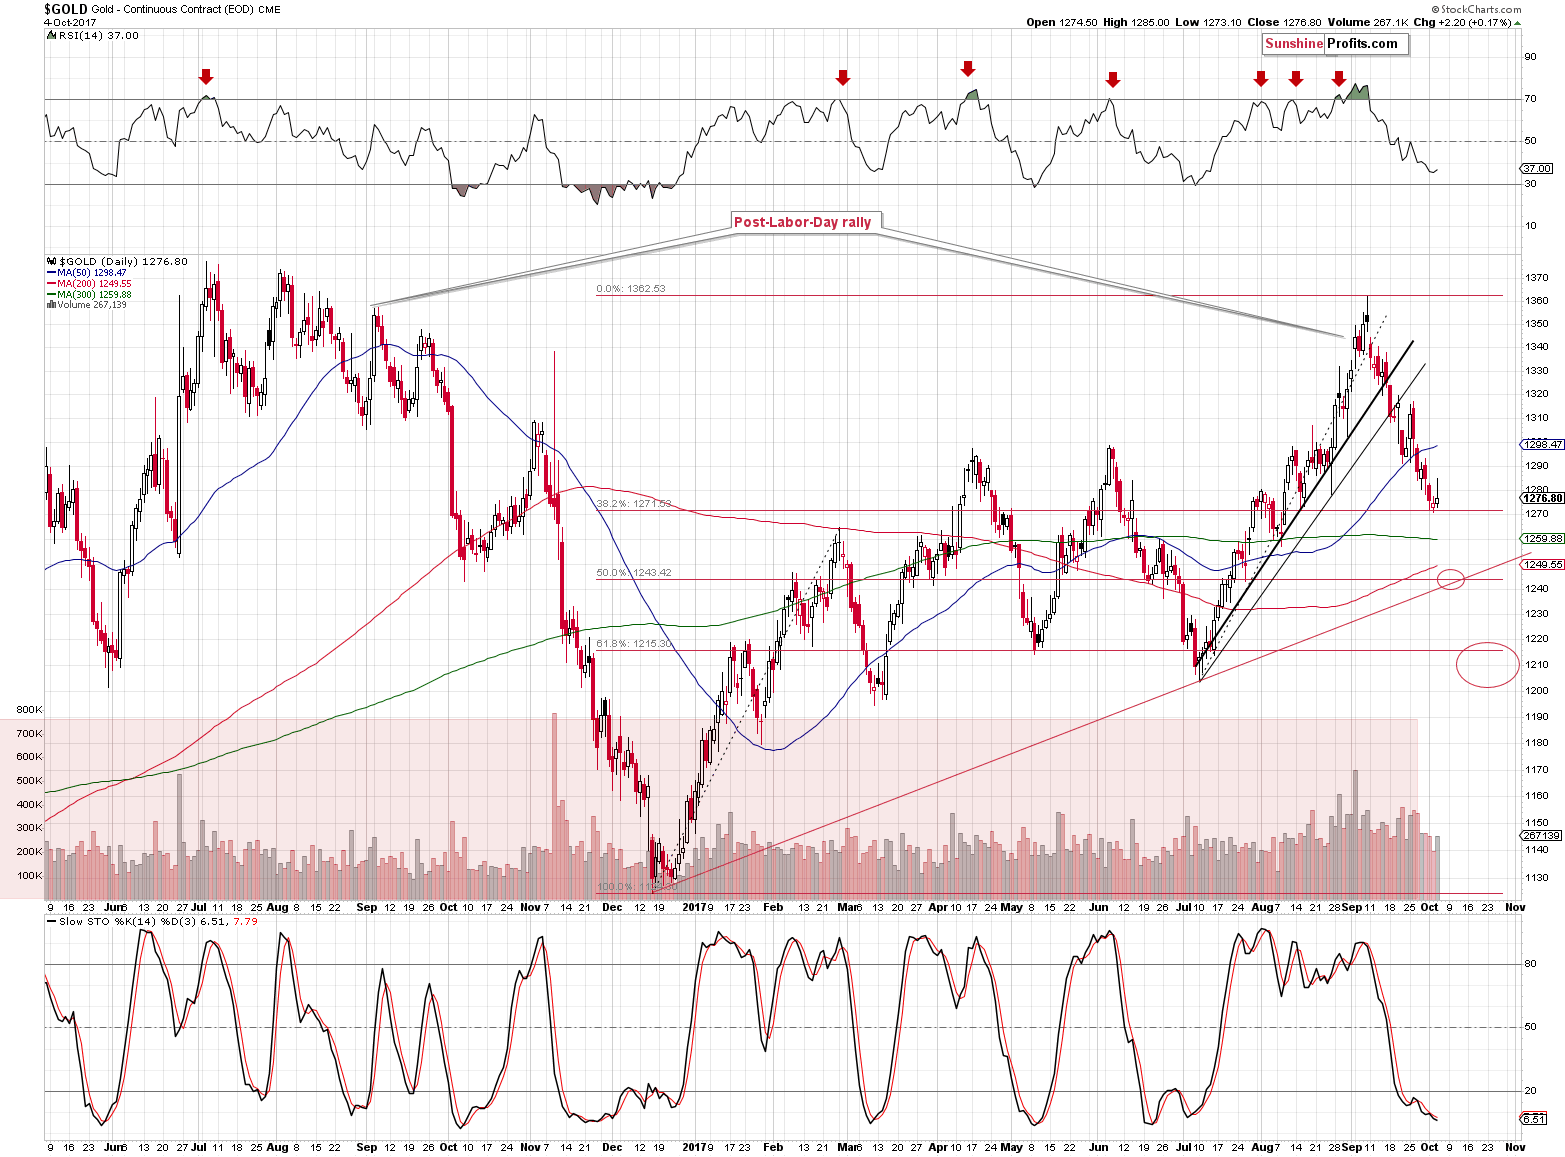
Gold and silver’s reaction to yesterday’s move lower in the USD was similar – metals rallied initially but quickly reversed and ultimately closed more or less without a meaningful change. The inability to trigger a bigger rally in light of positive developments (the USD’s daily downswing) is a sign of weakness and a suggestion that the decline is about to resume.
Our yesterday’s comments regarding the possible and more visible corrective upswing remain up-to-date:
We added one more important thing to the above chart that could generate a more visible upswing – the rising support line, which is currently at about $1,240. It’s crossing the 50% Fibonacci retracement at about $1,244, so this level or its proximity could trigger a bigger rebound. Depending on the confirmations that we get at that time and the way gold approaches this level, we might adjust the current trading position based on it.
In a perfect bullish scenario, gold would drop sharply, but miners would show strength and decline just a little. At the same time, the RSI could get below 30. In other words, a great short-term (and most likely only short-term) bullish case would be similar to what we saw in early October last year.
In a bearish scenario gold would rally sharply right now and then gradually, steadily decline toward $1,244 with miners moving in tune with it or even underperforming it. In this case, the RSI alone might not be enough to trigger a bigger reversal, just like it wasn’t able to do so last November.
In yesterday’s alert, we wrote the following:
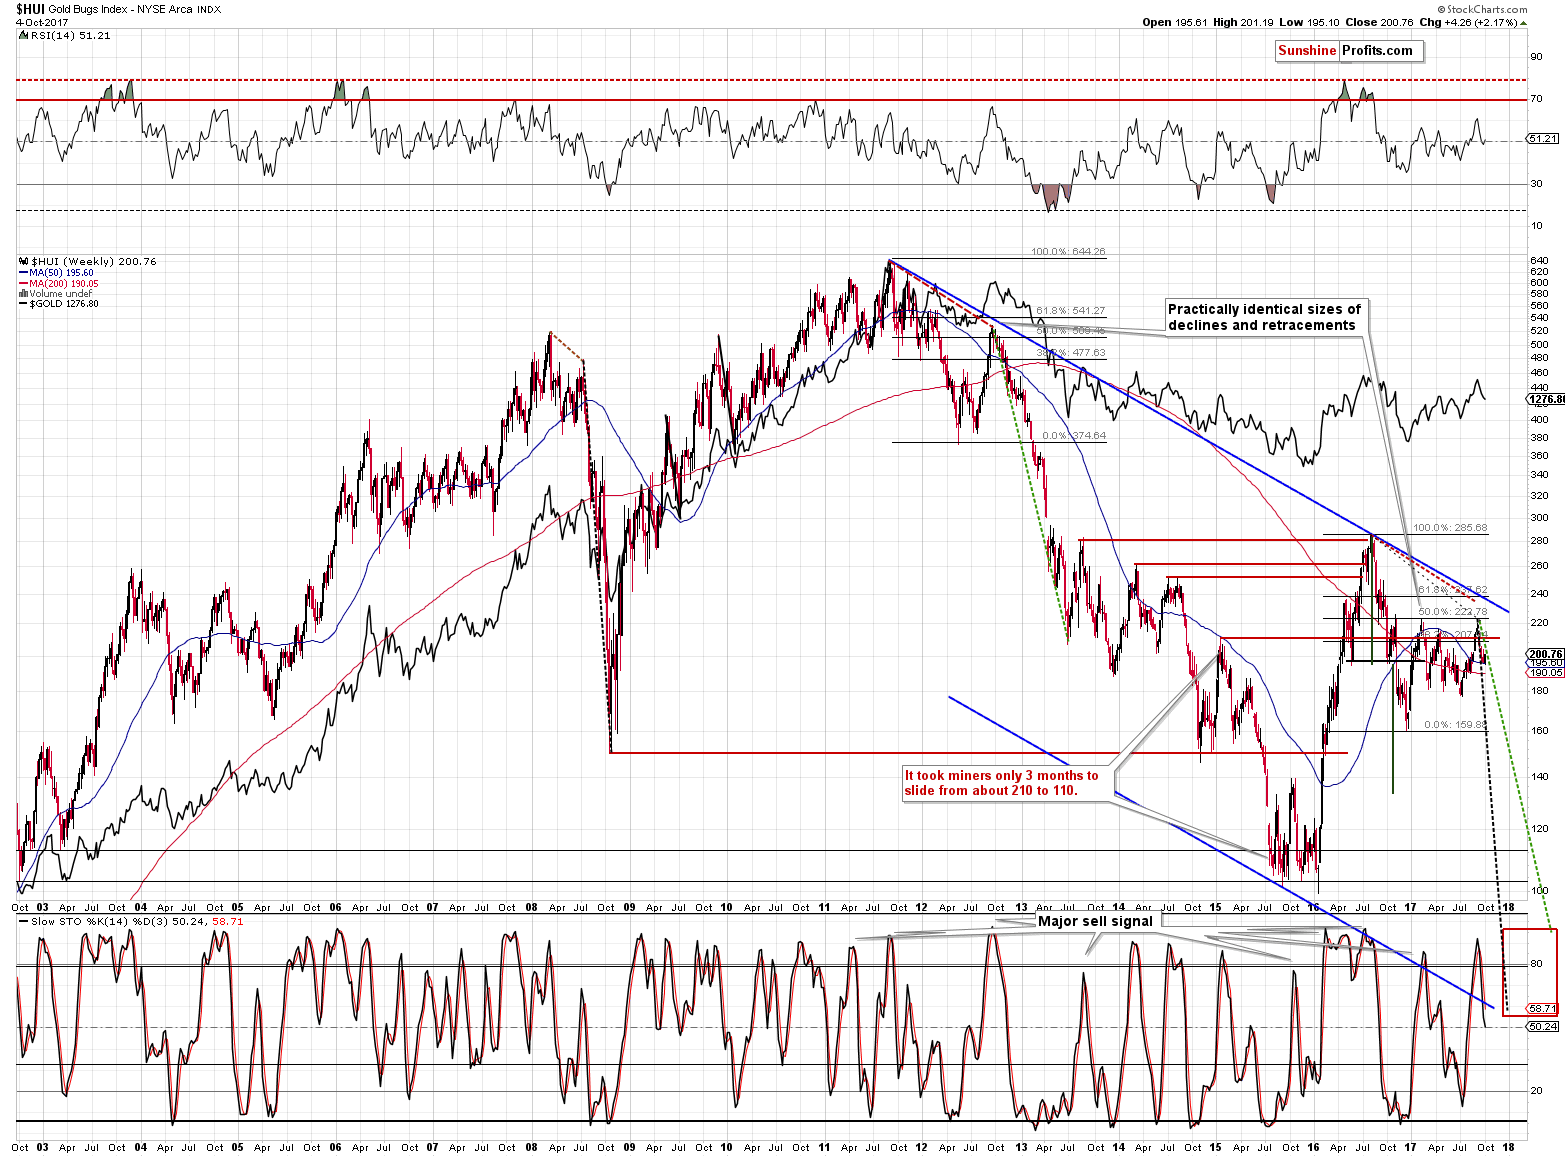
From the long-term point of view, however, we see that this upswing could be tricky and very short-lived. There was also a short-term rally in the early part of the 2012-2013 decline and the price reversed very quickly. Just before the end of 2012 the HUI traded at about 420, and it rallied to 455 in about a week, but it took just one session to take the HUI back to about 430, so it was very risky to enter a long position at that time. Moreover, this price action started a multi-month plunge and higher prices have not been seen ever since that time.
So far, the HUI Index’s decline continues between the 2 dashed lines, which means that the current downswing is more or less in tune with the previous huge declines: the 2008 and the 2012-2013 ones. Please note that even a move a bit above the green dashed line would not invalidate the analogy as the price of the HUI Index was above it for the decline in 2013 as well (it accelerated in the final part of the slide).
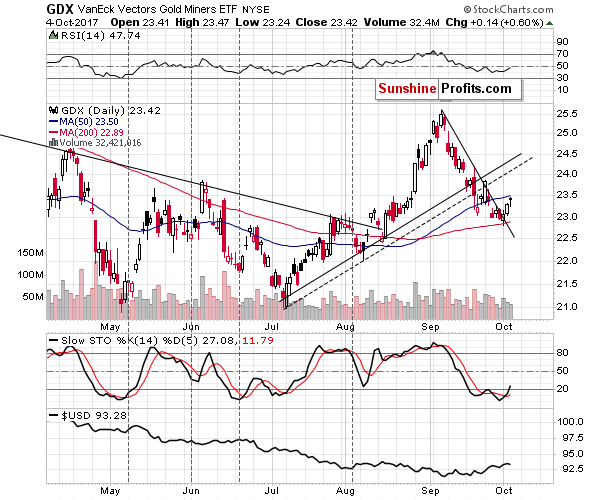
The above remains up-to-date and the same goes for our October 3 Gold & Silver Trading Alert comments on the GDX ETF:
Mining stocks held up quite well yesterday despite a decline in gold and while it could be attributed to a rally in the general stock market, the relatively big volume accompanying the reversal, seems to suggest that we will see a corrective upswing shortly.
Still, that’s just one day of strength and if gold is about to move higher by only $8, then miners might just move back to their 50-day moving average and then continue to decline – that would not be a substantial move.
Yesterday’s intraday high was 3 cents below the mentioned 50-day moving average, which is quite in tune with the above. Please note that even a move a bit above this MA would not necessarily invalidate the bearish picture, just like what we saw in June 2016.
Before summarizing, we would like to reply to a question that we received yesterday from one of our subscribers as it seems that you may also be interested in that topic:
Great calls on oil and gold. Well worth the price of admission. Curious, given your short-term outlook for gold bounce, dollar temp weakness what is your take on the gold silver ratio short term and intermediate?
Before moving to the more short-term picture, we would like to remind the situation from the very long-term point of view:
We commented on this ratio in detail in July in one of the “Preparing for THE Bottom in Gold” articles (on a side note, we are almost done writing the biggest and perhaps most important part of the series, in which we will discuss WHAT to buy for long-term investments) and nothing has really changed since that time, so what we wrote remains up-to-date:
The first thing that comes to mind while looking at the above chart is that the tops in the ratio usually correspond to bottoms in the precious metals market - silver tends to underperform gold to a big extent in the final part of the decline. The mid-2003 spike in the ratio doesn’t directly confirm this rule (there was a local bottom at that time, though), but the 2008 spike, 2011 bottom and the 2016 spike certainly do. So, while it is not inevitable, it seems likely that the major bottom in the precious metals will be accompanied by a big upward spike in the gold to silver ratio i.e. silver’s extreme underperformance.
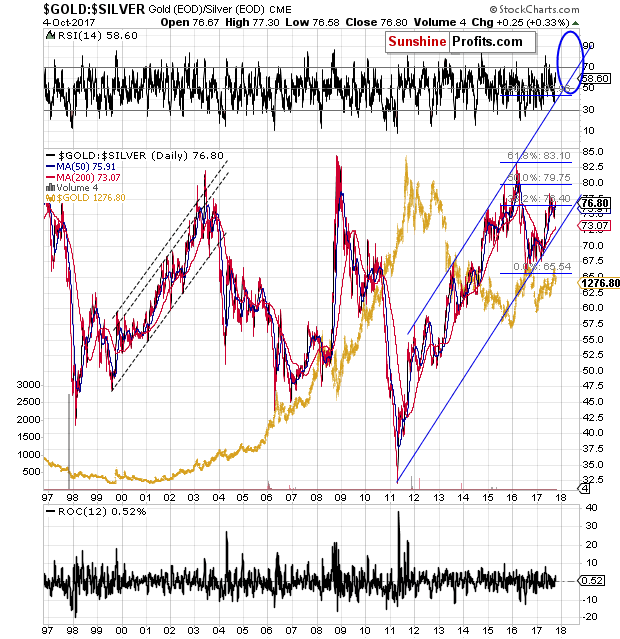
Having said the above, let’s move to the current trend. Despite the decline in 2016, the main direction in which the ratio is heading is still up. We marked the borders of the rising trend channel with blue lines and the ratio is still closer to the lower line than the upper one – meaning that the upside potential remains intact.
If the ratio is to continue to move higher (it’s likely, because an uptrend is intact as long as there is no confirmed breakdown below it), then we can expect the upper border of the trend channel to be reached (or breached – more on that in just a moment) before the top is in. If this is to be seen in 6 months or so (as we indicated in our previous article in this series), then we can expect the ratio to move to about 94.
This target is additionally supported by Fibonacci extensions based on the 2016 bottom, 2016 top and the 2015 top. The Fibonacci extensions work similarly to the Fibonacci retracements – they differ, because the latter provide targets between the levels that were already reached, while the former are usually used to provide targets outside of the previous trading range. In this case, we get another confirmation of 94 as an upside target.
One might ask that if the above is the case, then why didn’t we draw the target area around the 94 level, but between 94 and 100. There are two good reasons for it.
The first reason is visible on the above chart. Namely, history tends to repeat itself to a considerable extent, and during the previous steady uptrend (the 2008 lack-of-liquidity-driven spike was far from being steady) at the beginning of this century, the gold to silver ratio moved temporarily above the upper border of the trend channel (marked with dashed lines) and formed a top above it. Consequently, the upper border of the current rising trend channel may not stop the rally in the following months. Instead, a breakout above it might indicate that the key top in the ratio and the key bottom in the precious metals market are just around the corner.
The second reason for a higher target is visible on the chart below that includes even more data than the previous one.
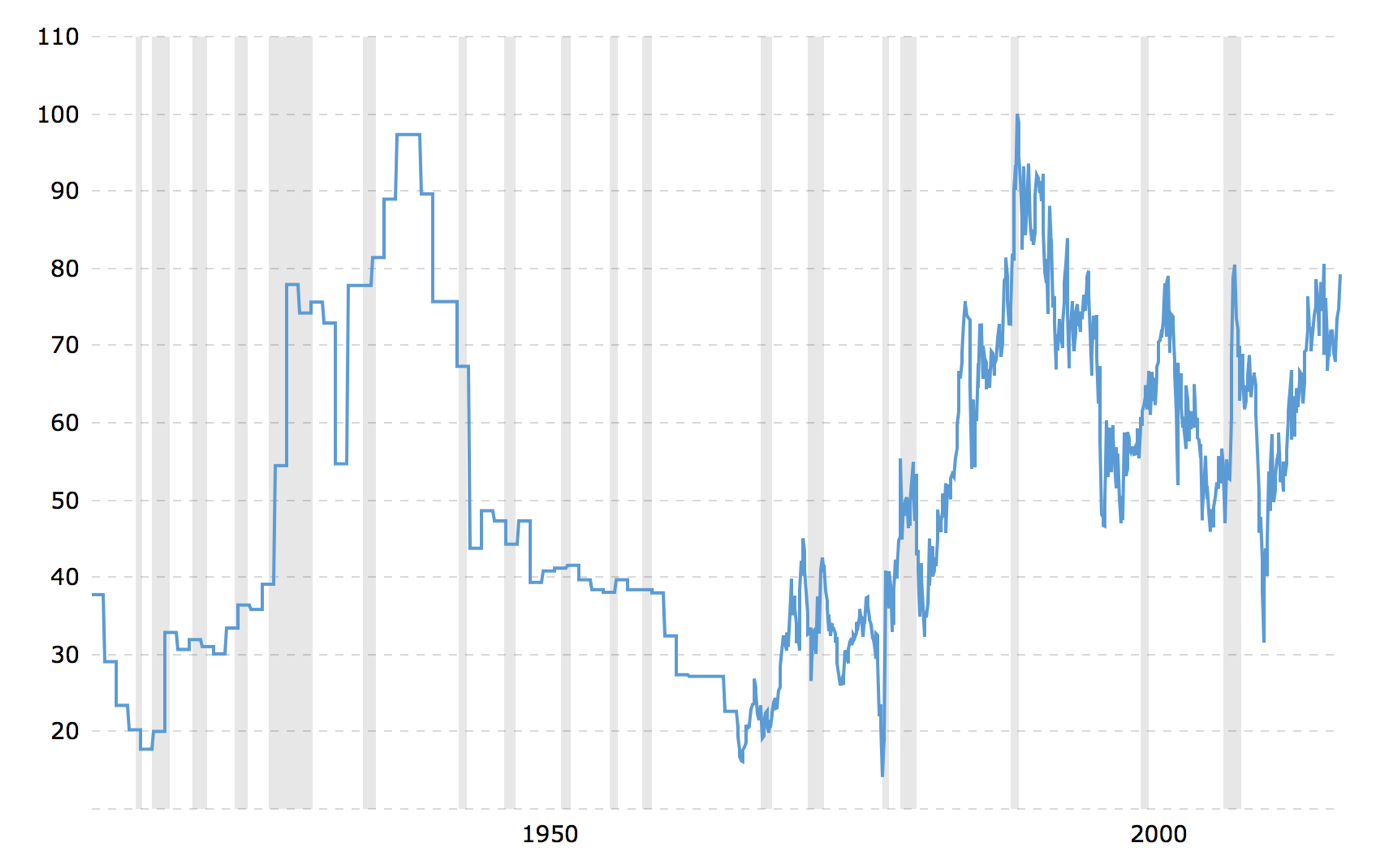
The tops that you saw on the previous chart appear to be the key long-term tops, but in reality, the key long-term tops are at / closer to the 100 level, while the ones from this century are not as important. Surely, they all are important long-term tops, however, we need to keep in mind that the strongest resistance will not be provided by the 2003 or 2008 tops, but by the 100 level.
Moreover, please note that round numbers tend to be important support and resistance levels as they tend to attract more attention (for instance, gold breaking below $1,000 will definitely get more attention than a breakdown below $1,032) – it would be difficult to find a rounder number for the ratio to reach than the 100 level.
Additionally, if the final bottom in the precious metals market was not reached in late 2015 / early 2016, because too many investors were still bullish at that time, then perhaps the extreme that the gold to silver ratio reached at that time was not extreme enough. The next resistance above the 2015 / 2016 tops is provided by the very long-term tops at or a little below 100.
So, should one ignore everything else and wait with the purchases until the gold to silver ratio spikes to 100? Of course not. That’s just one of the tools that one can use in order to determine the optimal entry prices. On a side note, please note that we wrote “optimal” instead of “final” lows. The reason is that it is not 100% certain that a bottom is in at a specified price (it can only be certain when one looks at the past prices after a longer while), so while it may be tempting to wait for the perfect target to be reached, it might be more prudent to place the buy order above the target price to greatly increase the chance of filling it at all – however, these details go beyond the topic of this essay.
The ratio moved a bit lower since we wrote the above, but the move was too small to change anything.
The thing that we would like to emphasize with the short- and intermediate terms in mind is the support at about 73. Even if the ratio declines before rallying, it’s not likely to move below this level.
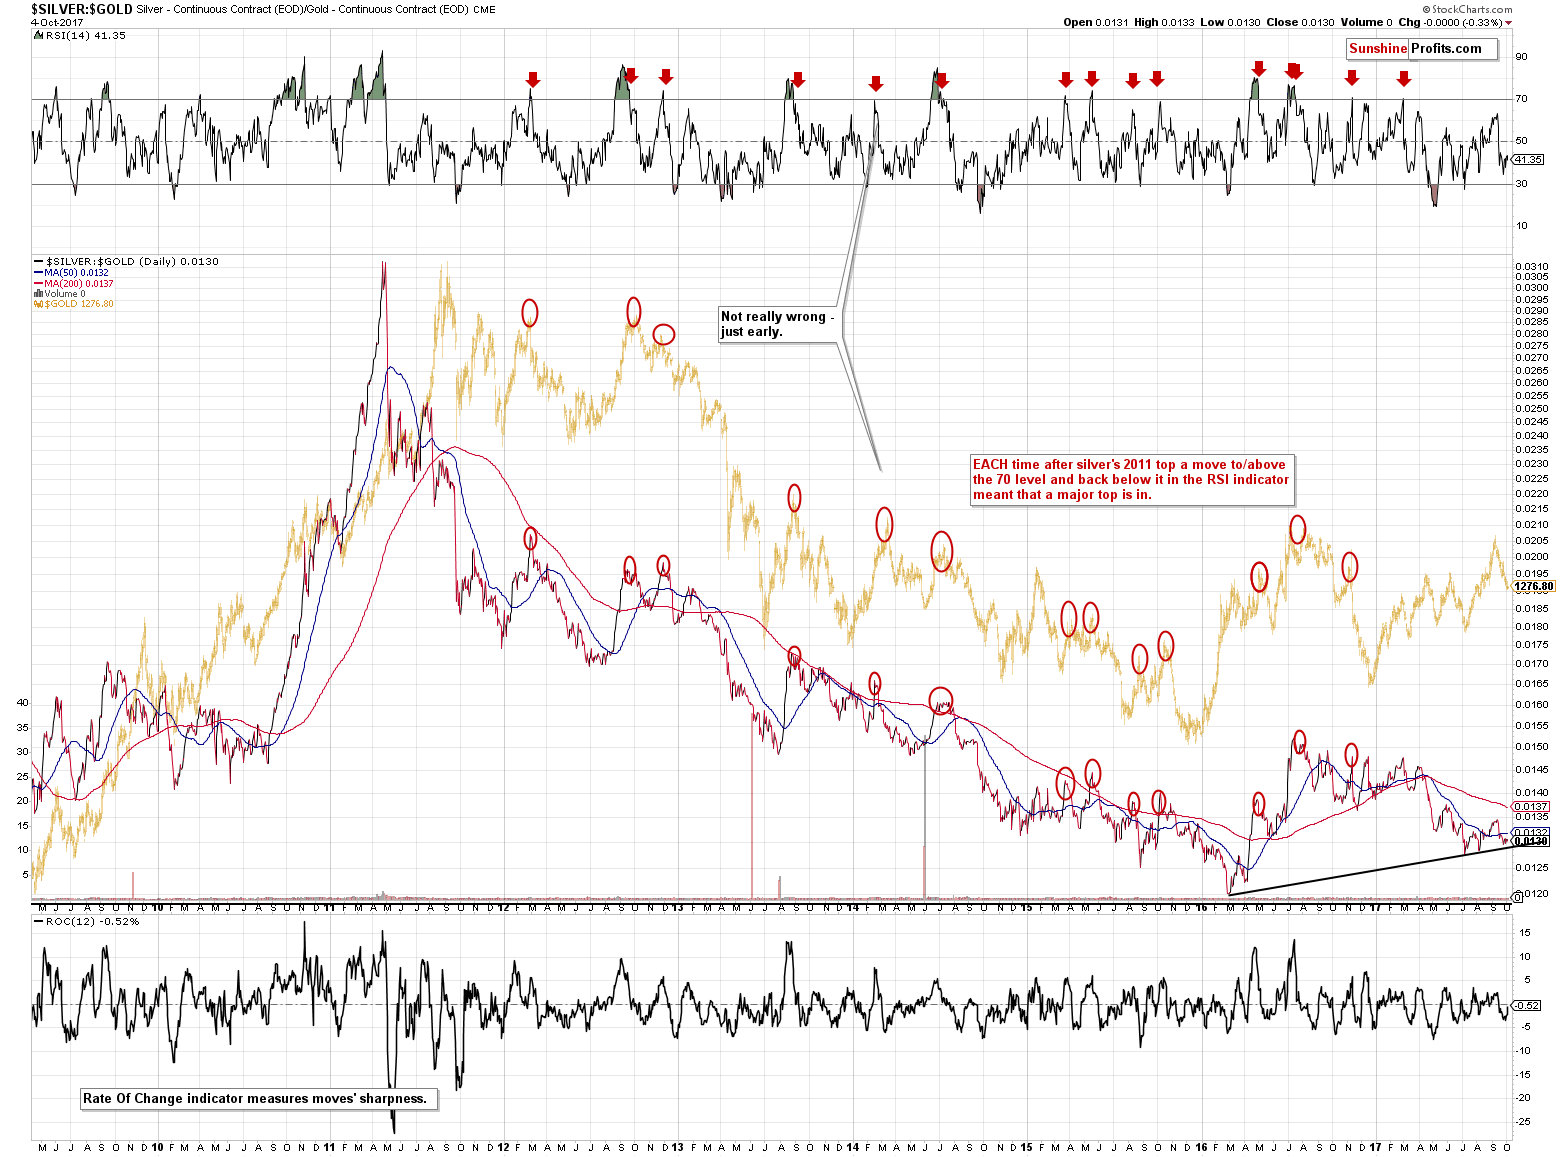
Let’s take a look at the ratio from a different angle – by turning it upside down and making it the silver to gold ratio. That’s useful, because this ratio moves in tune with gold and its easier to spot analogies – this will be useful in a few minutes.
From a more short-term point of view (which is still rather long term, but zooming in more doesn’t really add clarity to the picture as there are no additional support/resistance levels visible when doing so), we see a rising support line that’s based on important bottoms. Once this line is broken, the silver to gold ratio is likely to decline to its previous low or a bit below it, possibly pausing or correcting there – before taking a deeper dive.
However, for now, this line remains unbroken and thus one should expect some kind of rebound once it is reached – it is nearby but the ratio is not yet at it.
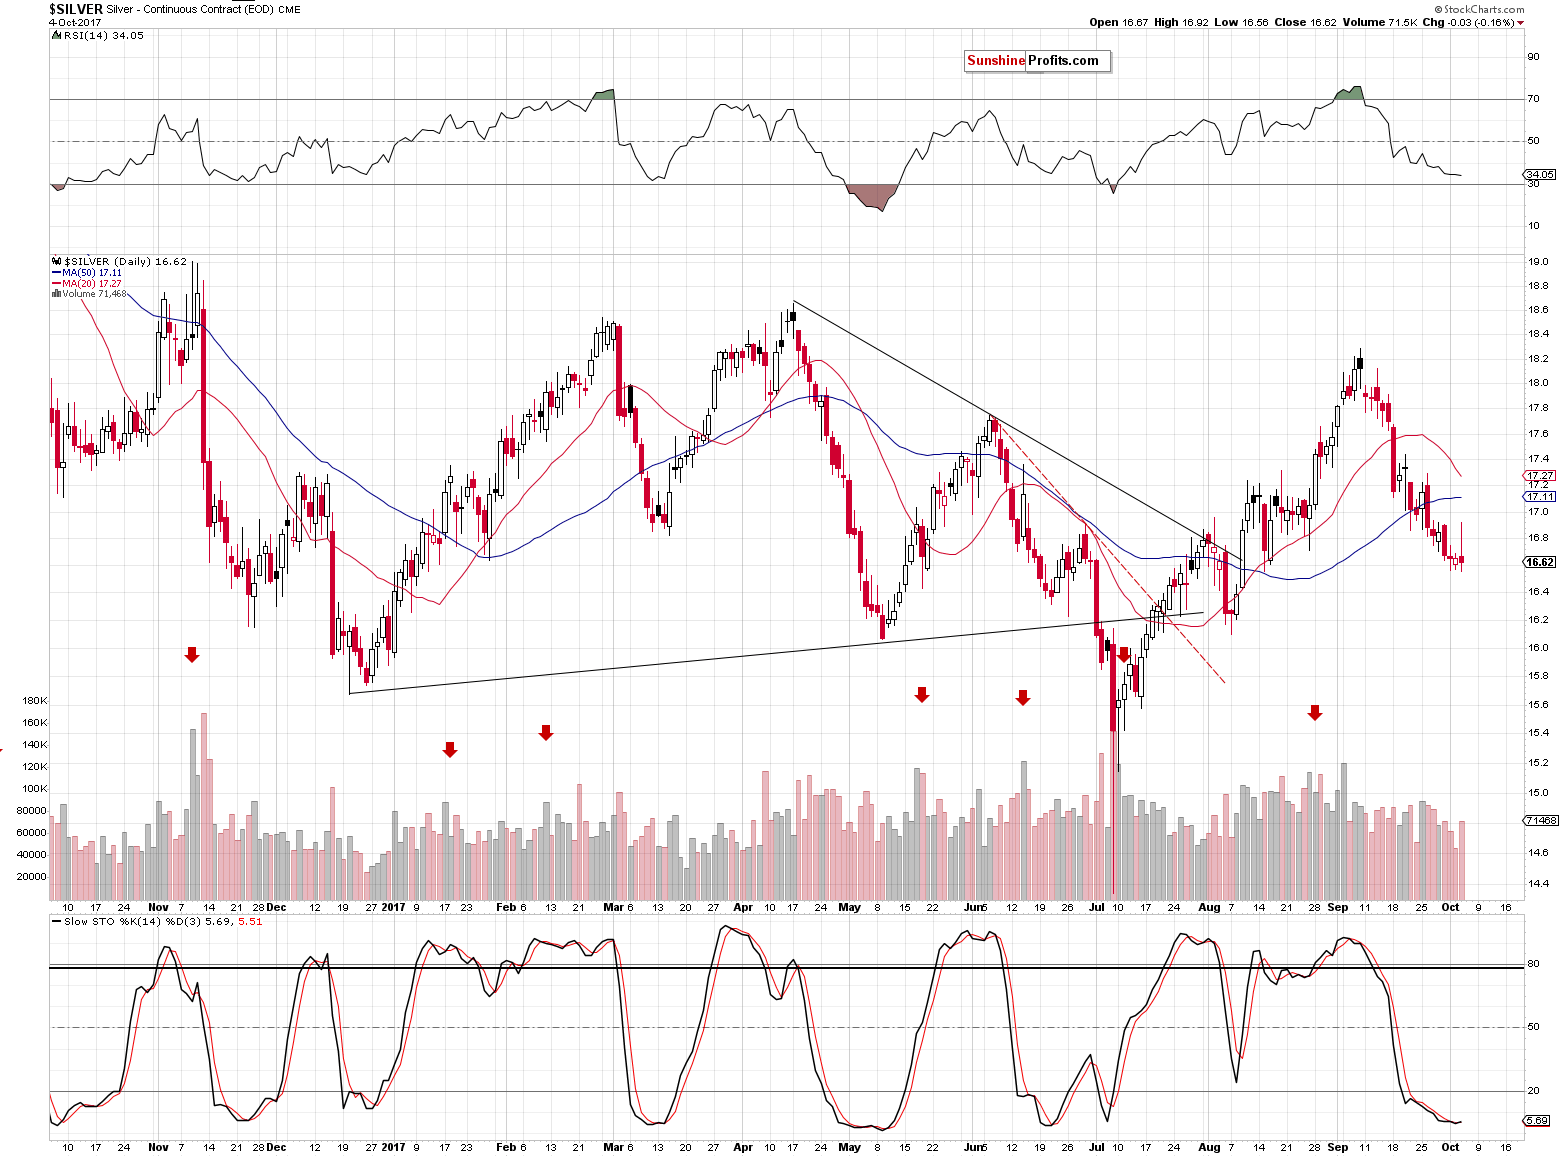
So, when would the ratio be likely to reach it? This is where the analogy to the price of gold comes in. As we wrote earlier today, gold could bounce once it moves to $1,244 or so. This seems to be low enough to correspond to the silver to gold ratio reaching its rising support line. If gold is to correct at that time, so can the ratio. Where could silver go in such a case? To a nearby support level that seems strong enough to generate a corrective upswing – the best candidate for a rebound in silver seems to be the August 2017 bottom - $16.09 (which is just 3 cents above from the May bottom).
So, here’s how it’s likely to play out: the current small correction (which is mostly visible in mining stocks anyway) gets over quite quickly, gold and silver continue to decline while the USD rallies, then gold moves below $1,250, silver moves below $16.10, and the silver to gold ratio moves to its rising support line. Next, depending on the confirmations that we get at that time we might see either a breakdown below all the mentioned levels or a corrective upswing and a breakdown thereafter. Which one is more likely? We are leaning more toward the corrective upswing scenario, but it could change once we get closer to the mentioned price / ratio levels.
On a side note, if silver moves to $16 - $16.10 and rallies from there, please be prepared to read analyses suggesting the existence of a reverse head-and-shoulders formation in silver. When you do read them, please recall that until a formation is completed – there is no formation. We discussed the details in the September 11 Gold & Silver Trading Alert.
Summing up, there are multiple strong, long-term signals pointing to much lower prices of precious metals in the following weeks and months, and it seems that the current pause (metals) / upswing (miners) is close to being over. Overall, it doesn’t seem that adjusting the trading position is justified at this time (unless one is day-trading – in this case, mining stocks could provide a trading opportunity) – it seems that it would add risk (of missing a volatile slide), while not providing much of a potential profit. It might become justified (even to a point of entering a small long position) if we get additional bullish signs, though, for instance if gold moves below $1,250 and silver moves below $16.10.
As always, we will keep you – our subscribers – informed.
To summarize:
Trading capital (supplementary part of the portfolio; our opinion): Short positions (150% of the full position) in gold, silver and mining stocks are justified from the risk/reward perspective with the following stop-loss orders and initial target price levels / profit-take orders:
- Gold: initial target price level: $1,063; stop-loss: $1,366; initial target price for the DGLD ETN: $81.88; stop-loss for the DGLD ETN $38.74
- Silver: initial target price: $13.12; stop-loss: $19.22; initial target price for the DSLV ETN: $46.18; stop-loss for the DSLV ETN $17.93
- Mining stocks (price levels for the GDX ETF): initial target price: $9.34; stop-loss: $26.34; initial target price for the DUST ETF: $143.56; stop-loss for the DUST ETF $21.37
In case one wants to bet on junior mining stocks' prices (we do not suggest doing so – we think senior mining stocks are more predictable in the case of short-term trades – if one wants to do it anyway, we provide the details), here are the stop-loss details and initial target prices:
- GDXJ ETF: initial target price: $14.13; stop-loss: $45.31
- JDST ETF: initial target price: $417.04; stop-loss: $43.12
Long-term capital (core part of the portfolio; our opinion): No positions (in other words: cash)
Insurance capital (core part of the portfolio; our opinion): Full position
Important Details for New Subscribers
Whether you already subscribed or not, we encourage you to find out how to make the most of our alerts and read our replies to the most common alert-and-gold-trading-related-questions.
Please note that the in the trading section we describe the situation for the day that the alert is posted. In other words, it we are writing about a speculative position, it means that it is up-to-date on the day it was posted. We are also featuring the initial target prices, so that you can decide whether keeping a position on a given day is something that is in tune with your approach (some moves are too small for medium-term traders and some might appear too big for day-traders).
Plus, you might want to read why our stop-loss orders are usually relatively far from the current price.
Please note that a full position doesn’t mean using all of the capital for a given trade. You will find details on our thoughts on gold portfolio structuring in the Key Insights section on our website.
As a reminder – “initial target price” means exactly that – an “initial” one, it’s not a price level at which we suggest closing positions. If this becomes the case (like it did in the previous trade) we will refer to these levels as levels of exit orders (exactly as we’ve done previously). Stop-loss levels, however, are naturally not “initial”, but something that, in our opinion, might be entered as an order.
Since it is impossible to synchronize target prices and stop-loss levels for all the ETFs and ETNs with the main markets that we provide these levels for (gold, silver and mining stocks – the GDX ETF), the stop-loss levels and target prices for other ETNs and ETF (among other: UGLD, DGLD, USLV, DSLV, NUGT, DUST, JNUG, JDST) are provided as supplementary, and not as “final”. This means that if a stop-loss or a target level is reached for any of the “additional instruments” (DGLD for instance), but not for the “main instrument” (gold in this case), we will view positions in both gold and DGLD as still open and the stop-loss for DGLD would have to be moved lower. On the other hand, if gold moves to a stop-loss level but DGLD doesn’t, then we will view both positions (in gold and DGLD) as closed. In other words, since it’s not possible to be 100% certain that each related instrument moves to a given level when the underlying instrument does, we can’t provide levels that would be binding. The levels that we do provide are our best estimate of the levels that will correspond to the levels in the underlying assets, but it will be the underlying assets that one will need to focus on regarding the signs pointing to closing a given position or keeping it open. We might adjust the levels in the “additional instruments” without adjusting the levels in the “main instruments”, which will simply mean that we have improved our estimation of these levels, not that we changed our outlook on the markets. We are already working on a tool that would update these levels on a daily basis for the most popular ETFs, ETNs and individual mining stocks.
Our preferred ways to invest in and to trade gold along with the reasoning can be found in the how to buy gold section. Additionally, our preferred ETFs and ETNs can be found in our Gold & Silver ETF Ranking.
As a reminder, Gold & Silver Trading Alerts are posted before or on each trading day (we usually post them before the opening bell, but we don't promise doing that each day). If there's anything urgent, we will send you an additional small alert before posting the main one.
=====
Latest Free Trading Alerts:
Last week, Japan’s Prime Minister, Shinzo Abe, called a snap election. What does it imply for the gold market?
Japanese Snap Election and Gold
S&P 500 index gained 0.1%, as it reached new record high yesterday. Will uptrend continue despite some short-term overbought conditions? Investors will wait for economic data, quarterly earnings releases.
Stocks Keep Going Higher, But Will They Continue?
=====
Hand-picked precious-metals-related links:
Gold Prices Inch Higher In Asia In Thin Trade With Key Markets Shut
Gold price: ETF investors remain bullish
Gold-Coin Sales Drop to Decade Low as Retail Buyers Flee: Chart
Paulson Says Sprott, Others Keen to Join Gold-Investors Group
ICBC cautions against attempts to short Palladium
Goldcorp says no production hit as Mexico mine blockade is lifted
=====
In other news:
Wall Street rally on pause, but more gains seen in 2018: Reuters poll
ECB weighed trade-off between QE extension scenarios in September: minutes
Bank of Japan deputy governor sees 'good prospect' of inflation pressure building
ECB asks banks to set aside more cash for bad debt amid €1tn problem
India's economy in 'downward spiral.' What did Modi get wrong?
Spain’s de Guindos Says Catalonia’s Independence Push Is Doomed
Offshore rig firms see end to worst downturn in history
=====
Thank you.
Sincerely,
Przemyslaw Radomski, CFA
Founder, Editor-in-chief, Gold & Silver Fund Manager
Gold & Silver Trading Alerts
Forex Trading Alerts
Oil Investment Updates
Oil Trading Alerts

