

Briefly: in our opinion, full (250% of the regular position size) speculative short positions in mining stocks are justified from the risk/reward point of view at the moment of publishing this Alert.
We would like to start today's Gold & Silver Trading Alert with quotes from last week's Alert and from the yesterday issue. The former was a reply to one of the questions that we received:
Q1: "I think there must be a trigger that will be the cause of the decline. There is no clear cause for this decline. The first drop was also caused by a virus called Corona. In my opinion, this trigger seems to be a problem due to the crisis of the emerging countries. What do you think is the trigger?"
A1: We both: agree and disagree about the necessity of seeing some kind of trigger. In general, we disagree. The prices can fall just like that and - in fact - that's exactly what mining stocks have been doing recently. Did the USD rally, or did the stock market plunged? No, and yet, the market is falling simply because it rallied too much.
When the market does move more profoundly, people might say that it happened because of something that happened on that single day. And there will be multiple events that will seem like they caused the move. There's a saying in statistics that "if you torture the dataset long enough, it will confess to anything". There might be 20 economic reports released in different parts of the world when gold does something major. Will any of the events be the real cause of the decline? If China invaded Russia today, gold would almost certainly soar because of that. But what kind of event has caused gold to both: rally, decline, and then rally more in February and March? The big development was the same for all of them, but people changed the way in which they reacted to it.
The trigger that you want to see might already be here, but people have not yet managed to start reacting to it in a bearish way. Or actually they did, but not in the way that's profound just yet. The trigger that people are not yet fully reacting to might be the economic damage caused by the second wave of the Covid-19 or by significantly longer single wave. Longer lockdowns, more deaths, both: in the US and globally. That's what was the reason behind the March rally in the USD and what could be behind the next one.
The question is when the press starts covering the rising numbers of new cases - which are almost guaranteed to rise. Once that happens, people will recall that they are actually in the middle of the pandemic and the fear might return - as the perceived scale of pandemic would increase beyond what people already got used to.
Stock market's recent strength is my view something very emotional as if people were in the "it's all over, let's get back to the way everything was" mode. But it's neither over, nor the reality is going to be the same as it used to be. People don't seem to realize the vast cost of this pandemic.
And that's what we wrote in yesterday's Gold & Silver Trading Alert:
The rally in the miners seem decisive, but please note that it was based almost entirely on the reaction to Fed's remarks. Before that, miners have practically ignored gold's intraday upswing, in tune with its recent performance. So, it wasn't really an entire day of strength as the above chart might suggest, but rather a few hours thereof. Besides, the late-May correction has also ended in the same way. There was a daily rally after two days of tiny upswings that followed a reversal. Then within two trading days, miners moved to new lows. Given what's happening in gold so far today (invalidation and an overnight move lower), it seems quite likely.
This time, the move lower that follows could be more significant, though. Why? Because the media is catching up with what's going on in the case of the pandemic, and this means that the general public will also catch up to it.

The above is a screenshot from Bloomberg.com. The second wave of Covid-19 is starting to become "a thing" in the media. We wrote about it on numerous occasions and we wrote specifically that the markets are not reacting to it because their focus is somewhere else. We wrote that eventually, something will happen that will make the media (and thus the investment public) focus on pandemic's exacerbation / prolongation. The 2 million U.S. cases might have been the tipping point.
In March, the fear of the virus escalated quickly, and the prices moved quickly as well, as a direct consequence. These were the times when the USD Index bottomed and soared, and these were the times when the stock market declined along with the precious metals and mining stocks.
The second wave of the virus is likely upon us, and the second wave of the price moves that we saw in March, is likely just around the corner as well. So far today, the USD Index is up while the S&P 500 futures are down.
The chart featuring new global Covid-19 cases proves that things are not improving, but precisely the opposite. And here's an article proving that this topic is indeed starting to get attention in the media.
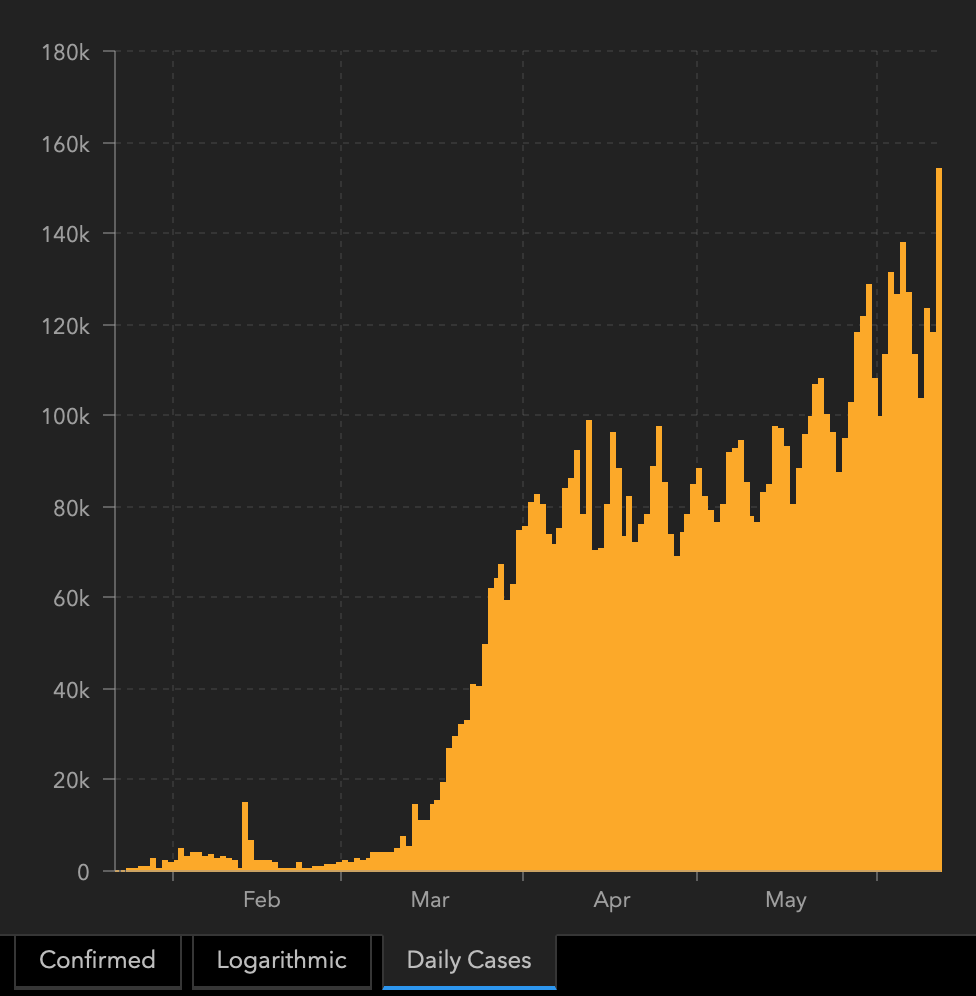
The situation didn't escalate dramatically in the U.S. so far, which is probably why we haven't seen massive declines in the precious metals, mining stocks, and other stocks yet.
It's important to remember, however, that we saw the biggest fear - and biggest price declines - in the very first part of the upswing in U.S. daily cases. Why? Because markets try to discount future and investors aim to act accordingly before something happens, as soon as it becomes very likely. The market is usually good at it, but sometimes it fails miserably.
For instance, the March pandemic was relatively obvious given how contagious this coronavirus was and yet, people reacted only after they saw the U.S. cases starting to rise significantly.
This is very important, because it means that as soon as the numbers confirm the obvious - that the second wave is starting for most of the world (including the U.S.), the markets could move in a very volatile manner.
We previously wrote about the markets being less volatile now, which could translate into smaller volatility on the downside. However, there is also a reason that the opposite could be the case. We might see even more volatility.
You see, one of the key reasons - probably the most important one - due to which the precious metals sector didn't decline for so long, was the prolonged optimism represented by the rising stock market. We are in the early stage of the biggest economic disaster of the last few decades, and the stock market attempted to move to its previous highs. It's hard to tell what's more ridiculous, the above, or the temporarily negative price for crude oil futures that we saw several weeks ago.
Fear is an emotion that's much stronger than greed, and the renewed fear is likely to overwhelm the bullish narrative. In fact, this has already started.
The thing that is different this time than it was in March, is that this time we know how the situation developed in the previous case. It's now the second wave, and the fears about the economic implications are likely to surface shortly. Therefore, the markets are also likely to react more shortly.
While in March the decline could have been described as "unprecedented", this time it's not the case. There already was the first wave, and everyone saw and can still see how the markets reacted.
Remember - the markets are forward looking, so as soon as something becomes reasonably likely, people are likely to act with their money first, and discuss it later. That's why the markets' slide actually preceded the biggest rally in the U.S. Covid-19 cases.
This time, it will be not only the information regarding the U.S. Covid-19 cases that investors will be discounting. They will also notice similarities between the second and first wave and they will likely connect the dots. It might go along the lines of the following:
Ok, stocks plunged during the first wave of the virus, and we're now in the second wave and they have already started to move lower. I better sell right away, before everyone else, so I get better exit prices.
This means that the big moves could take place even sooner than they did in March. And it's applicable not only to the stock market, but also to other markets that were affected in March (meaning almost all of them).
This doesn't mean that the decline will be even sharper - after all, it won't be the fear of the unknown that triggers the move, but a fear of something that is known. The above means, however, that both factors could balance each other and the upcoming volatility could actually be similar to what we saw in March.
History seems to be rhyming and this time, the rhyme is not only with what happened in 2008 (to some extent this remains up-to-date as well), but also with what happened in March 2020.
The similarity to March is definitely present on the technical front as well.
What makes the analysis more difficult, however, is that it doesn't repeat in the same manner in all markets.
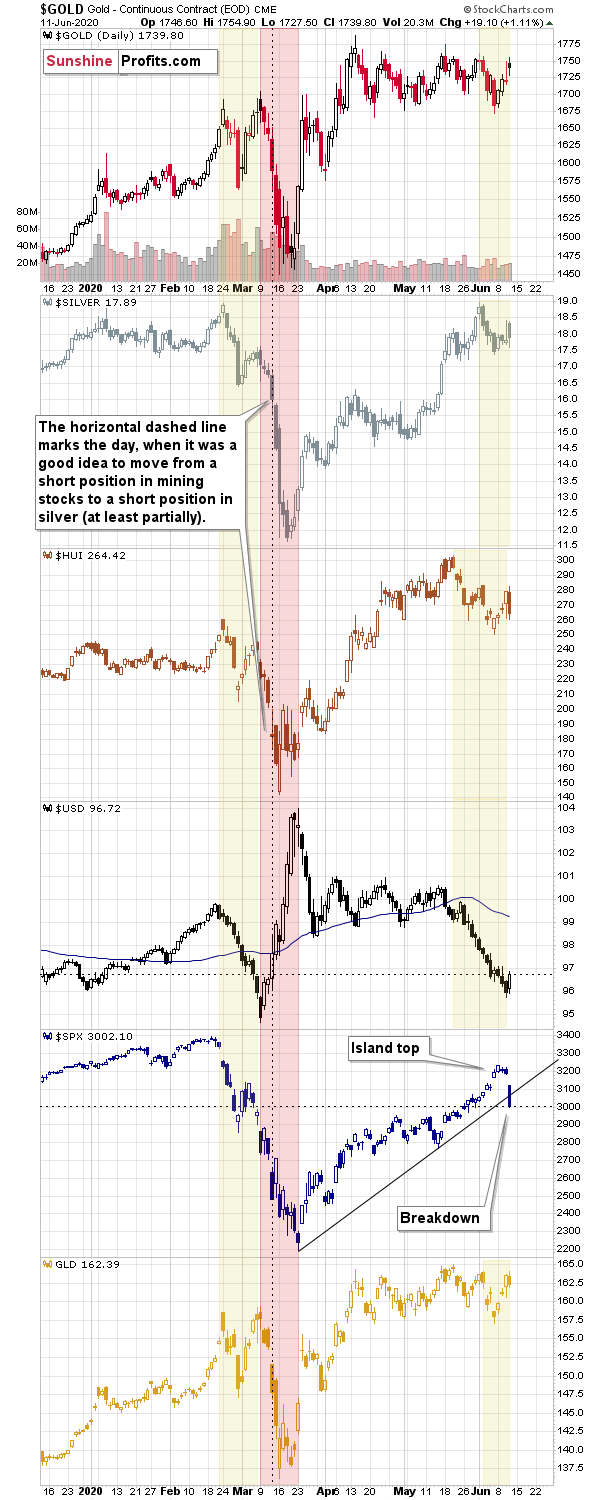
The yellow rectangles mark the similarities across the markets.
In case of the USD Index and mining stocks, the relatively short (about 2 weeks) period in February and March took form that's similar to what happened over about 3 weeks in May and so far in June.
In case of silver, we have a practically 1:1 similarity in case of the initial downswing and the subsequent correction. The corrective upswing didn't take silver back to its previous highs in March, and it certainly wasn't the case this week.
Gold's self-similarity is somewhere in between what happened in the above-mentioned markets. Taking the 1:1 approach in terms of time - similarly to what we did in case of silver - reveals a double-top formation. Taking the May high as the starting point would provide us with a declining trend channel or a triple top formation, but at the same time it would align gold's W pattern instead of a V pattern with the USD Index's whole recent decline.
Regardless of which approach we take, the implications for gold are bearish nonetheless, and the shape of yesterday's candlestick confirms it. That was the third black candlestick that we saw since beginning of March. We saw the first one at the March top - right before the slide - and we saw the second one about 2 weeks later, when gold was finishing the bottoming process. Obviously, gold is not after a huge decline right now, so the above serves as a clear confirmation that yesterday's session was likely similar to March 9th top.
The S&P 500 Index just broke below the rising support line after forming an island top. It also invalidated the breakout above the March high. And why did that happen? There's little to say about any direct reason. And that's what makes this slide so important. It was not a reactive move, but rather one that showed that the buying power has likely dried up despite the massive liquidity injections that we saw previously this year. Interestingly, the S&P 500 Index closed at approximately 3000 level, which is more or less when the second part of the March slide started.
In other words, the S&P 500 is more or less where it was when gold, silver and mining stocks were right after their final pre-slide top. That's a powerful bearish confirmation.
And the USD Index? It just gained 0.77 yesterday. It hasn't gained this much during one day since mid-March 2020. In the previous Alerts, we emphasized that gold is likely to react to bigger rallies in the USD Index. So far, the reaction was most notable in mining stocks, but the black candlestick in gold is an important indication that the emphasis goes on "so far".
Finally, please note that during the March slide, there was a moment (close to the end of the March 12 session) when it was an excellent idea to move from the short position in mining stocks to a short position in silver. If history repeats itself, and we get similar indications as in March and miners plunge before silver does, we might move from the short position in miners to one in silver, for an extra boost in profitability.
Summary
Summing up, the tops in gold, silver, and mining stocks appear to be already in, and the decline is likely to accelerate shortly, as fears over the second Covid-19 wave increase. The outlook for the precious metals market is extremely bearish for the next few weeks, and it's very bullish for the following months. Even if gold, silver, and mining stocks are not going to move to new 2020 lows, they are still likely to decline visibly when the USD Index soars.
Please note that based on the 1:1 similarity to gold's topping session (yesterday and March 9th), today's session might be relatively calm, but it absolutely doesn't have to be so.
Based on the numerous factors indicating the repeat of the March price moves, it seems that the precious metals sector is about to slide. If one was waiting for a good moment to add to their positions (provided they were not big before) or to enter them at all, it seems like a great time to do so.
After the sell-off (that takes gold below $1,400), we expect the precious metals to rally significantly. The final decline might take as little as 1-3 weeks, so it's important to stay alert to any changes.
Most importantly - stay healthy and safe. We made a lot of money on the March decline and the subsequent rebound (its initial part) price moves (and we'll likely make much more in the following weeks and months), but you have to be healthy to really enjoy the results.
As always, we'll keep you - our subscribers - informed.
To summarize:
Trading capital (supplementary part of the portfolio; our opinion): Full speculative short positions (250% of the full position) in mining stocks is justified from the risk to reward point of view with the following binding exit profit-take price levels:
Senior mining stocks (price levels for the GDX ETF): binding profit-take exit price: $10.32; stop-loss: none (the volatility is too big to justify a SL order in case of this particular trade); binding profit-take level for the DUST ETF: $231.75; stop-loss for the DUST ETF: none (the volatility is too big to justify a SL order in case of this particular trade)
Junior mining stocks (price levels for the GDXJ ETF): binding profit-take exit price: $9.57; stop-loss: none (the volatility is too big to justify a SL order in case of this particular trade); binding profit-take level for the JDST ETF: $284.25; stop-loss for the JDST ETF: none (the volatility is too big to justify a SL order in case of this particular trade)
For-your-information targets (our opinion; we continue to think that mining stocks are the preferred way of taking advantage of the upcoming price move, but if for whatever reason one wants / has to use silver or gold for this trade, we are providing the details anyway. In our view, silver has greater potential than gold does):
Silver futures downside profit-take exit price: $8.58 (the downside potential for silver is significant, but likely not as big as the one in the mining stocks)
Gold futures downside profit-take exit price: $1,382 (the target for gold is least clear; it might drop to even $1,170 or so; the downside potential for gold is significant, but likely not as big as the one in the mining stocks or silver)
Long-term capital (core part of the portfolio; our opinion): No positions (in other words: cash
Insurance capital (core part of the portfolio; our opinion): Full position
Whether you already subscribed or not, we encourage you to find out how to make the most of our alerts and read our replies to the most common alert-and-gold-trading-related-questions.
Please note that the in the trading section we describe the situation for the day that the alert is posted. In other words, it we are writing about a speculative position, it means that it is up-to-date on the day it was posted. We are also featuring the initial target prices, so that you can decide whether keeping a position on a given day is something that is in tune with your approach (some moves are too small for medium-term traders and some might appear too big for day-traders).
Plus, you might want to read why our stop-loss orders are usually relatively far from the current price.
Please note that a full position doesn't mean using all of the capital for a given trade. You will find details on our thoughts on gold portfolio structuring in the Key Insights section on our website.
As a reminder - "initial target price" means exactly that - an "initial" one, it's not a price level at which we suggest closing positions. If this becomes the case (like it did in the previous trade) we will refer to these levels as levels of exit orders (exactly as we've done previously). Stop-loss levels, however, are naturally not "initial", but something that, in our opinion, might be entered as an order.
Since it is impossible to synchronize target prices and stop-loss levels for all the ETFs and ETNs with the main markets that we provide these levels for (gold, silver and mining stocks - the GDX ETF), the stop-loss levels and target prices for other ETNs and ETF (among other: UGLD, DGLD, USLV, DSLV, NUGT, DUST, JNUG, JDST) are provided as supplementary, and not as "final". This means that if a stop-loss or a target level is reached for any of the "additional instruments" (DGLD for instance), but not for the "main instrument" (gold in this case), we will view positions in both gold and DGLD as still open and the stop-loss for DGLD would have to be moved lower. On the other hand, if gold moves to a stop-loss level but DGLD doesn't, then we will view both positions (in gold and DGLD) as closed. In other words, since it's not possible to be 100% certain that each related instrument moves to a given level when the underlying instrument does, we can't provide levels that would be binding. The levels that we do provide are our best estimate of the levels that will correspond to the levels in the underlying assets, but it will be the underlying assets that one will need to focus on regarding the signs pointing to closing a given position or keeping it open. We might adjust the levels in the "additional instruments" without adjusting the levels in the "main instruments", which will simply mean that we have improved our estimation of these levels, not that we changed our outlook on the markets. We are already working on a tool that would update these levels on a daily basis for the most popular ETFs, ETNs and individual mining stocks.
Our preferred ways to invest in and to trade gold along with the reasoning can be found in the how to buy gold section. Additionally, our preferred ETFs and ETNs can be found in our Gold & Silver ETF Ranking.
As a reminder, Gold & Silver Trading Alerts are posted before or on each trading day (we usually post them before the opening bell, but we don't promise doing that each day). If there's anything urgent, we will send you an additional small alert before posting the main one.
Thank you.
Sincerely,
Przemyslaw Radomski, CFA
Editor-in-chief, Gold & Silver Fund Manager

