

Briefly: In our opinion, full (200% of the regular size of the position) speculative short positions in gold, silver and mining stocks are justified from the risk/reward perspective at the moment of publishing this alert.
Gold, silver and mining stock prices haven’t done much in the final part of the previous week, but it doesn’t mean that it’s a good time to sit back and relax as nothing is likely to happen this week. Conversely, there are two apex-based turning points this week and it seems that the next several days will be anything but boring.
As a reminder, let’s start with the charts that include the long-term triangles and reversals based on their apexes.
Looming Reversals
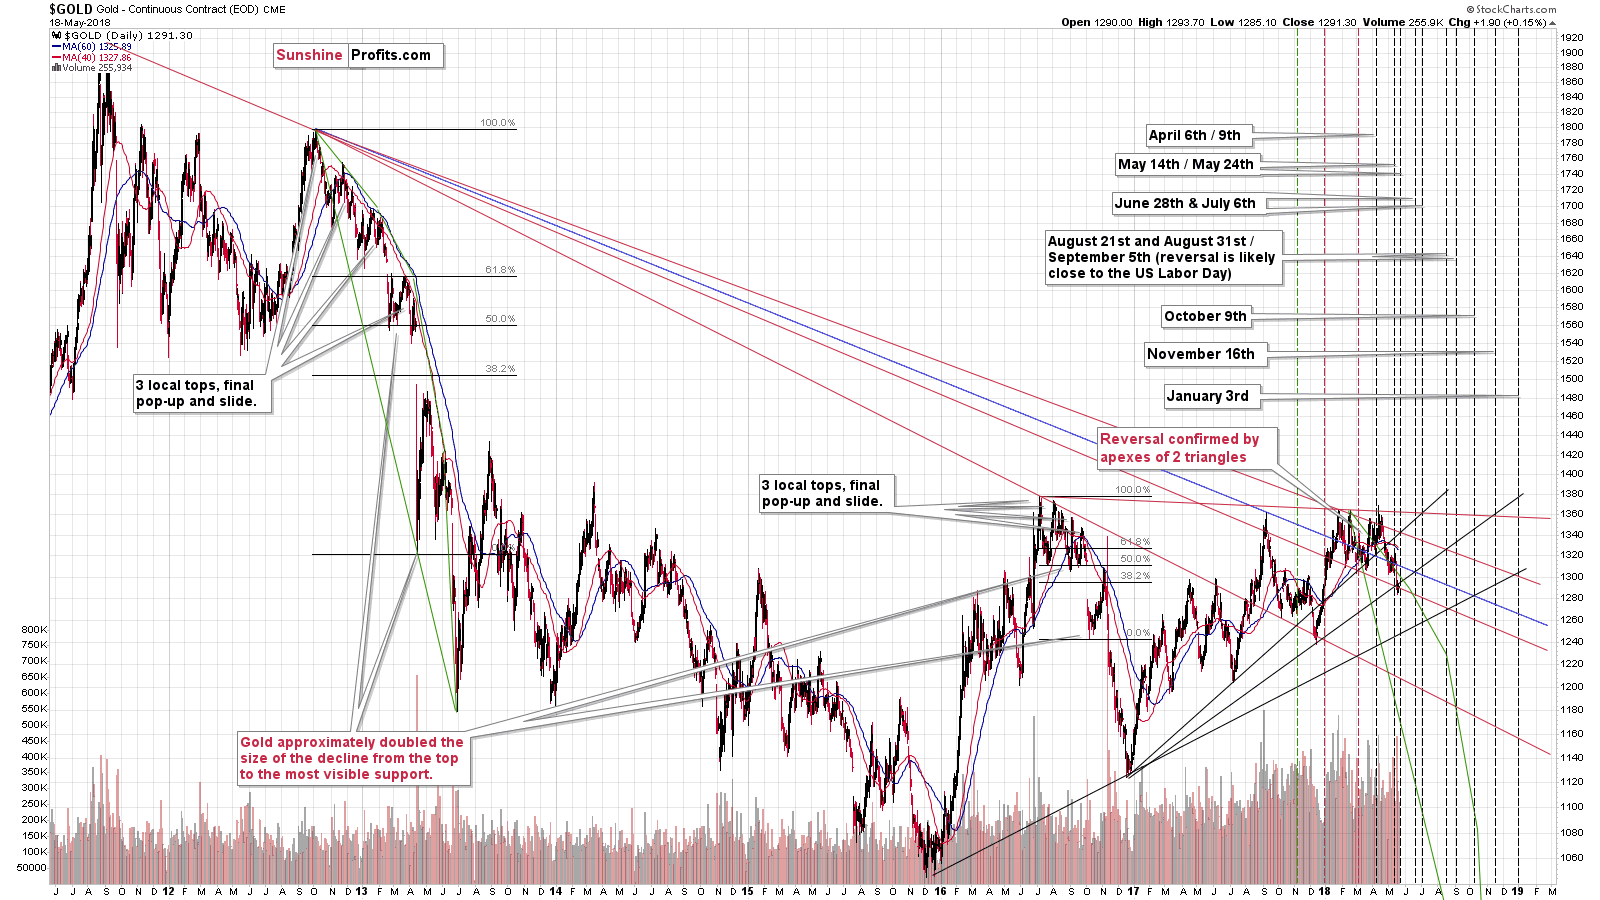
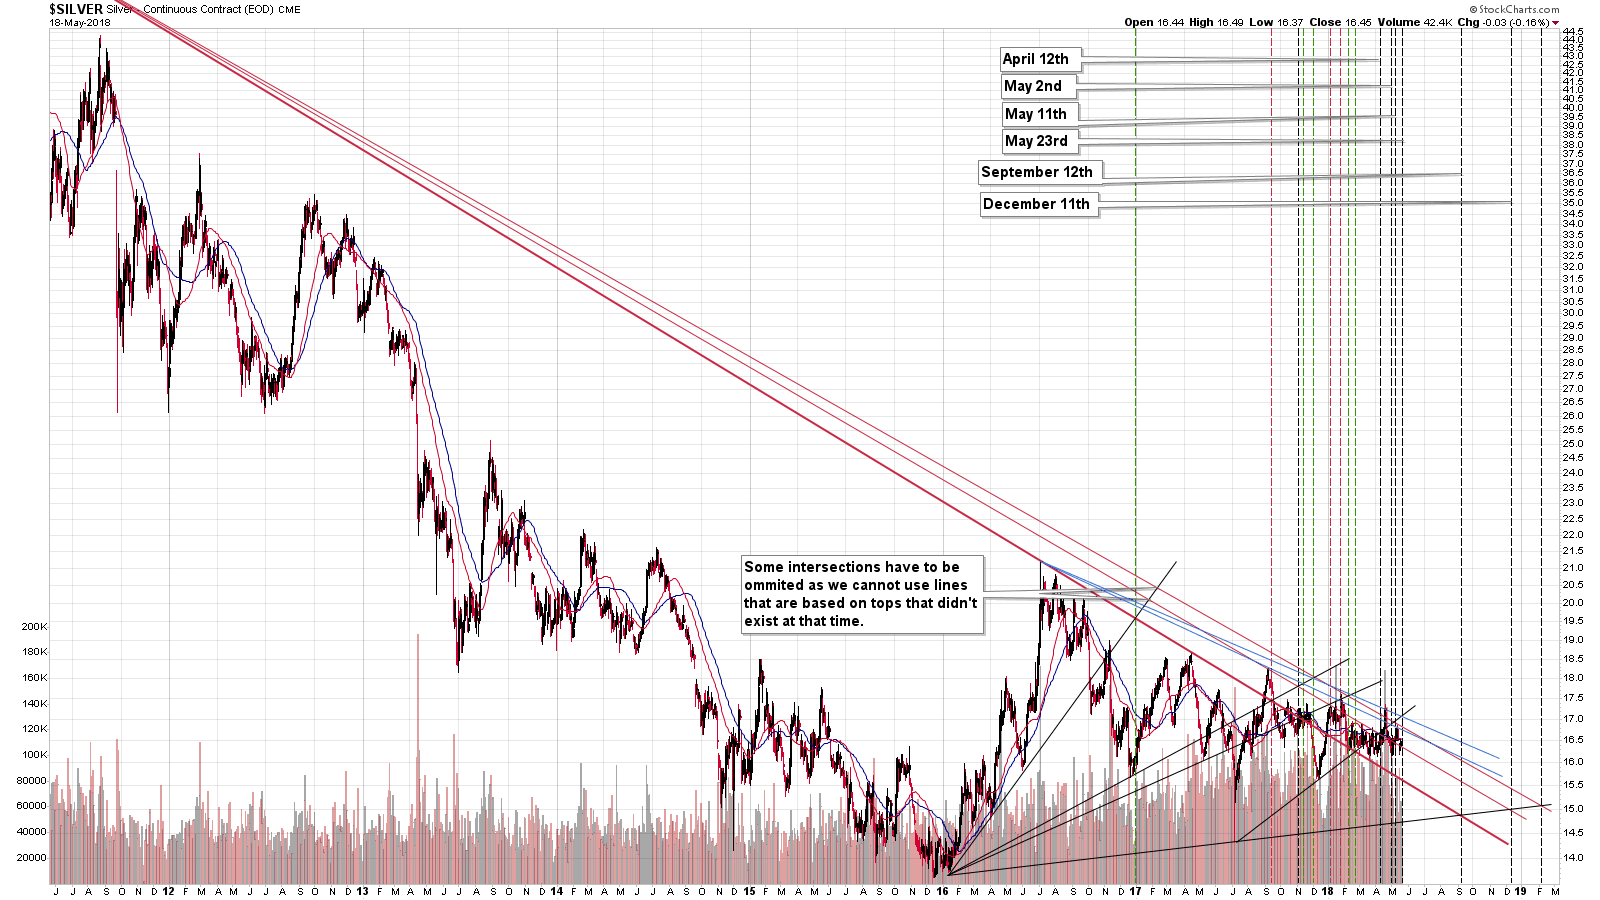
Based on gold, we can expect the reversal on Thursday and based on silver, we can expect it on Wednesday. This technique works on a near-to basis, but the last time when we had a triple reversal, it worked with near-perfect accuracy, so we may expect a bigger reversal in the middle of the week.
Naturally, a reversal means that there has to be a move that is to be reversed, so the question is what kind of price swing we’ll see beforehand.
Based on multiple signs and today’s pre-market action, it seems that it’s going to a be a decline.
Gold’s Breakdown

At the moment of writing these words, gold is already below $1,283, but the that’s just a confirmation of was already likely several days ago. Gold broke below the rising medium-term support line that’s based on the daily closing prices (upper of the red lines on the above chart) and verified this breakdown by closing below it for 3 consecutive trading days. The implications were clearly bearish, so today’s decline is a rather natural course of action.
Silver’s Outperformance

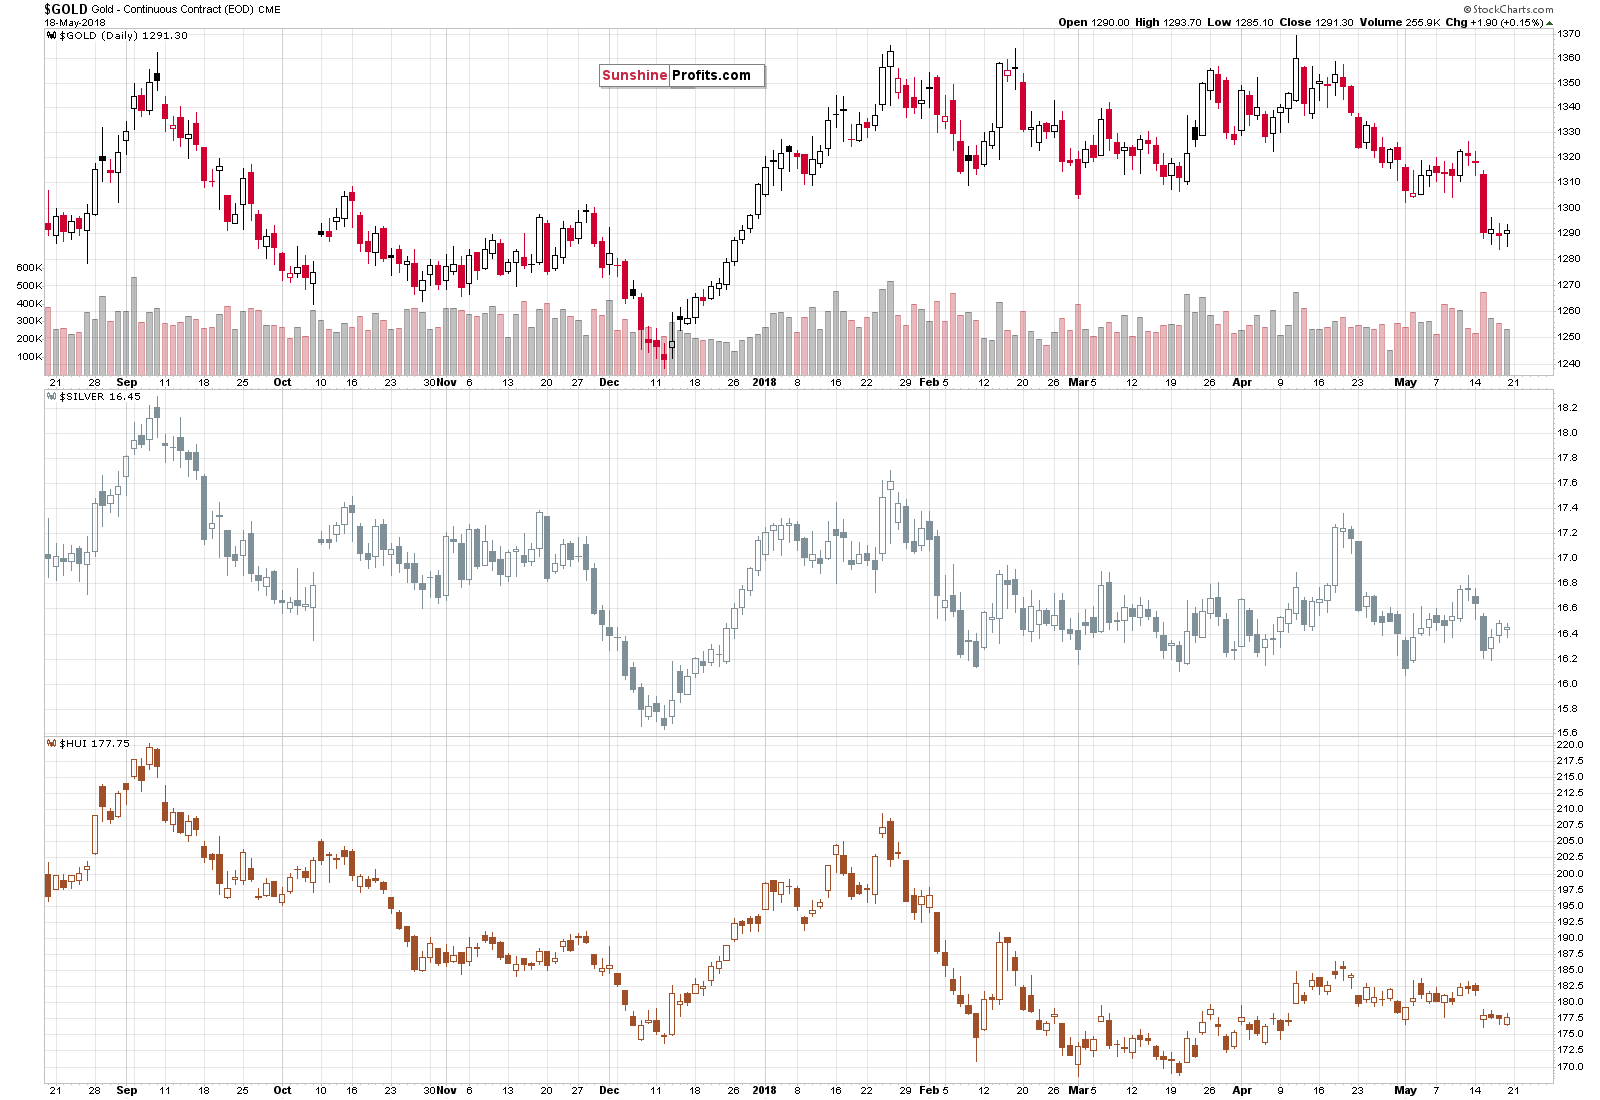
Another confirmation came from the silver market as the latter outperformed gold and mining stocks in a very visible way. Both above charts show that silver moved higher last week, but gold and miners didn’t, which is a classic performance of the precious metals market right before declines.
Breakout and Breakdown – More Than Confirmed
The additional bearish confirmations come from the USD and GDX charts.
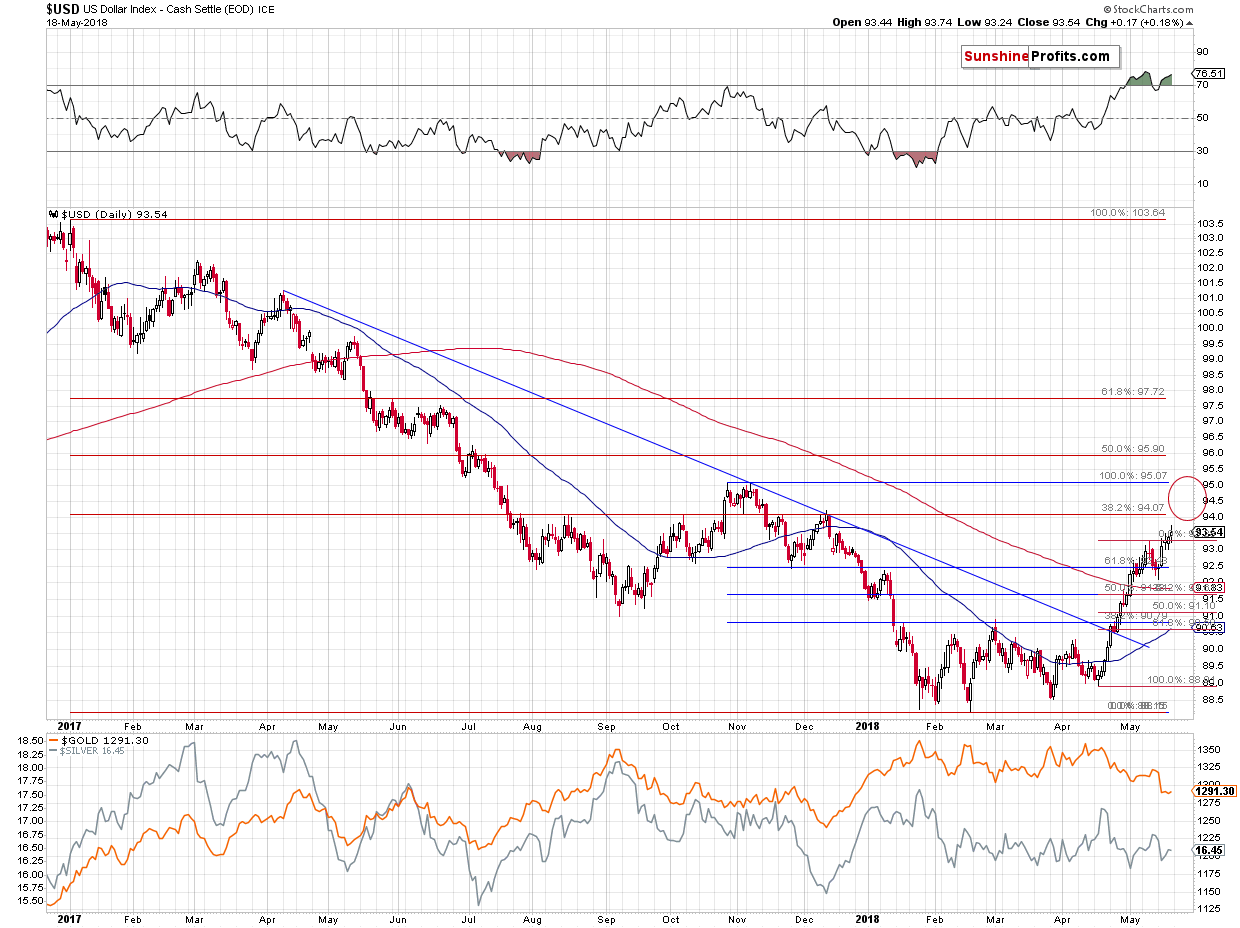
The USD Index broke to new 2018 highs and confirmed this breakout. The new upside targets are 0.5 and 1.5 index point away at about 94 and 95, respectively. One of them might correspond to a reversal in the precious metals market, so while we’ll use the apex-based turning points in order to detect the likely turnarounds, the signals from the USD Index might serve as a confirmation.
So, if the USDX is close to 94 or 95 on Wednesday or Thursday, it’s likely to confirm the reversal. The problem with this technique is that after today’s pre-market upswing, the USD Index is already very close to the 94 level. Consequently, if the scenario in which metals and miners reverse in 2-3 days is to be upheld, we could either have PMs declining without the USD’s help or we could see an additional increase in the USD’s value with a final short-term top around the 95 level. At this point it’s not clear which of these options is more probable, but it should become clearer later today or tomorrow.
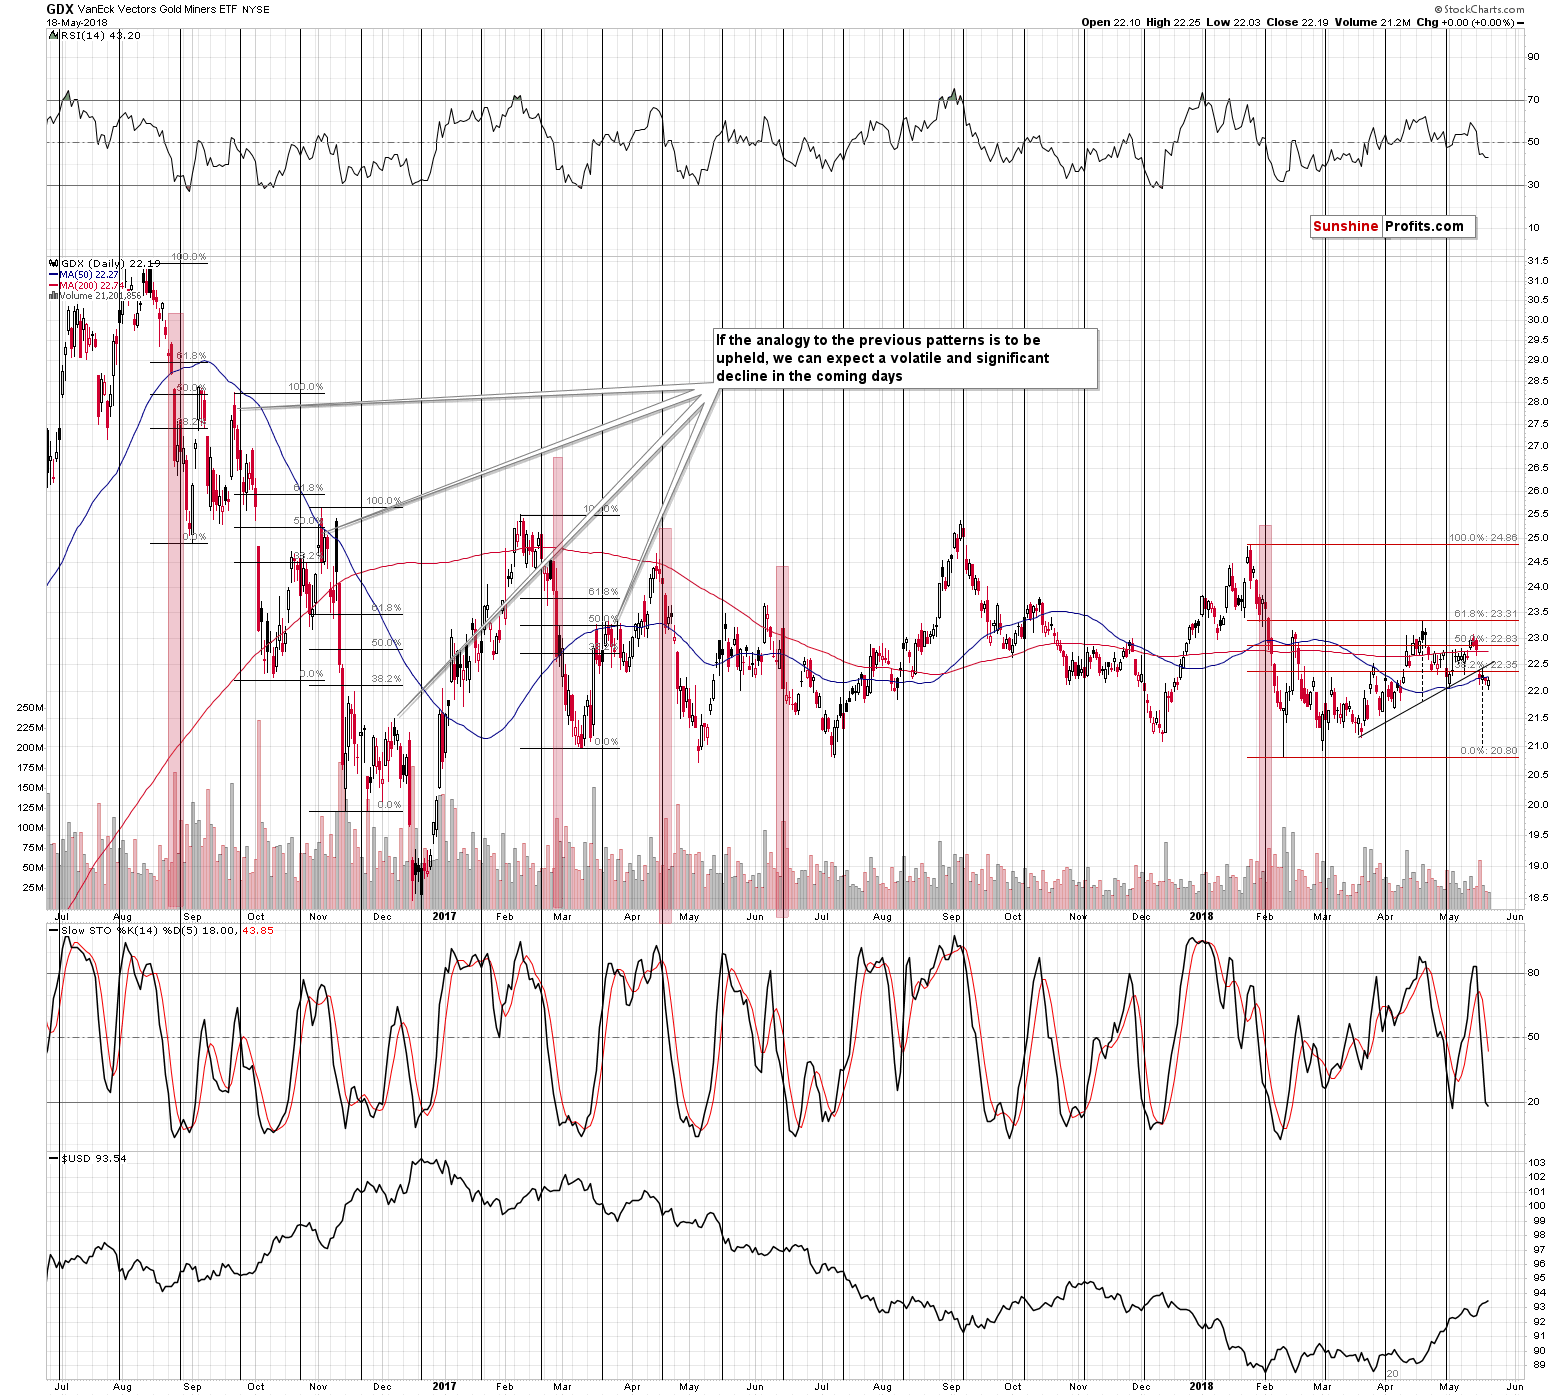
The breakdown in mining stocks is more than confirmed and while some may say that Friday’s intraday reversal invalidates the bearish picture, it’s not really the case.
The reason is that the volume that accompanied the “reversal” was weak. True reversals work because they show how buying power overcomes the selling pressure and take the price back up before the end of the day. In other words, it’s about showing who won a fierce battle. The volume confirms that this was indeed the case. If the volume is low, it means that there was no fierce battle, and thus no major victory. Therefore, there are no important implications.
Consequently, Friday’s session didn’t have bullish implications – it was yet another session during which mining stocks didn’t manage to invalidate the breakdown below the rising neck level of the bearish head-and-shoulders pattern and the 61.8% Fibonacci retracement level.
In Friday’s alert, we featured the specific game plan for this week and since it remains up-to-date, it seems worth including it also in today’s analysis.
Game Plan and Nearby Downside Targets
We previously discussed how low gold, silver, and mining stocks might decline, but we’d like to provide you with a more detailed game plan before the end of the week.
As you read previously, the precious metals sector could reverse temporarily next week on Wednesday or Thursday based on gold and silver’s apex-based turning points. These turning points provided to be extremely useful once again only a few days ago, so we should definitely pay attention to those signals.
But, how low can gold, silver and miners move next week?
Before continuing, we’d like to emphasize that this is what seems most likely at this time, but we are not discarding other possibilities. It’s more important to stay flexible when the new developments emerge than to stick to one’s original scenario – and we will. Still, there are 2 things that seem more likely than the other outcomes.
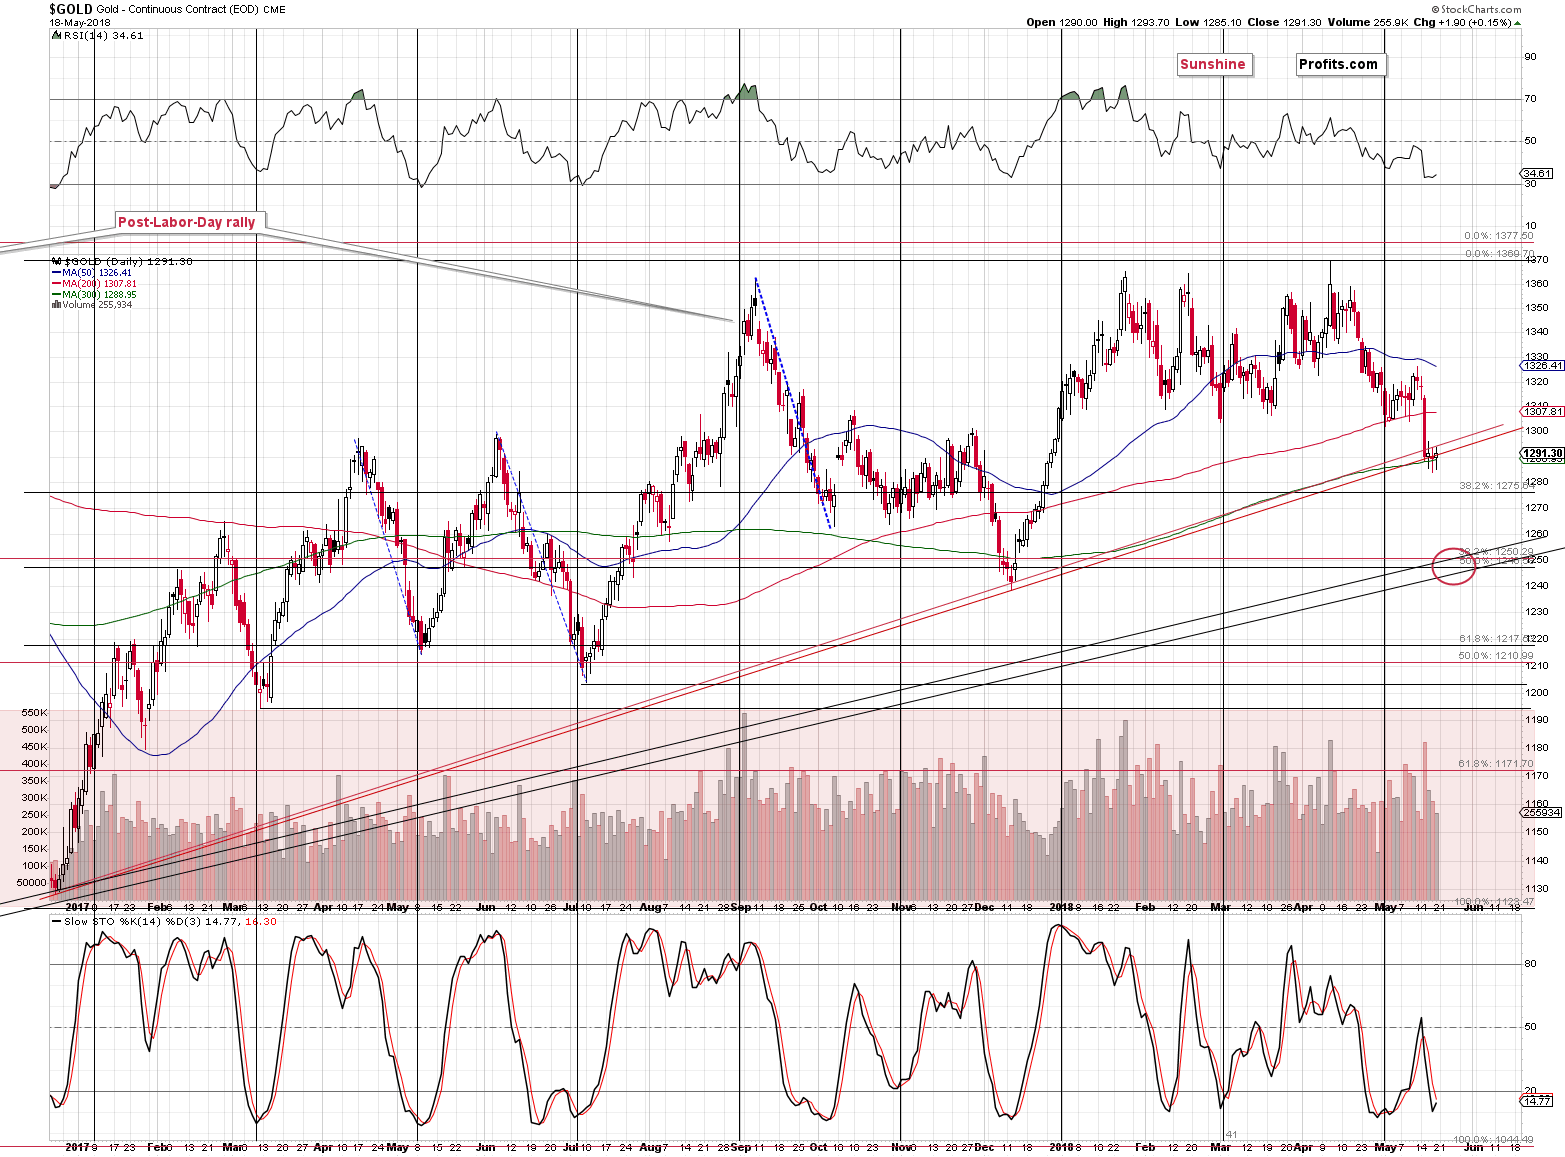
The first one is gold bouncing from the $1,250 level or its proximity. There was no meaningful correction from the currently-tested rising support line, which makes it more likely that the next strong support will indeed manage to generate one. After all, no market can move up or down without periodic corrections.
Why $1,250? Because of several reasons:
- Long-term support line based on the December 2015 and December 2016 highs. When based on the closing prices, this line is a bit above $1,250, and when based on the intraday lows, this line is a bit below $1,250. Consequently, it seems likely that we’ll see a move below $1,250 on an intraday basis, but a close back above it. This intraday prediction is not very precise, yet that’s an outcome that appears more likely than other events.
- The 38.2% Fibonacci retracement level based on the 2015 – 2016 rally is at $1,250.
- The 50% Fibonacci retracement level based on the 2016 – 2018 rally is just a few dollars below $1,250.
- The previous short-term decline ended a few dollars below $1,250 in December 2017.
- The RSI indicator is at 33, and a move below 30 corresponded to local bottoms many times in the past. A move to $1,250 seems to be enough to make the RSI move below 30.
- The current situation is similar to what happened in early October 2016, when gold moved lower after topping for several months and forming many local tops. Gold has been topping most of this year, forming many local tops. In both 2016 and 2018 gold topped close to $1,370 and the initial local bottoms were formed a bit above $1,300. When gold finally broke below $1,300, it bounced only after reaching $1,250. Interestingly, it moved below this level on an intraday basis and closed the session back above it, just like the support lines (Point 1) are currently suggesting.
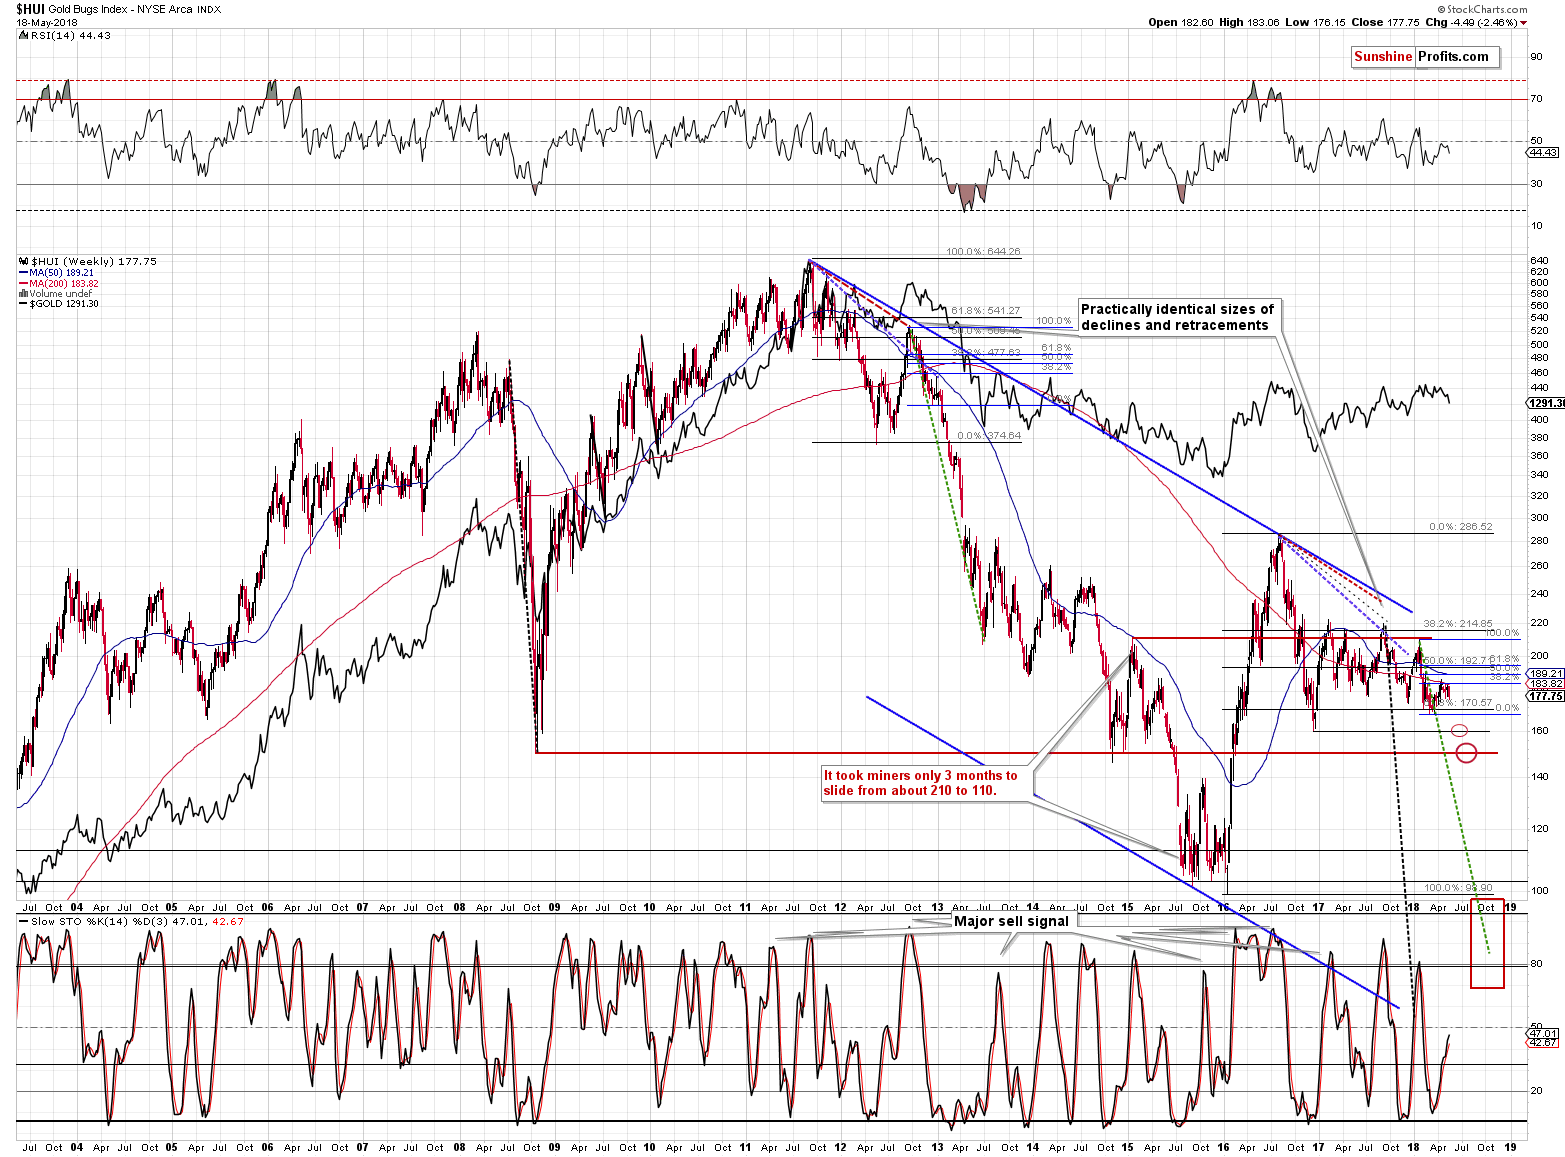
In the case of the HUI Index, there are several support targets: the 2018 low, 160, 150, and the 110-100 area. Which of them will be hit next week? The 2018 low seems most likely, but if it’s already breached when gold is still well above $1,250, then we might see a move even to 160.
Naturally, the latter is not very likely and the move to the 2018 low next week is, but we wanted to explain how one can get the reversal prices without knowing them in advance, based on other markets. The first step is to establish the support levels and then to check which of them is nearby when a more reliable target level in a corresponding market is being reached.
This technique will be heavily used in the case of silver as the white metal provides us with even fewer details than the HUI Index chart.
The long-term silver chart doesn’t provide any precise targets that are nearby, and the ones seen on the short-term chart are rather unclear.
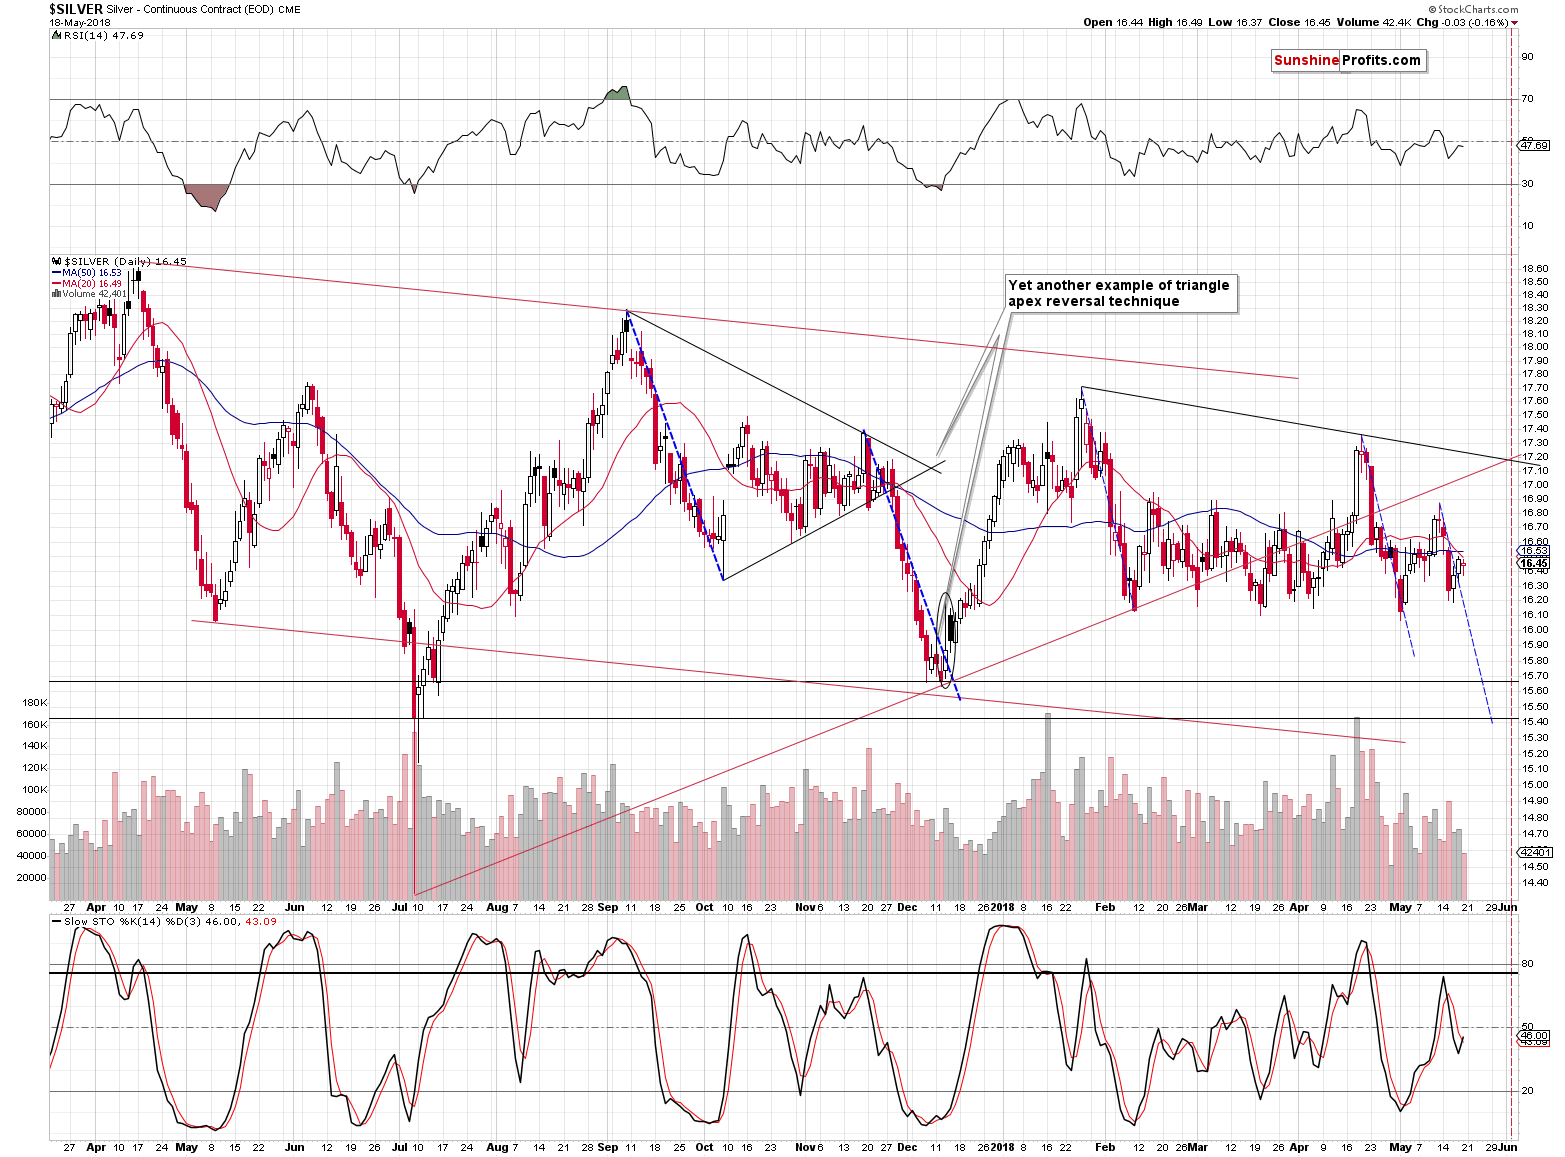
The closest support is provided by the February, March and May lows, but it seems that if gold moves significantly lower, silver will decline more than to just this month’s low. The next support is provided by the December 2017 low (at about $15.60 - $15.70), which seems to be the most likely target for next week’s bottom.
Why is the silver case rather unclear? Because the December 2017 bottom may be a bit too low given silver’s recent strength, or it may be too high given silver’s crazy volatility at times. If we had multiple additional signs pointing to the same target, like it is the case with gold, this target would be stronger. But we don’t, so it seems best to focus on gold, where the situation seems to be the clearest and to use the fact that gold, silver and mining stocks tend to form short-term bottoms at the same time.
Summary
Summing up, based on the apex-based reversals, True Seasonal patterns for gold, silver and mining stocks, USDX’s breakout, GDX’s breakdown and silver’s Wednesday’s and Thursday’s outperformance, it seems that the local top is already in and that we can expect a sharp decline in the coming days and weeks.
Based on the nearby apex-based reversals in gold and silver, we might expect a turnaround this week on Wednesday or Thursday. It seems likely that gold will reverse close to $1,250, while GDX moves to $21 and silver slides to about $15.60 - $15.70, but of the above only gold’s price target is confirmed by multiple techniques, so it seems best to focus on this particular market when timing the next week’s bottom in the rest of the precious metals sector.
As always, we will keep you – our subscribers – informed.
To summarize:
Trading capital (supplementary part of the portfolio; our opinion): Full short positions (200% of the full position) in gold, silver and mining stocks are justified from the risk/reward perspective with the following stop-loss orders and initial target price levels:
- Gold: initial target price: $1,251; stop-loss: $1,382; initial target price for the DGLD ETN: $48.88; stop-loss for the DGLD ETN $37.48
- Silver: initial target price: $15.73; stop-loss: $18.06; initial target price for the DSLV ETN: $27.58; stop-loss for the DSLV ETN $19.17
- Mining stocks (price levels for the GDX ETF): initial target price: $21.03; stop-loss: $23.54; initial target price for the DUST ETF: $28.88; stop-loss for the DUST ETF $21.16
In case one wants to bet on junior mining stocks' prices (we do not suggest doing so – we think senior mining stocks are more predictable in the case of short-term trades – if one wants to do it anyway, we provide the details), here are the stop-loss details and initial target prices:
- GDXJ ETF: initial target price: $30.62; stop-loss: $36.14
- JDST ETF: initial target price: $59.68 stop-loss: $40.86
Long-term capital (core part of the portfolio; our opinion): No positions (in other words: cash)
Insurance capital (core part of the portfolio; our opinion): Full position
Important Details for New Subscribers
Whether you already subscribed or not, we encourage you to find out how to make the most of our alerts and read our replies to the most common alert-and-gold-trading-related-questions.
Please note that the in the trading section we describe the situation for the day that the alert is posted. In other words, it we are writing about a speculative position, it means that it is up-to-date on the day it was posted. We are also featuring the initial target prices, so that you can decide whether keeping a position on a given day is something that is in tune with your approach (some moves are too small for medium-term traders and some might appear too big for day-traders).
Plus, you might want to read why our stop-loss orders are usually relatively far from the current price.
Please note that a full position doesn’t mean using all of the capital for a given trade. You will find details on our thoughts on gold portfolio structuring in the Key Insights section on our website.
As a reminder – “initial target price” means exactly that – an “initial” one, it’s not a price level at which we suggest closing positions. If this becomes the case (like it did in the previous trade) we will refer to these levels as levels of exit orders (exactly as we’ve done previously). Stop-loss levels, however, are naturally not “initial”, but something that, in our opinion, might be entered as an order.
Since it is impossible to synchronize target prices and stop-loss levels for all the ETFs and ETNs with the main markets that we provide these levels for (gold, silver and mining stocks – the GDX ETF), the stop-loss levels and target prices for other ETNs and ETF (among other: UGLD, DGLD, USLV, DSLV, NUGT, DUST, JNUG, JDST) are provided as supplementary, and not as “final”. This means that if a stop-loss or a target level is reached for any of the “additional instruments” (DGLD for instance), but not for the “main instrument” (gold in this case), we will view positions in both gold and DGLD as still open and the stop-loss for DGLD would have to be moved lower. On the other hand, if gold moves to a stop-loss level but DGLD doesn’t, then we will view both positions (in gold and DGLD) as closed. In other words, since it’s not possible to be 100% certain that each related instrument moves to a given level when the underlying instrument does, we can’t provide levels that would be binding. The levels that we do provide are our best estimate of the levels that will correspond to the levels in the underlying assets, but it will be the underlying assets that one will need to focus on regarding the signs pointing to closing a given position or keeping it open. We might adjust the levels in the “additional instruments” without adjusting the levels in the “main instruments”, which will simply mean that we have improved our estimation of these levels, not that we changed our outlook on the markets. We are already working on a tool that would update these levels on a daily basis for the most popular ETFs, ETNs and individual mining stocks.
Our preferred ways to invest in and to trade gold along with the reasoning can be found in the how to buy gold section. Additionally, our preferred ETFs and ETNs can be found in our Gold & Silver ETF Ranking.
As a reminder, Gold & Silver Trading Alerts are posted before or on each trading day (we usually post them before the opening bell, but we don't promise doing that each day). If there's anything urgent, we will send you an additional small alert before posting the main one.
=====
Hand-picked precious-metals-related links:
PRECIOUS-Gold hits 5-month low as U.S. trade war with China 'on hold'
=====
In other news:
Stocks, oil and dollar rise as trade war put 'on hold'
Japan PM Abe: BOJ is guiding policy appropriately
Pound Slides to This Year's Low as Brexit to Italy Risks Weigh
Italy’s policies make sense – it’s eurozone rules that are absurd
=====
Thank you.
Sincerely,
Przemyslaw Radomski, CFA
Founder, Editor-in-chief, Gold & Silver Fund Manager
Gold & Silver Trading Alerts
Forex Trading Alerts
Oil Investment Updates
Oil Trading Alerts

