

Briefly: In our opinion, no speculative short positions in gold, silver and mining stocks are justified from the risk/reward perspective at the moment of publishing this alert. In other words, we think that taking profits off the table yesterday was a good idea.
Gold’s price didn’t change much during yesterday’s session in terms of the closing prices. However, the shape of the session is meaningful as both metals declined initially, but reversed and came back before the closing bell. The reversal in the GLD ETF took place on big volume. Did we just see a confirmation that the bottom is in?
This might have been the case, although it is critical to emphasize that the bottom that we might have seen is just a local and temporary one. Based on our analysis, it’s not THE bottom - it’s not even close to it. A short-term corrective upswing may follow here, but nothing more seems to be in the cards. Whether gold moves up or not, we expect the big downtrend to resume before the end of the year.
Let’s take a look at the charts for details, starting with gold (chart courtesy of http://stockcharts.com).
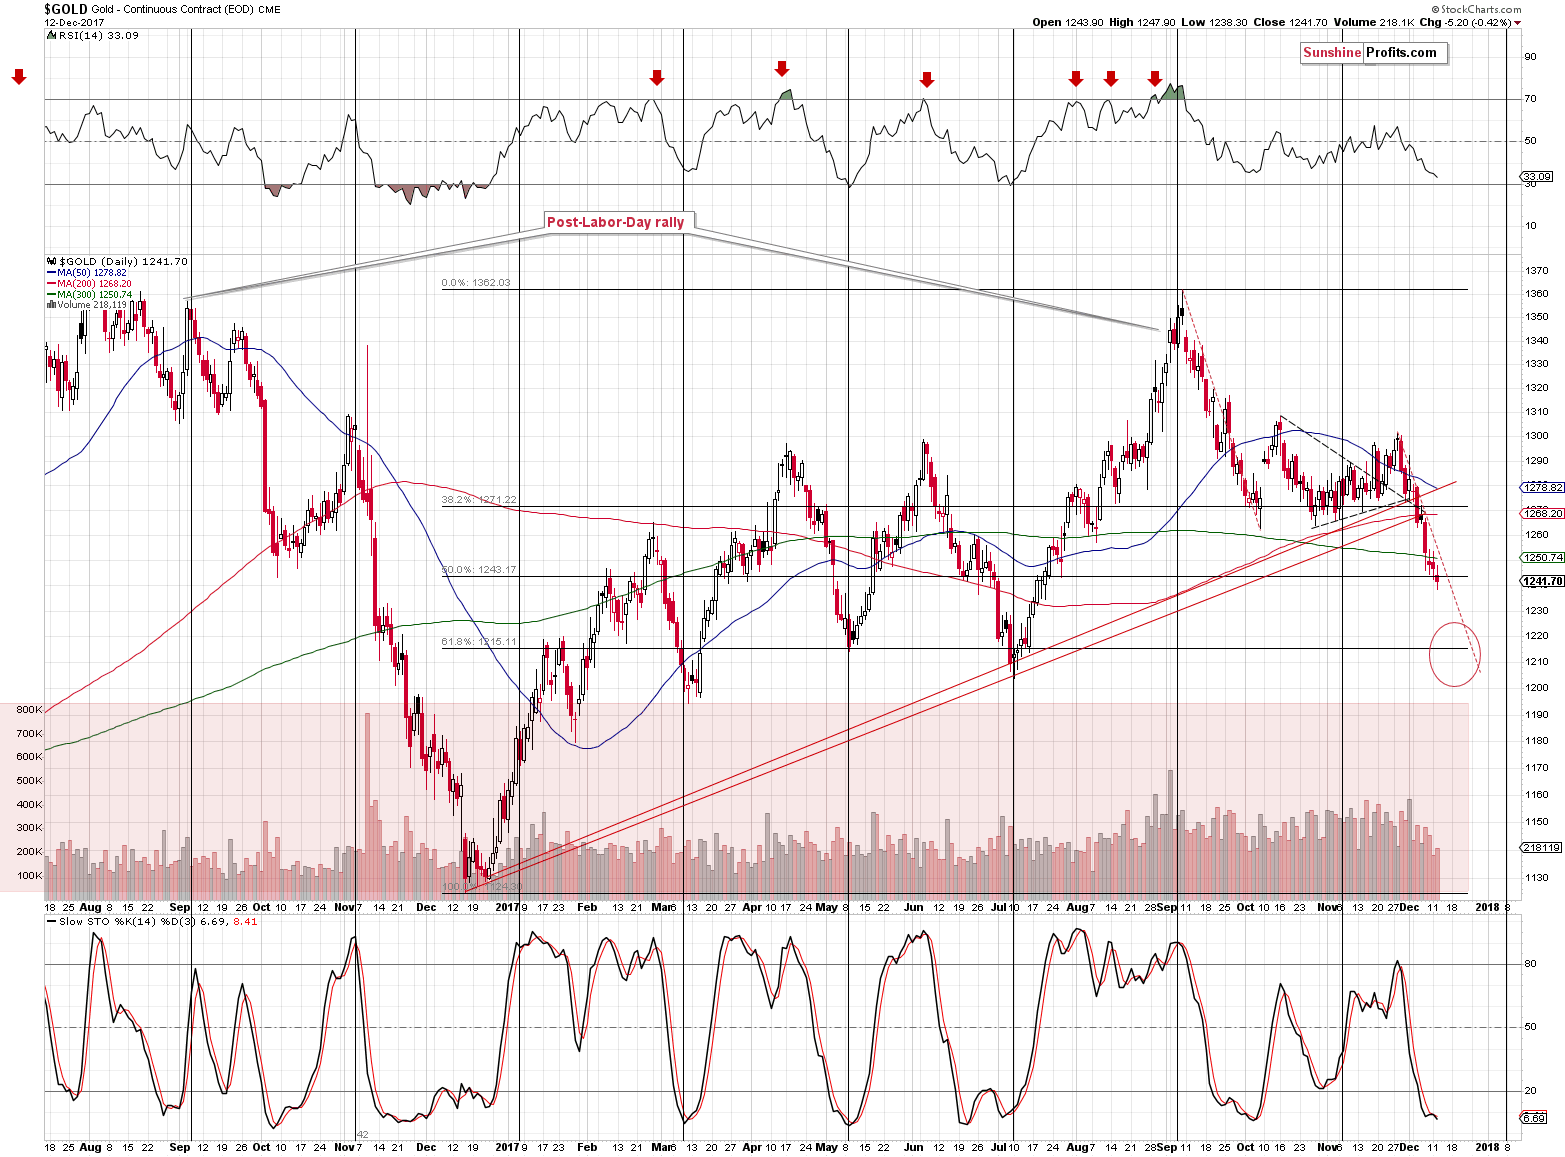
Gold futures moved lower on low volume, which suggests that the move might not have been the true direction in which the market currently wants to go. Moreover, this kind of performance is not confirmed by the GLD ETF and the intraday chart from kitco.com.
On the above chart, we see that the closing price for the day was about $3 higher than Monday’s close.
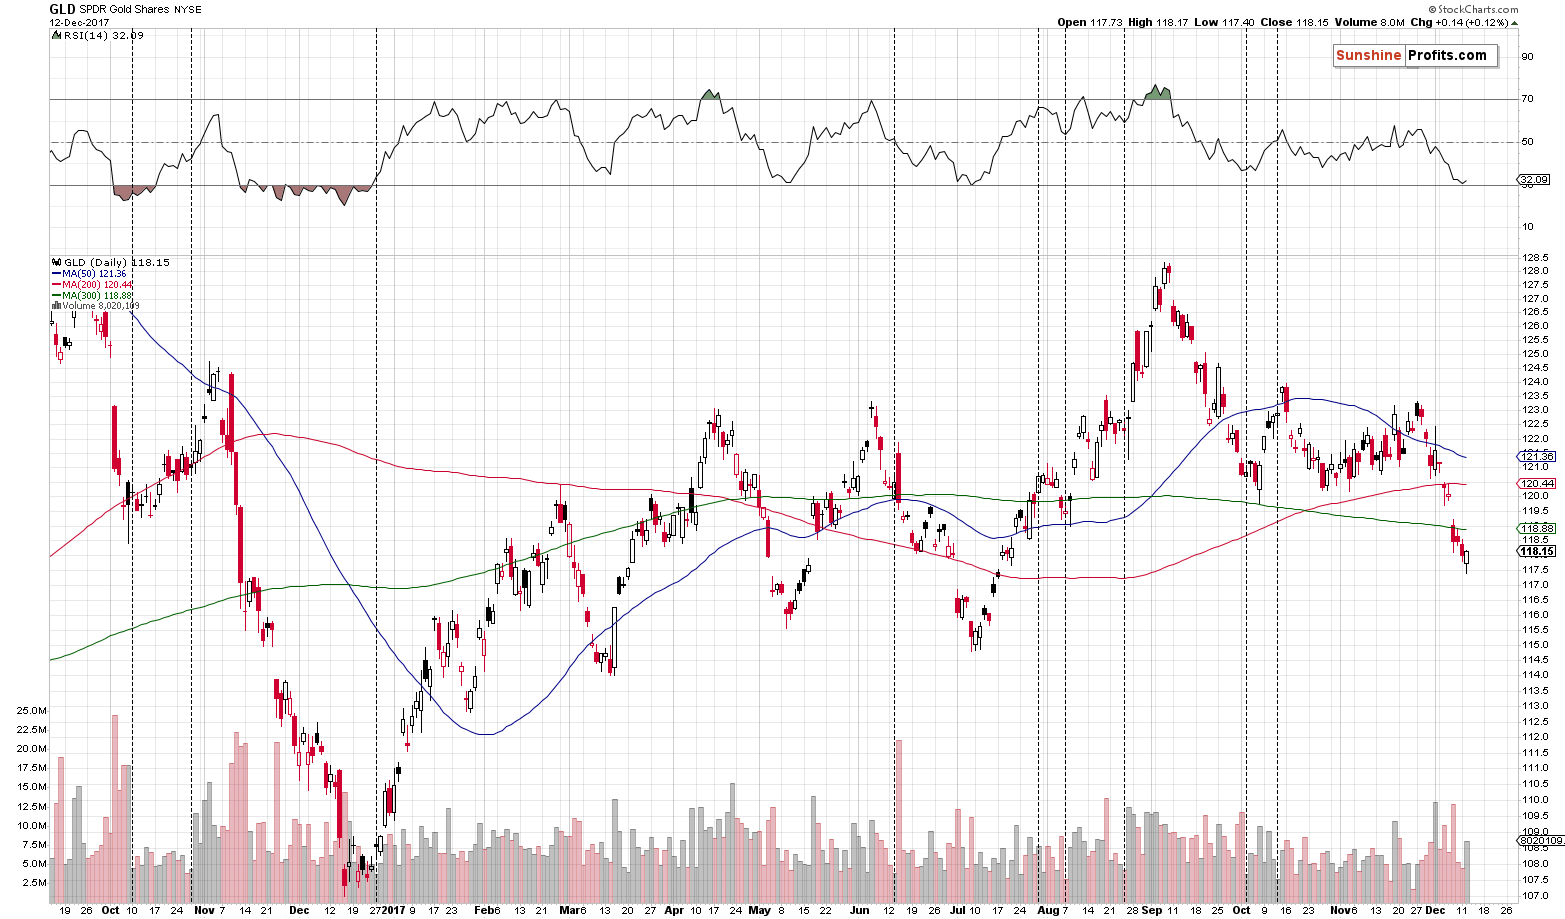
The GLD chart additionally shows that the volume that accompanied the reversal in the ETF was high, which has bullish implications. In fact, yesterday’s session appears similar to the one that we saw in early October before the weekly corrective upswing.
If gold moves higher, how high can it go?
Our best estimation at this time is the $1,270 level – the lower of the rising support lines that recently turned into resistance and the first Fibonacci retracement level. By moving to $1,270 and turning south, gold would simply verify the breakdown and make subsequent declines even more likely.
In the case of silver, the volume once again provides key details. In yesterday’s alert, we wrote the following:
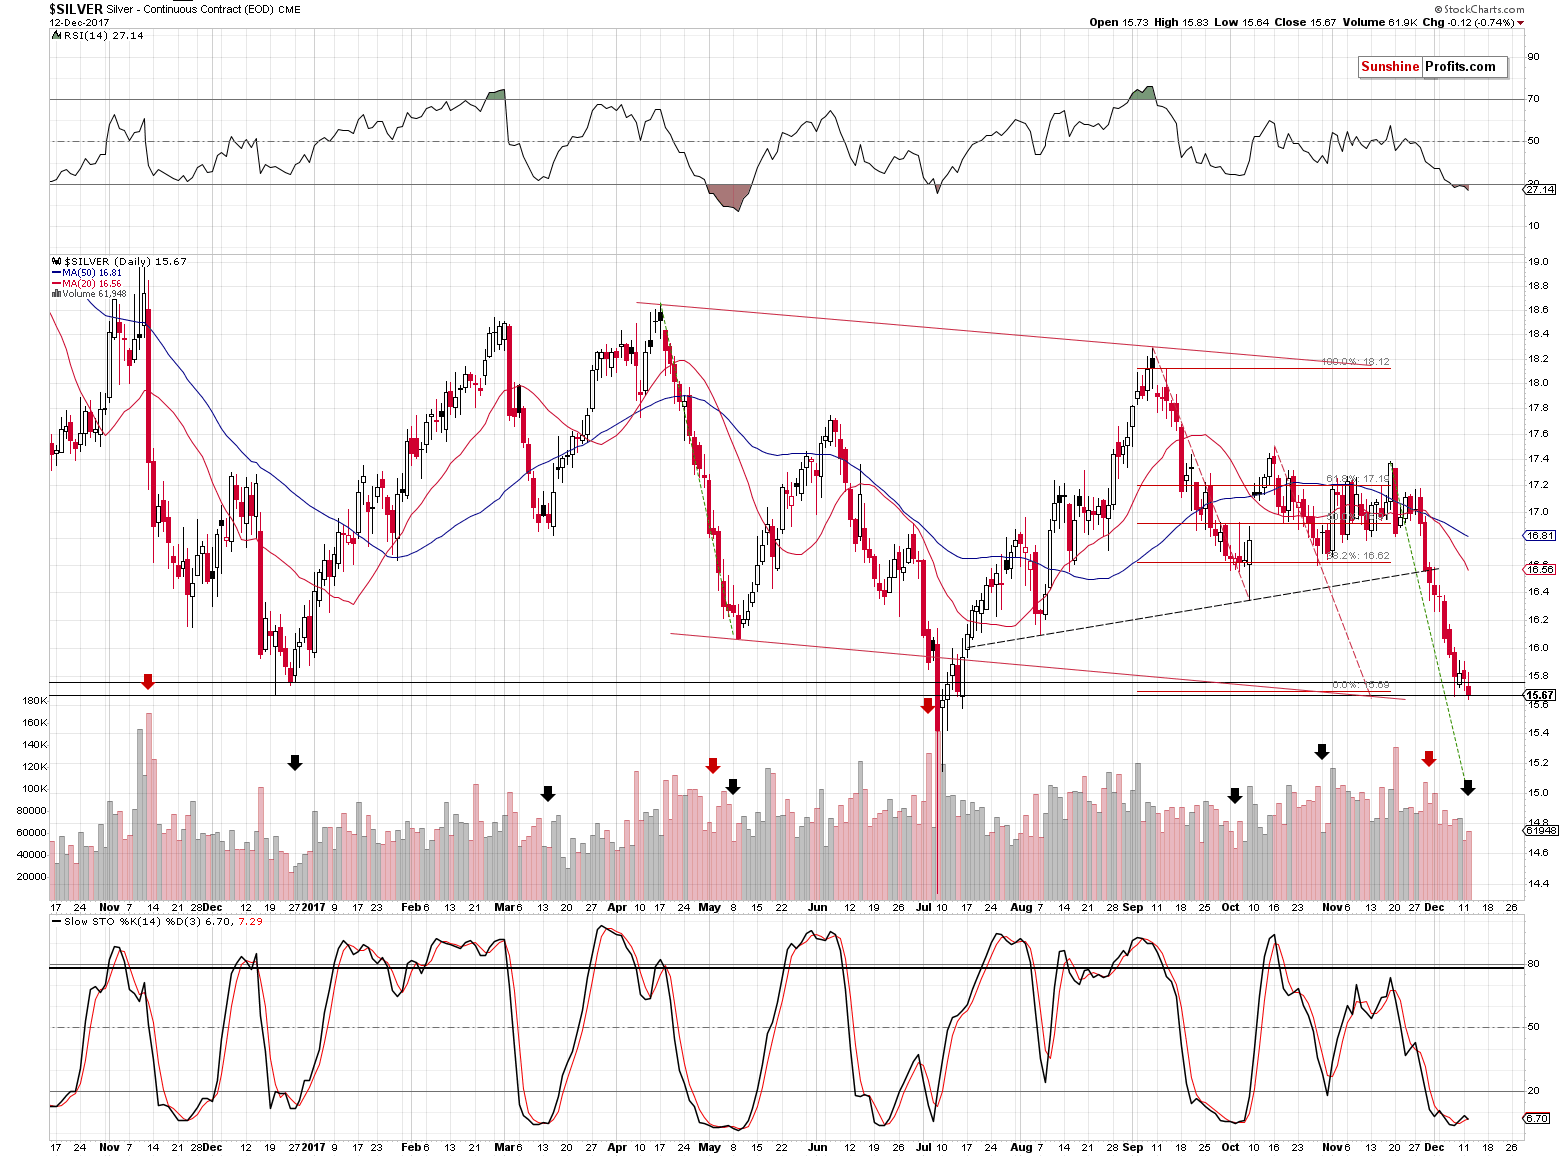
Gold and silver have indeed declined, but the volume that accompanied the session was relatively low in both cases. With the exception of the July bottom in silver, the white metal used to bottom on low volume in the most recent months. The December 2016 bottom, March 2017 bottom, May 2017 bottom, and early October 2017 bottoms were all accompanied by low volume. There were all confirmed by buy signals from the Stochastic indicator as well and we just saw the same thing.
With RSI below 30, the above bullish indications should not be ignored.
Just like it’s the case with gold, in terms of kitco’s closing prices silver moved a bit higher, but in the case of the above silver futures chart, we see a daily decline and a breakdown below the December 2016 low in terms of the closing prices.
The breakdown in silver seems like a very bearish development, but is it really one? Not necessarily, because practically all real breakdowns in silver were confirmed by big volume and the bottoms were accompanied by low volume (the July low was the only exception). We marked those situations on the silver chart with arrows. Red arrows are high-volume breakdowns and black arrows point out the low-volume bottoms. Since yesterday’s move in silver futures was accompanied by relatively low volume, it seems to be a fake move and actually a bullish sign.
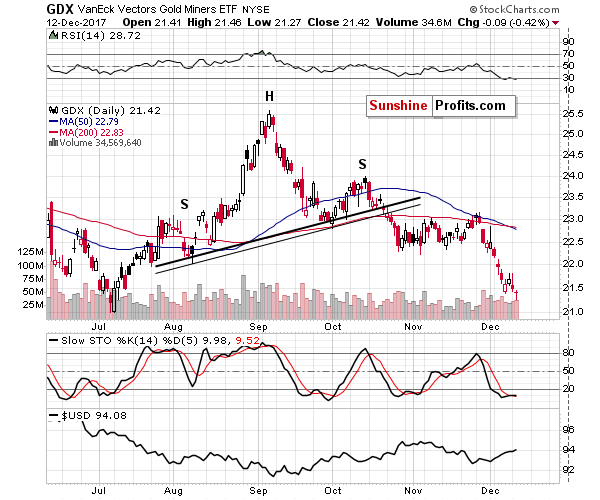
While the short-term indications on the gold and silver charts support higher prices in the coming days, the mining stock chart has a more neutral character. Miners reversed, just like gold and silver did, but they didn’t close higher and they certainly didn’t show strength relative to gold. If they had, we would probably be opening small long positions today, but without this bullish sign, the outlook still seems too neutral to justify that.
The above, plus the fact that the interest rate announcement is likely to trigger intraday volatility is something that makes us view holding an open trading position quite risky. If we see meaningful confirmations before the interest rate decision (or shortly thereafter), we will send out another alert with details, but at this time it doesn’t seem that any changes to our speculative positions (that is, no positions) are justified.
Either way, the medium-term trend remains down.
As always, we’ll keep you – our subscribers – informed.
To summarize:
Trading capital (supplementary part of the portfolio; our opinion): No positions (in other words: cash, or positions in other markets, for instance crude oil, stocks, forex and/or bitcoin).
Long-term capital (core part of the portfolio; our opinion): No positions (in other words: cash)
Insurance capital (core part of the portfolio; our opinion): Full position
Important Details for New Subscribers
Whether you already subscribed or not, we encourage you to find out how to make the most of our alerts and read our replies to the most common alert-and-gold-trading-related-questions.
Please note that the in the trading section we describe the situation for the day that the alert is posted. In other words, it we are writing about a speculative position, it means that it is up-to-date on the day it was posted. We are also featuring the initial target prices, so that you can decide whether keeping a position on a given day is something that is in tune with your approach (some moves are too small for medium-term traders and some might appear too big for day-traders).
Plus, you might want to read why our stop-loss orders are usually relatively far from the current price.
Please note that a full position doesn’t mean using all of the capital for a given trade. You will find details on our thoughts on gold portfolio structuring in the Key Insights section on our website.
As a reminder – “initial target price” means exactly that – an “initial” one, it’s not a price level at which we suggest closing positions. If this becomes the case (like it did in the previous trade) we will refer to these levels as levels of exit orders (exactly as we’ve done previously). Stop-loss levels, however, are naturally not “initial”, but something that, in our opinion, might be entered as an order.
Since it is impossible to synchronize target prices and stop-loss levels for all the ETFs and ETNs with the main markets that we provide these levels for (gold, silver and mining stocks – the GDX ETF), the stop-loss levels and target prices for other ETNs and ETF (among other: UGLD, DGLD, USLV, DSLV, NUGT, DUST, JNUG, JDST) are provided as supplementary, and not as “final”. This means that if a stop-loss or a target level is reached for any of the “additional instruments” (DGLD for instance), but not for the “main instrument” (gold in this case), we will view positions in both gold and DGLD as still open and the stop-loss for DGLD would have to be moved lower. On the other hand, if gold moves to a stop-loss level but DGLD doesn’t, then we will view both positions (in gold and DGLD) as closed. In other words, since it’s not possible to be 100% certain that each related instrument moves to a given level when the underlying instrument does, we can’t provide levels that would be binding. The levels that we do provide are our best estimate of the levels that will correspond to the levels in the underlying assets, but it will be the underlying assets that one will need to focus on regarding the signs pointing to closing a given position or keeping it open. We might adjust the levels in the “additional instruments” without adjusting the levels in the “main instruments”, which will simply mean that we have improved our estimation of these levels, not that we changed our outlook on the markets. We are already working on a tool that would update these levels on a daily basis for the most popular ETFs, ETNs and individual mining stocks.
Our preferred ways to invest in and to trade gold along with the reasoning can be found in the how to buy gold section. Additionally, our preferred ETFs and ETNs can be found in our Gold & Silver ETF Ranking.
As a reminder, Gold & Silver Trading Alerts are posted before or on each trading day (we usually post them before the opening bell, but we don't promise doing that each day). If there's anything urgent, we will send you an additional small alert before posting the main one.
=====
Latest Free Trading Alerts:
Democrats won a fight for the U.S. Senate seat in Alabama. What does it mean for the gold market?
Alabama Election, FOMC Meeting and Gold
=====
Hand-picked precious-metals-related links:
PRECIOUS-Gold holds near 5-month low ahead of Fed meeting outcome
Gold traders are ‘jaded’ to global fears ahead of expected fed hike
=====
In other news:
Shares eye record high as Fed heads for hat-trick
Fed 2018 Dots in Focus for Yellen Swan Song: Decision Day Guide
Stocks Struggle Ahead of Fed Meeting; Bonds Fall: Markets Wrap
Traders See No End to the Dollar’s Pain in 2018
ECB set to lift its growth outlook as massive bond-buying slowly winds down
Bank of England to meet amid UK inflation surge: What to look out for
Looking to sell bitcoin? It's complicated
Cboe trades 4,127 bitcoin conracts first day
World Bank to stop funding oil and gas projects
=====
Thank you.
Sincerely,
Przemyslaw Radomski, CFA
Founder, Editor-in-chief, Gold & Silver Fund Manager
Gold & Silver Trading Alerts
Forex Trading Alerts
Oil Investment Updates
Oil Trading Alerts

