

Briefly: In our opinion, full (200% of the regular size of the position) speculative short positions in gold, silver and mining stocks are justified from the risk/reward perspective at the moment of publishing this alert.
The mining stocks declined in their usual way yesterday, but there’s little else that they could do in light of a big slide on the general stock market. However, gold and silver moved higher, and the shape of yesterday’s session might appear as a reversal to some. Did we really see one? There’s one reliable factor that can help us determine it.
It’s the volume.
Let’s take a look at the charts for details (chart courtesy of http://stockcharts.com).
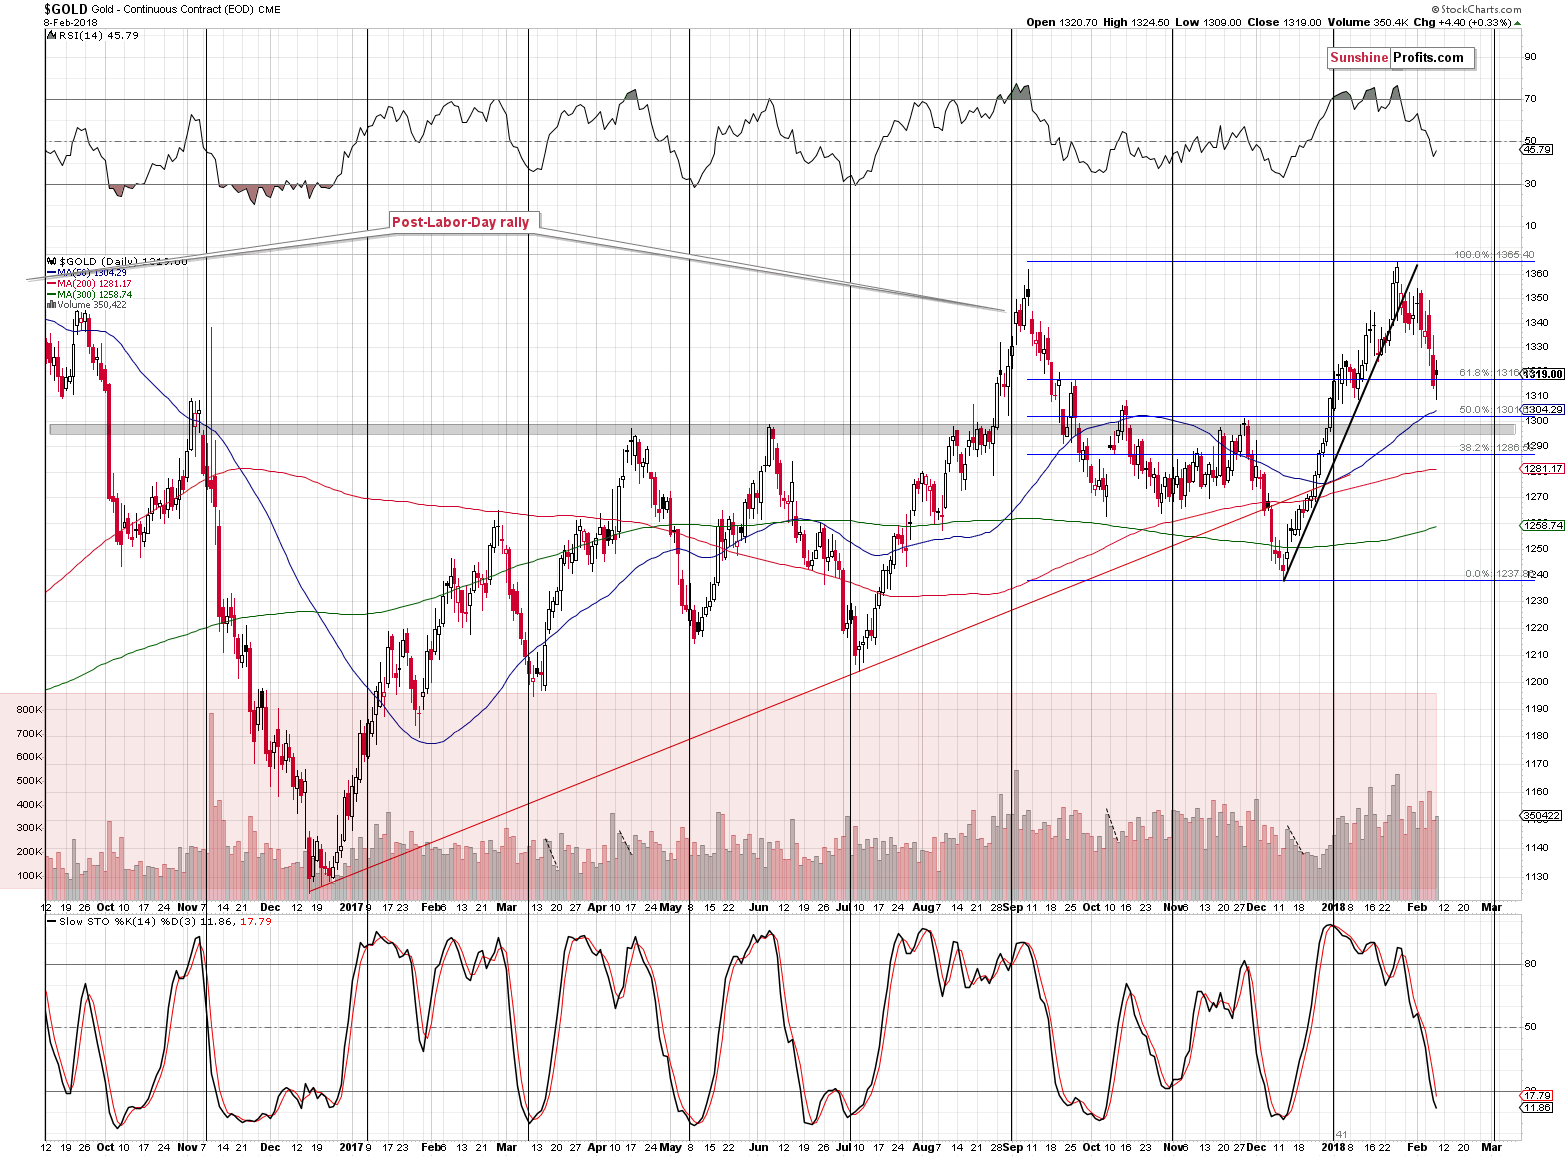
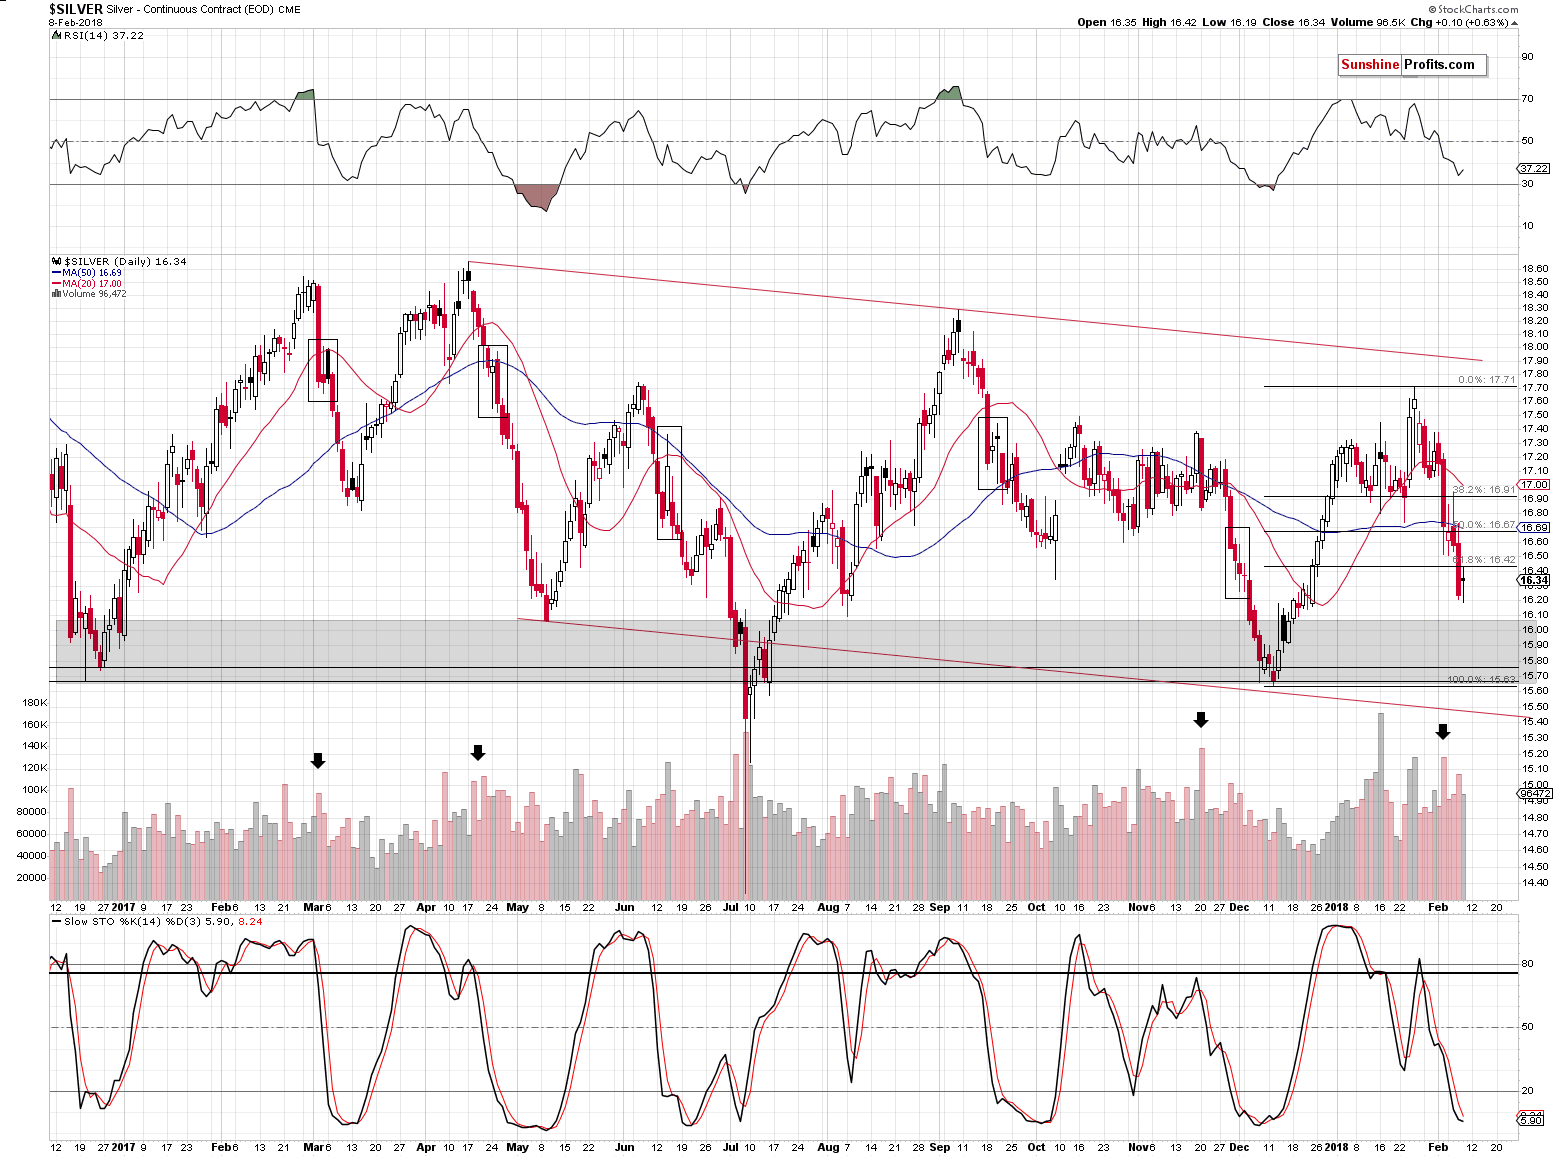
The volume was between average and relatively low. In both cases the volume did not confirm the reversal theory.
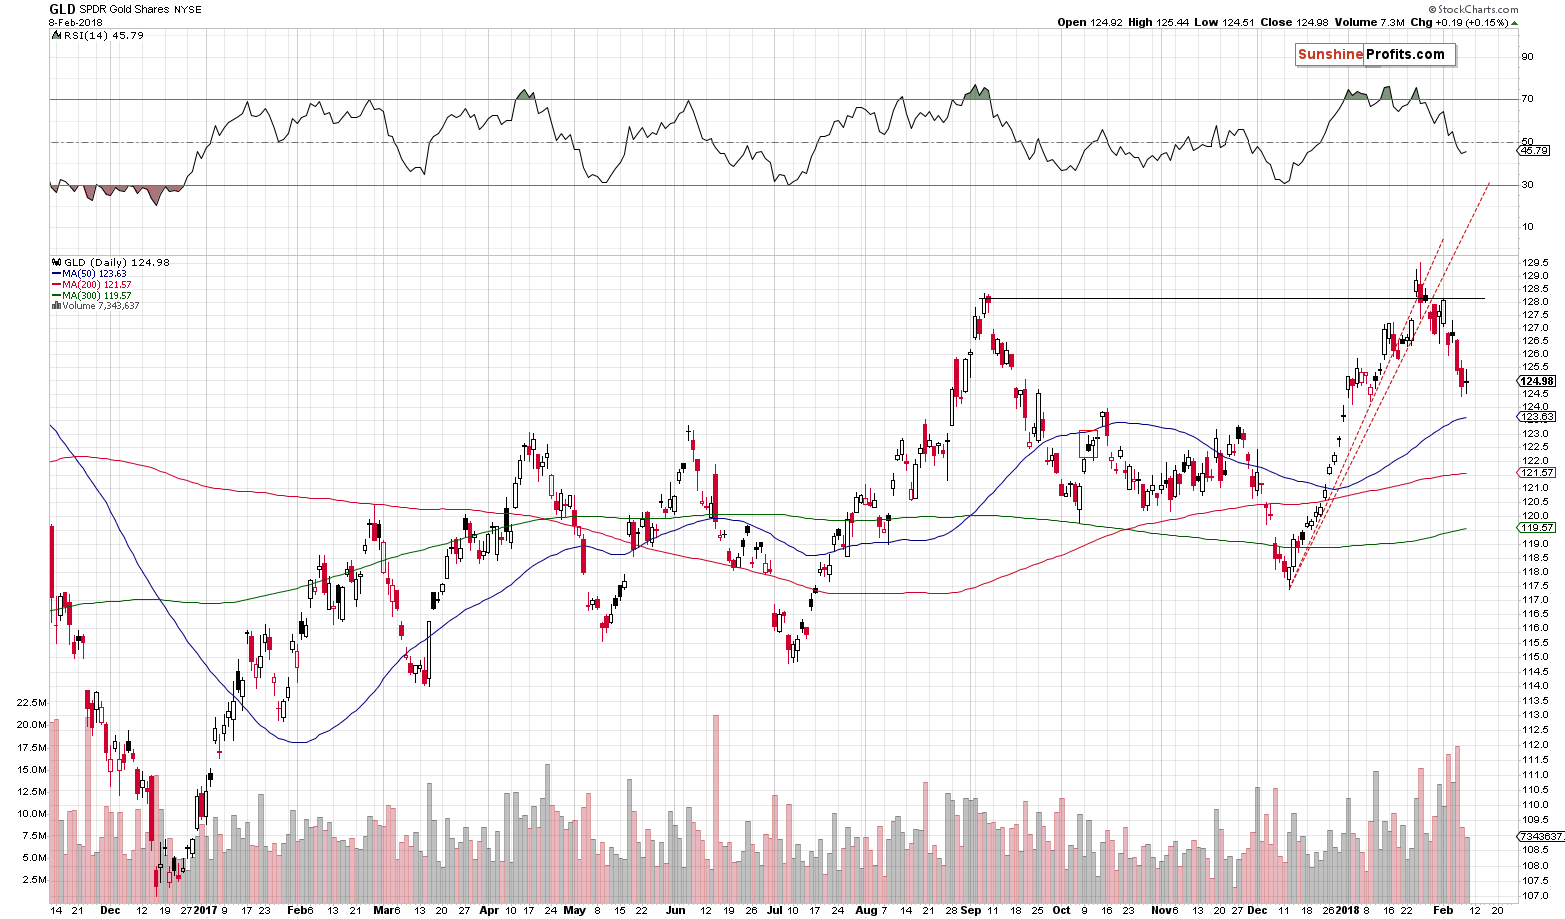
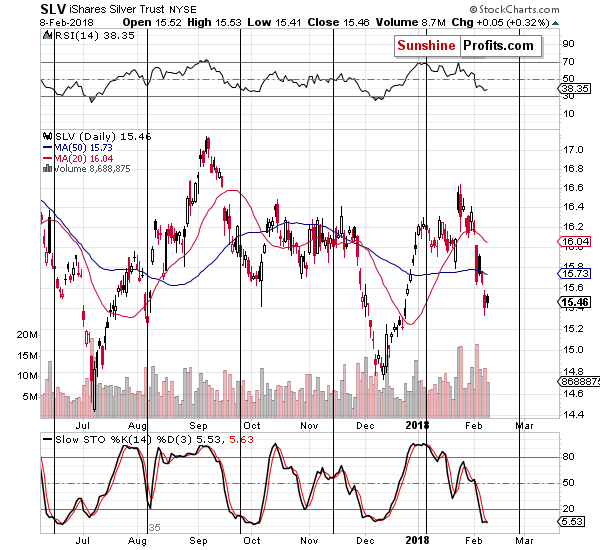
The same is the case with the related ETFs: GLD and SLV. The volume was lowest that we’ve seen this month, which strongly suggests that what we saw yesterday was not a major reversal, but a daily pause. Consequently, the bearish outlook for the short term remains in place.
Nothing else changed on the above charts, so there’s little for us to comment on today. Everything that we wrote in the last few alerts remains up-to-date, so if you haven’t had the chance to read them previously, we invite you to do so today.
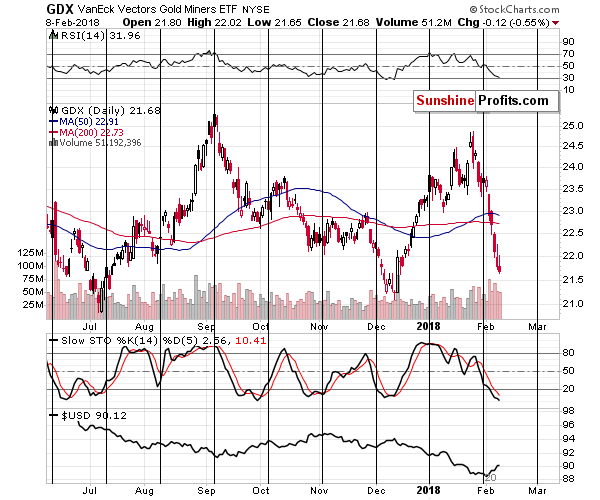
Mining stocks moved lower as we wrote earlier and the likely reason for the decline was the big decline in the general stock market. Consequently, the decline in the mining stocks and their underperformance is quite natural. It doesn’t necessarily confirm the bearish outlook here as there was a good reason outside of the precious metals sector for it, but this daily confirmation is not required here – the preceding days of gold’s underperformance are sufficient.
All in all, we can say that yesterday’s session was rather neutral in case of the mining stocks and this means that the preceding comments and previous – bearish – outlook remains intact.
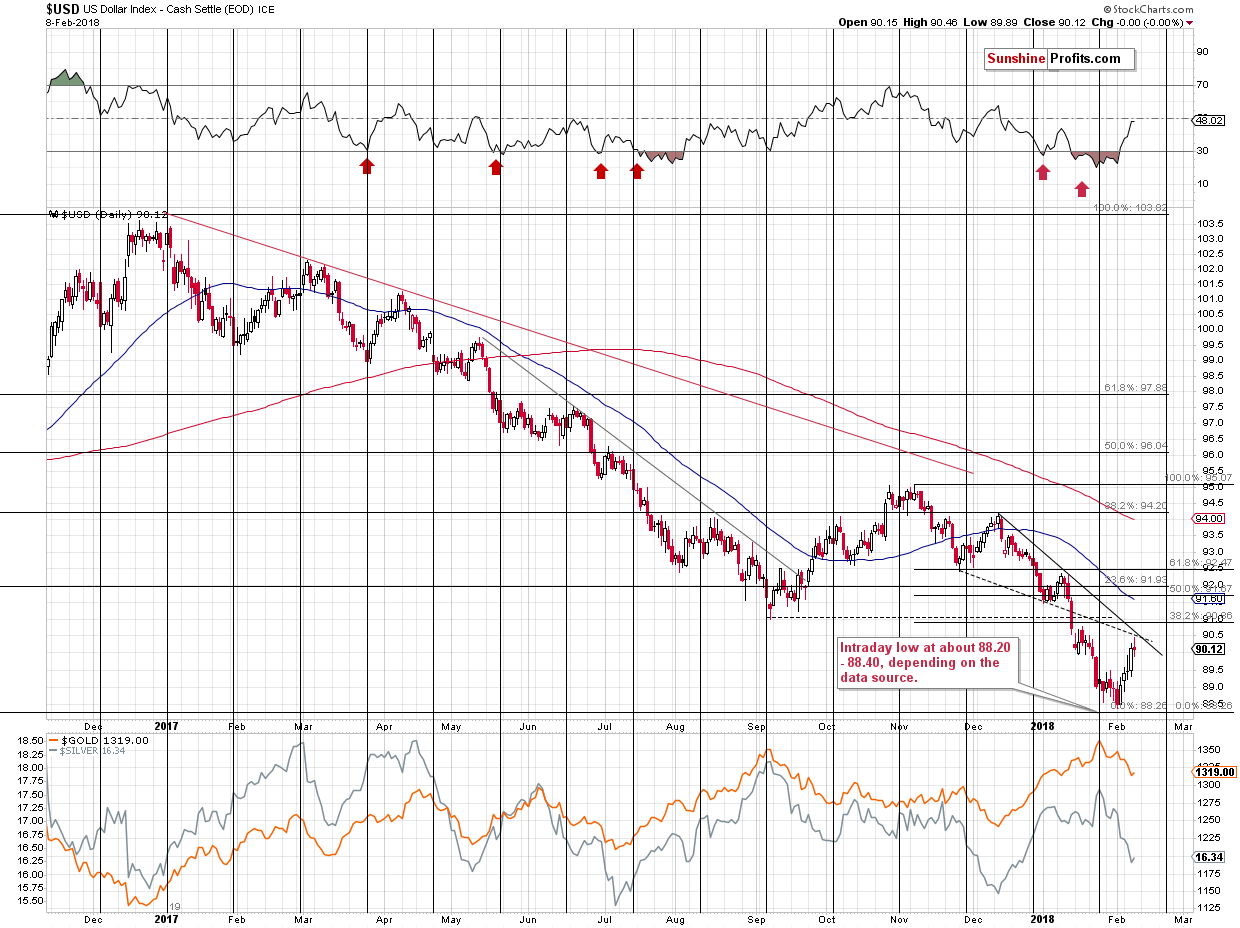
As far as the USD Index is concerned, we described the possible triggers for a pullback in yesterday’s alert. We wrote the following:
The USD Index moved higher this month and invalidated a small breakdown below the previous extremes. This makes the outlook very bullish for the following weeks. However, it doesn’t mean that there will be no pullbacks during the rally. There are several reasons for the USD Index to take a breather relatively soon:
- Declining solid resistance line.
- Declining dashed resistance line.
- 38.2% Fibonacci retracement based on the November – February decline.
- September 2017 bottom.
They all coincide in the 90.5 – 91 area, so that’s where we might see a consolidation. After a decline that was so huge as the recent one, it doesn’t seem that it will be anything major. Even if the USD Index is not moving above the 2017 high (and this seems quite likely), then the corrective upswing that should follow a yearly decline should be bigger than just a few-index-points upswing.
If the decline is not going to be big, then why should we – precious metals investors and traders – care?
Because if the PMs and miners get ahead of themselves during the current decline, then a brief pause in the USD may be enough to trigger a visible corrective upswing. For instance, in early October 2017, the USD Index moved lower for just a few days, but that was enough to trigger about a $30 upswing in gold and a comparatively bigger rally in silver. The current slide in gold and silver is even sharper than the September – October one, so metals might be even more inclined to correct in a visible manner if the USD triggers such a move.
So far, we don’t see the strong willingness in gold to multiply USD’s correction. During yesterday’s back and forth movement gold showed how it currently reacts to USD’s both: upswings and downswings. Overall, in terms of the daily closing prices, there was little impact and as far as intraday price movement is concerned, we don’t see any spectacular movement. Gold moved higher when USD moved lower, but the moves were more or less the same – gold didn’t magnify USD’s signal. It’s visible even more clearly if we compare UUP and GLD charts (it might be more useful as prices for both ETFs have definitely the same data source). UUP was unchanged while GLD moved higher by 0.15% - also next to nothing.
Consequently, we haven’t seen reliable bullish signs based on yesterday’s session.
Before summarizing, we would like to address a question that we received recently regarding the possible formation of a major bottom in gold.
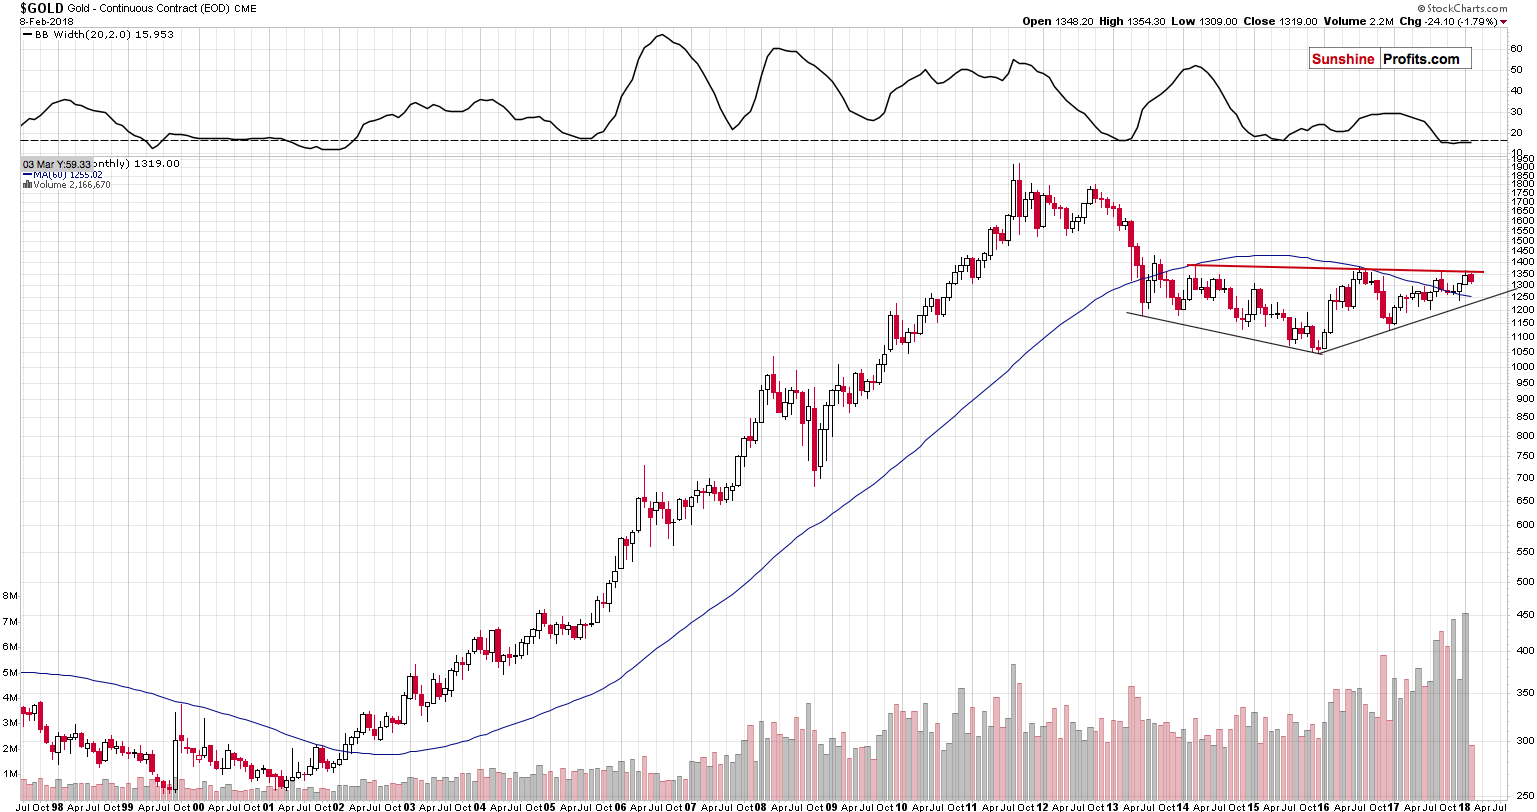
The formation is supposed to look like on the above chart. The lower lows preceded the bottom and higher lows follow it. Gold is still below the red resistance line – based on 3 previous highs, but it’s “about to” break out shortly.
Let’s start with commenting on the latter. There was no breakout above the marked red line, let alone a confirmed breakout, which means that there are no bullish implications. Simple as that. What is more, since there was no breakout, and gold has just once again failed to move through a resistance and it’s relatively close to it, it’s likely to decline – just like it did previously after reaching the $1,350 - $1,400 range. Assuming that the history repeats itself to a considerable degree, the implications are not bullish, but bearish.
Now, moving to the lower lows and higher lows – it impact the outlook in any significant way. Higher lows confirm that gold has been in a kind of an uptrend. However, since it now reached an important resistance, it’s price can start another decline. The only thing that the analysis of the previous lows provides us with, is the major support line, which is current at about $1,220. The mere existence of a support line is something that can trigger a major corrective upswing, but it’s not – by itself – a reason for gold to break above the $1,350 - $1,400 level anytime soon.
The gold market, like other markets, has fractal nature, which means that the patterns that work on a smaller time-frame should work on bigger time-frames and vice-versa. Is it really the case?
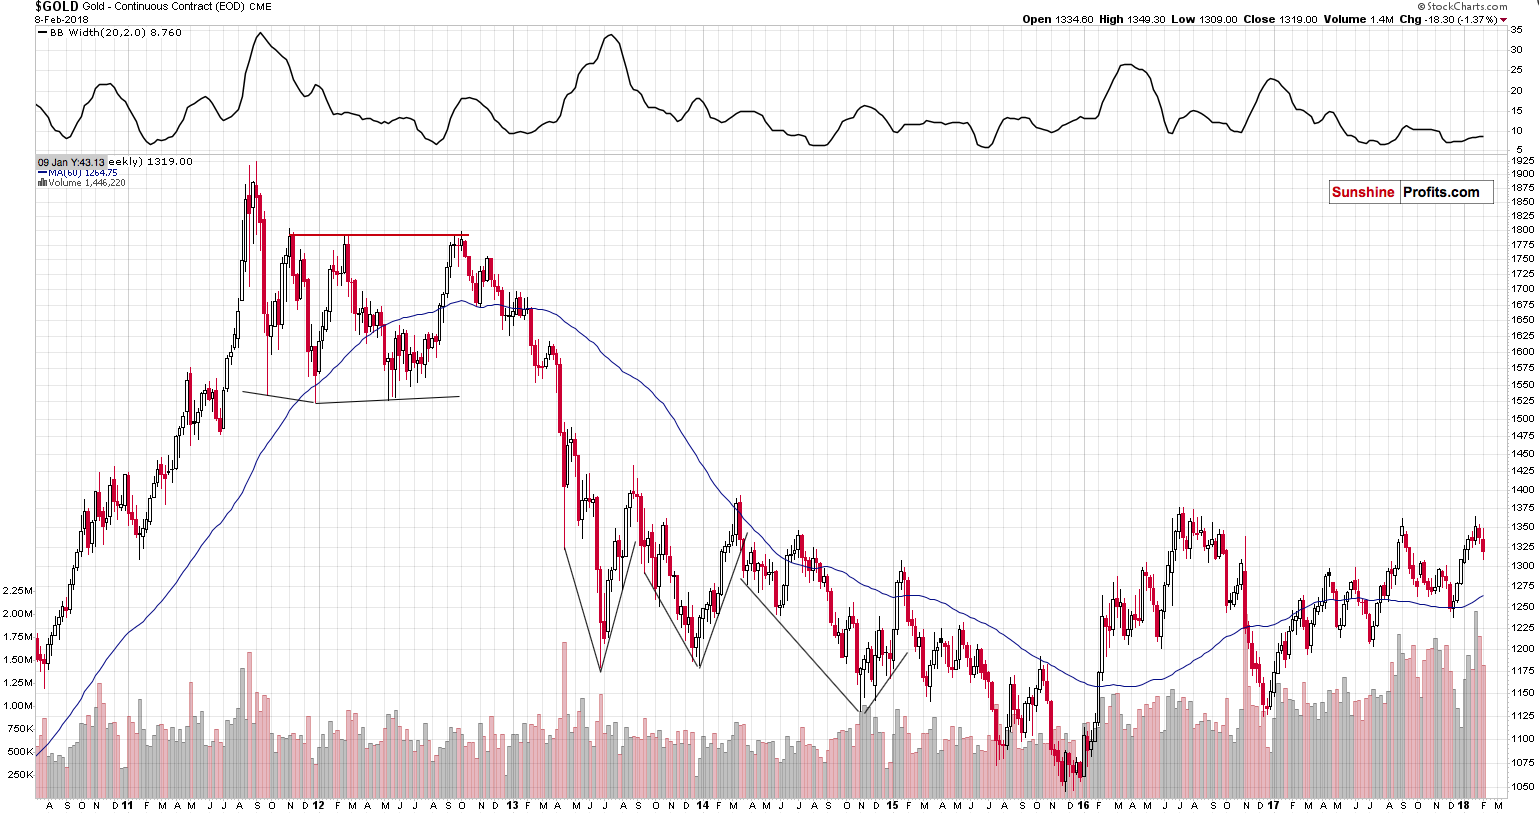
Absolutely not. In the previous years, there were several cases when gold moved higher forming higher lows after a bottom. In some cases, it reached resistance before declining again, and in other cases it didn’t even manage to do just that. All these smaller formations were followed by further declines and this includes even the 2012 performance, which was followed by the biggest decline since decades. Interestingly, before this decline started, gold moved to its previous major highs – just like it did recently.
Now, why would something that was followed by lower prices so many times and that appears similar to the performance that preceded the biggest of gold’s declines in recent history, have any bullish implications whatsoever if the perspective is changed?
We don’t want to go so far to call the higher highs and a rising support line something bearish, but the overall implications of the patterns marked on the previous chart are neutral at best.
Summing up, there are multiple reasons to expect lower precious metals prices in the coming weeks and months and we covered many of them in the previous alerts. There have to be very good reasons to trade against this medium-term trend. There are resistance (USD) and support levels not too far away (gold at about $1,300 and silver at and a little below $16), but it’s not yet clear if it will be worth it to adjust the short position based on them. If we see meaningful signs of strength – for instance, if gold refuses to decline despite the USD’s rally and/or miners refuse to decline even though gold declined, we might exit the short position or even enter a long one. Since yesterday’s session didn’t provide us with bullish signs, it seems too early to do so at this time – the risk of missing the continuation of the decline seems too big.
As always, we will keep you – our subscribers – informed.
To summarize:
Trading capital (supplementary part of the portfolio; our opinion): Full short positions (200% of the full position) in gold, silver and mining stocks are justified from the risk/reward perspective with the following stop-loss orders and initial target price levels:
- Gold: initial target price: $1,218; stop-loss: $1,382; initial target price for the DGLD ETN: $53.98; stop-loss for the DGLD ETN $37.68
- Silver: initial target price: $14.63; stop-loss: $17.82; initial target price for the DSLV ETN: $33.88; stop-loss for the DSLV ETN $20.88
- Mining stocks (price levels for the GDX ETF): initial target price: $19.22; stop-loss: $26.14; initial target price for the DUST ETF: $39.88; stop-loss for the DUST ETF $15.78
In case one wants to bet on junior mining stocks' prices (we do not suggest doing so – we think senior mining stocks are more predictable in the case of short-term trades – if one wants to do it anyway, we provide the details), here are the stop-loss details and initial target prices:
- GDXJ ETF: initial target price: $27.82; stop-loss: $38.22
- JDST ETF: initial target price: $94.88 stop-loss: $37.78
Long-term capital (core part of the portfolio; our opinion): No positions (in other words: cash)
Insurance capital (core part of the portfolio; our opinion): Full position
Important Details for New Subscribers
Whether you already subscribed or not, we encourage you to find out how to make the most of our alerts and read our replies to the most common alert-and-gold-trading-related-questions.
Please note that the in the trading section we describe the situation for the day that the alert is posted. In other words, it we are writing about a speculative position, it means that it is up-to-date on the day it was posted. We are also featuring the initial target prices, so that you can decide whether keeping a position on a given day is something that is in tune with your approach (some moves are too small for medium-term traders and some might appear too big for day-traders).
Plus, you might want to read why our stop-loss orders are usually relatively far from the current price.
Please note that a full position doesn’t mean using all of the capital for a given trade. You will find details on our thoughts on gold portfolio structuring in the Key Insights section on our website.
As a reminder – “initial target price” means exactly that – an “initial” one, it’s not a price level at which we suggest closing positions. If this becomes the case (like it did in the previous trade) we will refer to these levels as levels of exit orders (exactly as we’ve done previously). Stop-loss levels, however, are naturally not “initial”, but something that, in our opinion, might be entered as an order.
Since it is impossible to synchronize target prices and stop-loss levels for all the ETFs and ETNs with the main markets that we provide these levels for (gold, silver and mining stocks – the GDX ETF), the stop-loss levels and target prices for other ETNs and ETF (among other: UGLD, DGLD, USLV, DSLV, NUGT, DUST, JNUG, JDST) are provided as supplementary, and not as “final”. This means that if a stop-loss or a target level is reached for any of the “additional instruments” (DGLD for instance), but not for the “main instrument” (gold in this case), we will view positions in both gold and DGLD as still open and the stop-loss for DGLD would have to be moved lower. On the other hand, if gold moves to a stop-loss level but DGLD doesn’t, then we will view both positions (in gold and DGLD) as closed. In other words, since it’s not possible to be 100% certain that each related instrument moves to a given level when the underlying instrument does, we can’t provide levels that would be binding. The levels that we do provide are our best estimate of the levels that will correspond to the levels in the underlying assets, but it will be the underlying assets that one will need to focus on regarding the signs pointing to closing a given position or keeping it open. We might adjust the levels in the “additional instruments” without adjusting the levels in the “main instruments”, which will simply mean that we have improved our estimation of these levels, not that we changed our outlook on the markets. We are already working on a tool that would update these levels on a daily basis for the most popular ETFs, ETNs and individual mining stocks.
Our preferred ways to invest in and to trade gold along with the reasoning can be found in the how to buy gold section. Additionally, our preferred ETFs and ETNs can be found in our Gold & Silver ETF Ranking.
As a reminder, Gold & Silver Trading Alerts are posted before or on each trading day (we usually post them before the opening bell, but we don't promise doing that each day). If there's anything urgent, we will send you an additional small alert before posting the main one.
=====
Latest Free Trading Alerts:
Are you curious how Mars and Mercury – two powerful Roman mythological figures – are related to the U.S. dollar and gold? Great. We invite you to read our today’s article about these ancient gods and learn more about their impact on the precious metals market.
Mars and Mercury Decide the Fate of the U.S. Dollar and Gold
=====
Hand-picked precious-metals-related links:
PRECIOUS-Gold dips, heads for second weekly loss
Gold price: Value of ETF bullion tops $100 billion for first time in 5 years
=====
In other news:
What Just Happened? Six Views on How the Correction Finally Came
Congress Passes Delayed Budget Deal Ending Hours-Long Shutdown
Jim Rogers Says Next Bear Market Will Be Worst in His Life
Rate rise warning is sign tackling inflation is Bank of England's priority
Hacked cryptocurrency exchange Coincheck to resume yen withdrawals from Tuesday
=====
Thank you.
Sincerely,
Przemyslaw Radomski, CFA
Founder, Editor-in-chief, Gold & Silver Fund Manager
Gold & Silver Trading Alerts
Forex Trading Alerts
Oil Investment Updates
Oil Trading Alerts

