

Briefly: In our opinion, full (200% of the regular size of the position) speculative short positions in gold, silver and mining stocks are justified from the risk/reward perspective at the moment of publishing this alert.
Silver’s anniversary decline was a very profitable move for those who prepared for it. Gold and miners declined as well, while the USD Index closed at a new monthly high. The real big move seems to have begun. What’s next? When are the precious metals likely to form at least an interim bottom?
Let’s start today’s analysis with the currency charts (chart courtesy of http://stockcharts.com).
Forex: Reversal and Breakdown
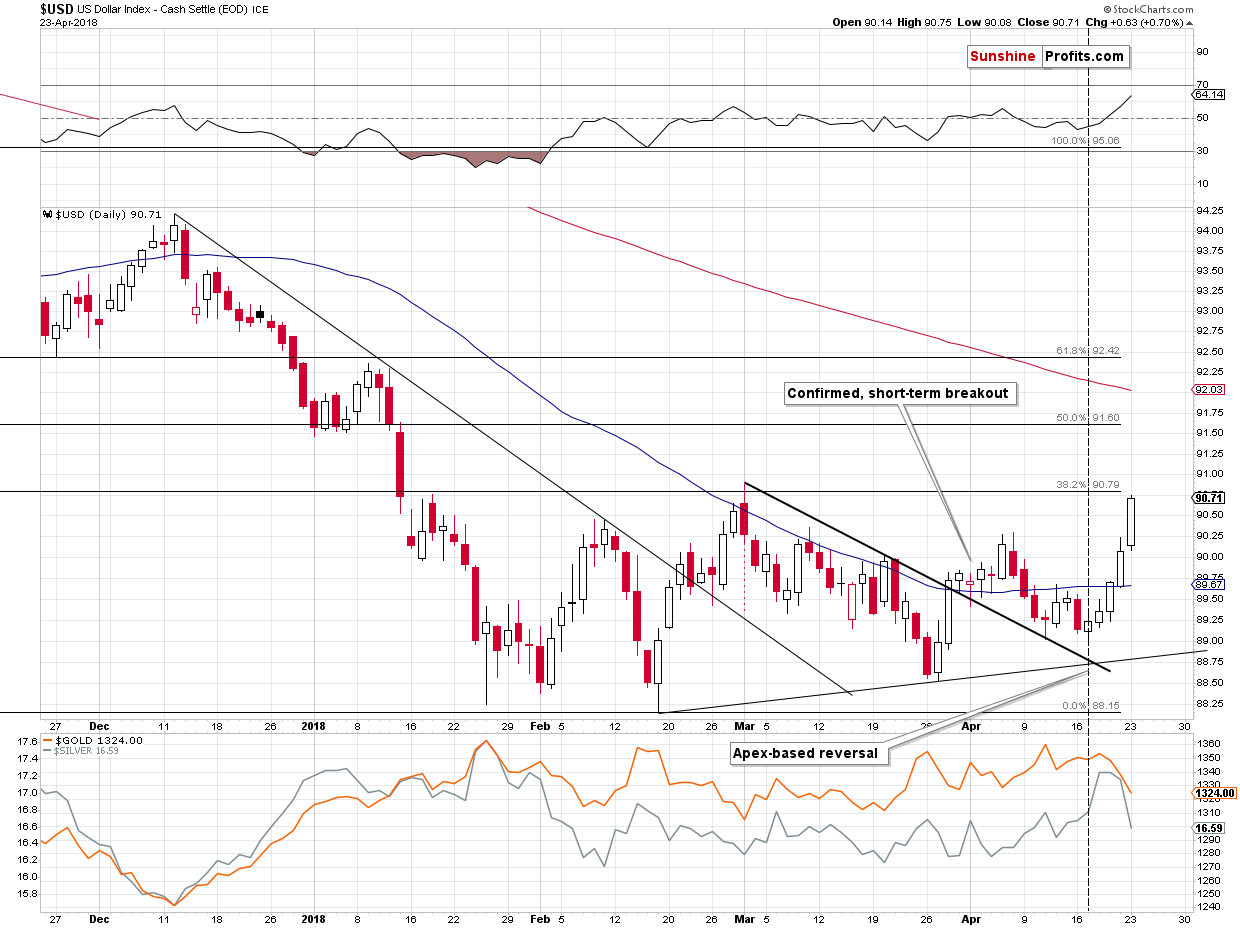
In the previous alerts, we wrote that the USD Index was likely to reverse based on the apex of the triangle that we marked with black lines. It’s now clear that we indeed saw a reversal as the USD moved higher during the reversal day and in all following days.
This had and still has profound implications for the following weeks and months, especially that the USD’s strength was confirmed by a daily close above the February and March highs (in terms of closing prices).
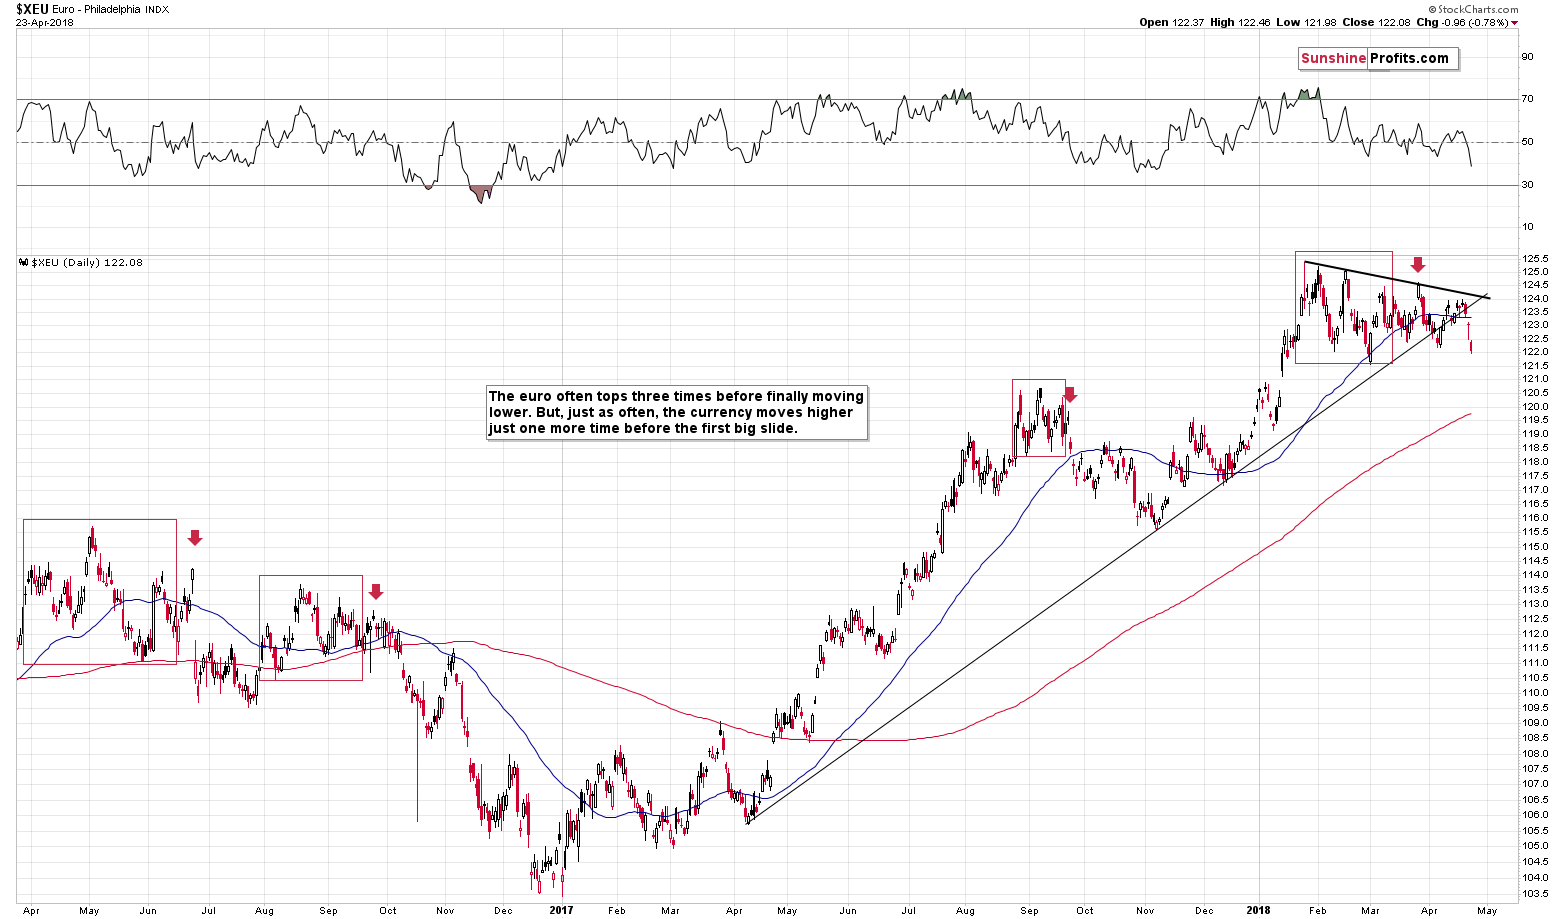
Weeks, because a bigger rally in the USD Index is likely to translate into at least a visible decline in the EUR/USD.
In yesterday’s alert we wrote the following:
Friday’s move lower made the breakout clear and almost confirmed. Almost, because ideally we would like to see three daily closes below the support level in order to view the breakdown as fully confirmed. We have, however, seen a weekly close below it, which is also significant.
The price reversed before the end of the session, so it might seem bullish, but in light of the major breakdown and the fact that the EUR/USD finally closed the day and week below the support, it’s not. A very short-term corrective upswing is quite natural after a major breakdown and the small move higher that we saw before the end of the session could be just that.
The outlook for the euro deteriorated significantly based on Friday’s session and the same goes for the outlook for the PMs.
We now saw the third consecutive daily close below the rising medium-term support line, which fully confirms the breakdown. The implications are now very bearish for the following weeks, but it’s not as clear if the implications are also bearish for the immediate future (this week), because corrective upswings are quite natural after major breakdowns.
Having said the above, let’s take a look at the most interesting part of the precious metals market – silver. We’ll begin by quoting yesterday’s analysis:
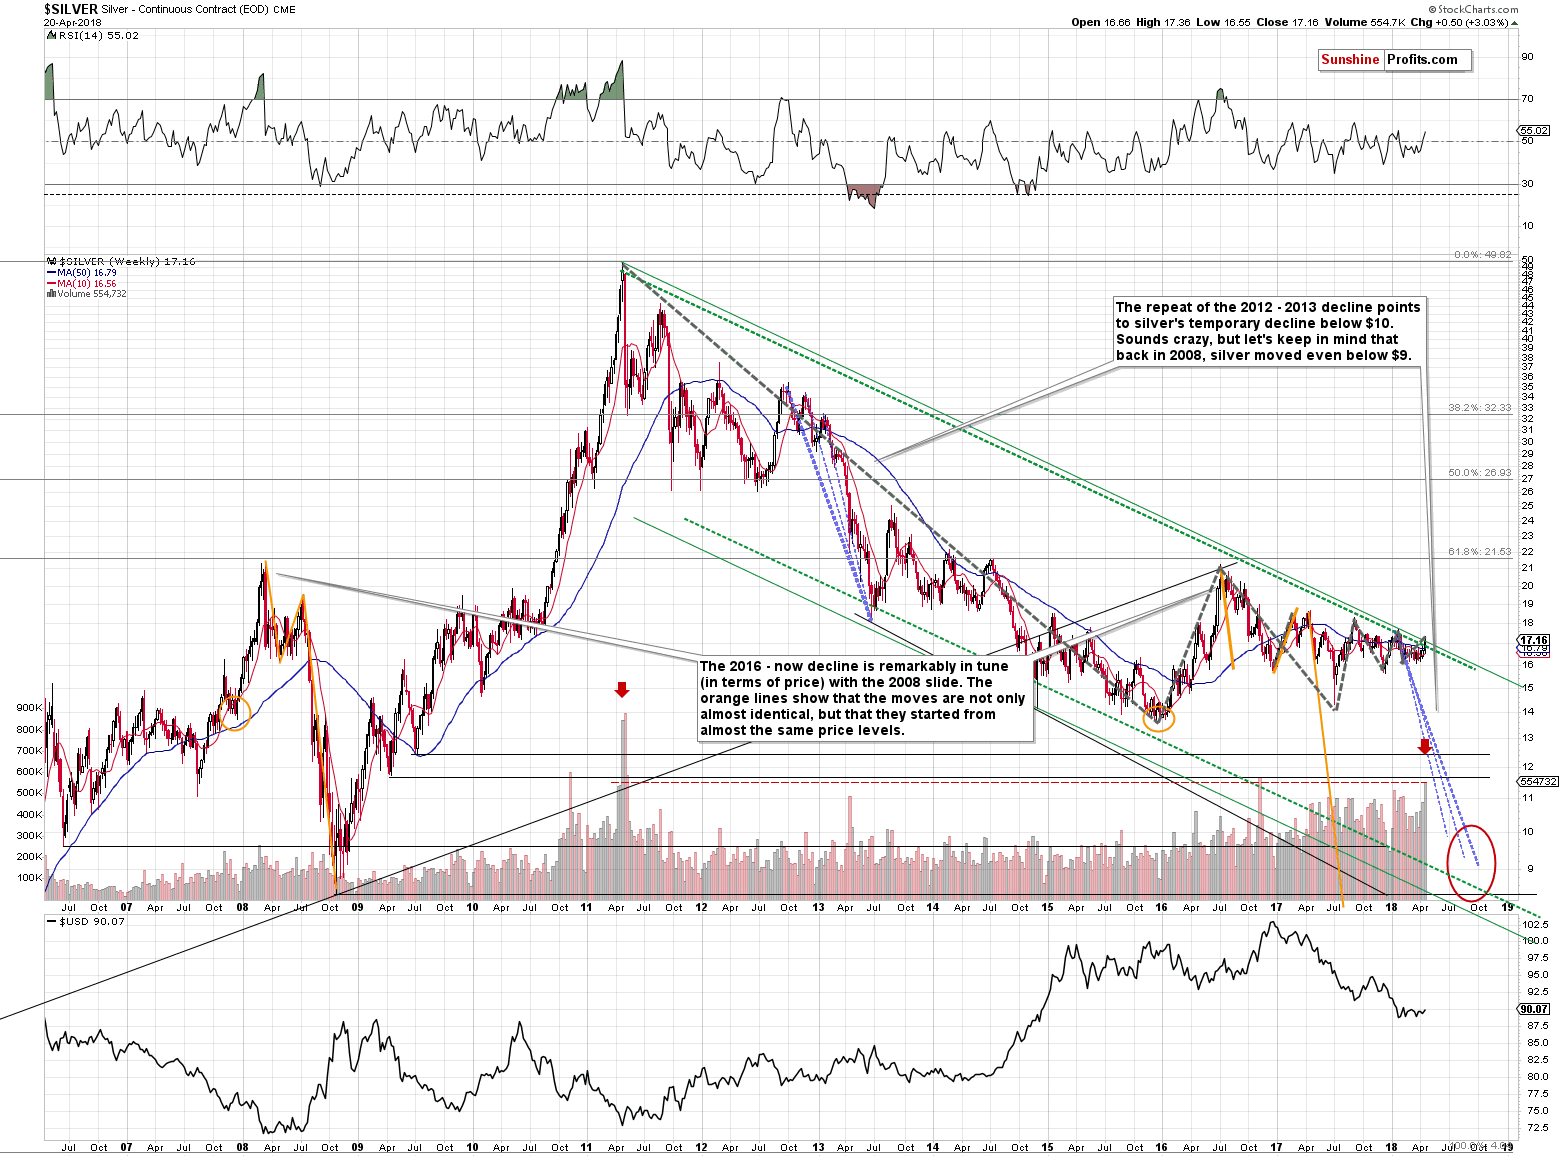
We marked the two biggest volumes that we saw during weekly upswings with red arrows. There were also two weeks when the volume during a rally was similarly big (but not as big) as the last week’s one. These were the weeks that preceded the 2011 top. In other words, the only situation that is similar to what we saw last week is the 2011 top and what we saw immediately beforehand. The implications are obviously very bearish for the following weeks. The less clear – but just as important – implication is that the decline that is likely to follow is probably going to be very sharp. This is what we’ve been expecting anyway based on several other techniques (i.a. silver’s oscillating characteristic and the similarity to the 2012-2013 decline), so the odds for this kind of movement increased further.
This well-confirmed expectation has important implications. If it wasn’t likely for the next big downswing to be volatile, it could make sense to focus on short-term price moves. But, since it is indeed the case that the decline is likely to be volatile, then it overall doesn’t seem worth it to engage in more short-term trading. It’s much better to lose a smaller fish and catch a much bigger one than the other way around. Of course, it’s not pleasant at the moment of losing the small fish, but it’s still the right and prudent thing to do.
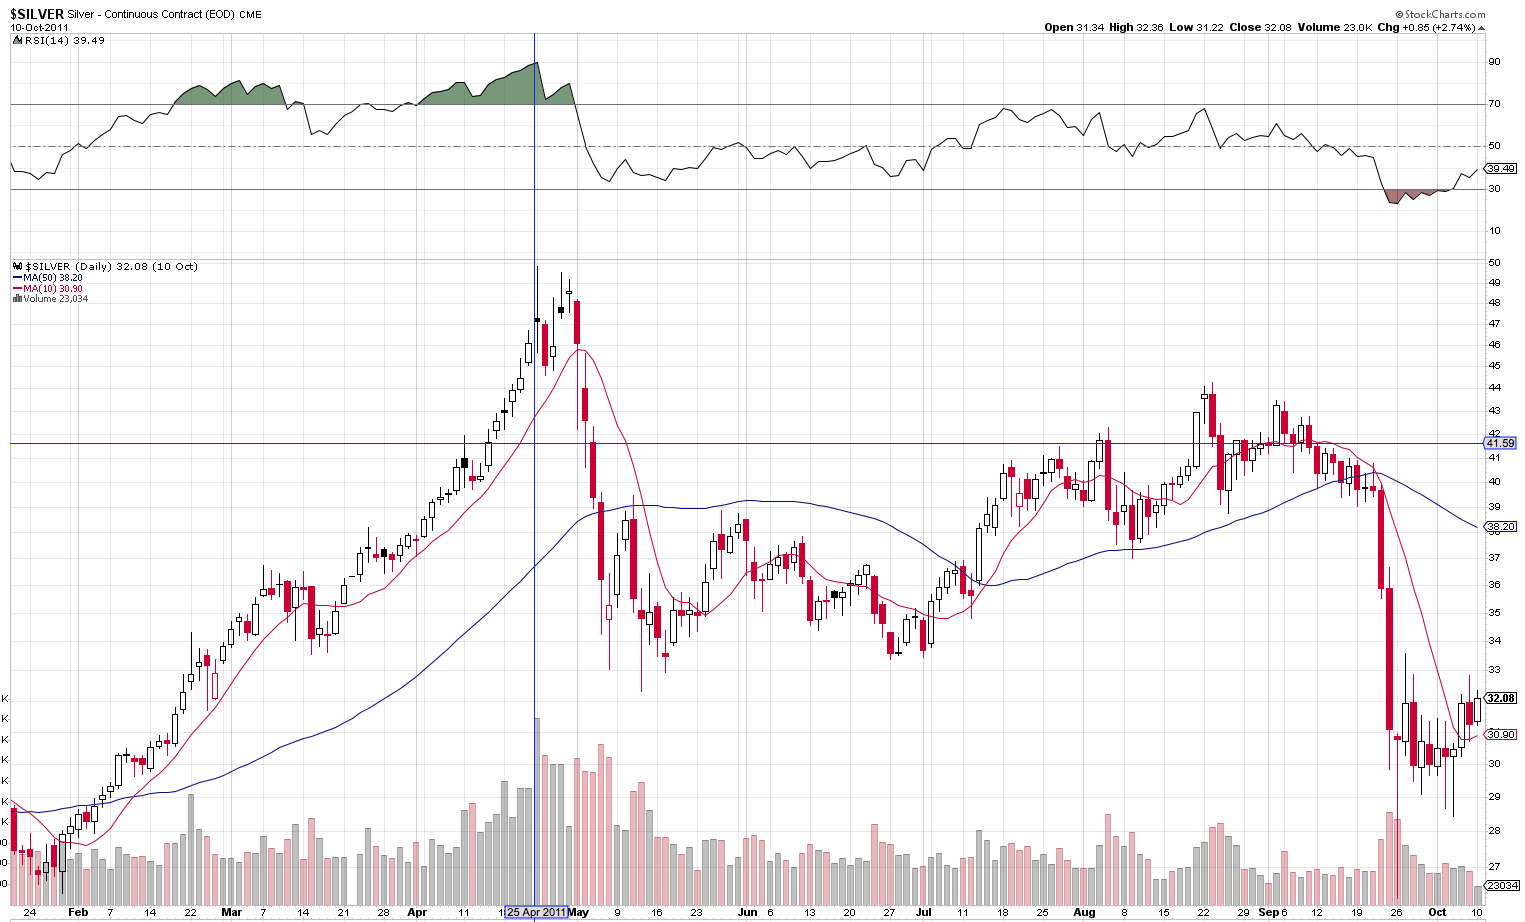
In 2011, silver did two major things on Mondays that we saw at this time of the year. It topped on April 25th in intraday terms and it started its huge decline on May 1st.
So does this mean that silver will still rally for a week?
This could be the case and let’s keep the above analogy in mind in case the white metal moves close to Wednesday’s intraday high. However, we wouldn’t bet the farm on this scenario. History doesn’t have to repeat itself to the letter, especially that the rally that preceded the 2011 top was much bigger than what we saw recently, and it took more time. Therefore, back in 2011 it seemed necessary for the market to take a few extra days to cool down the enthusiasm and this doesn’t have to apply this year. The decline could start shortly – and in a profound manner – without the few additional days of higher closing prices.
The decline indeed started shortly and in a profound manner. And it once again happened on Monday.
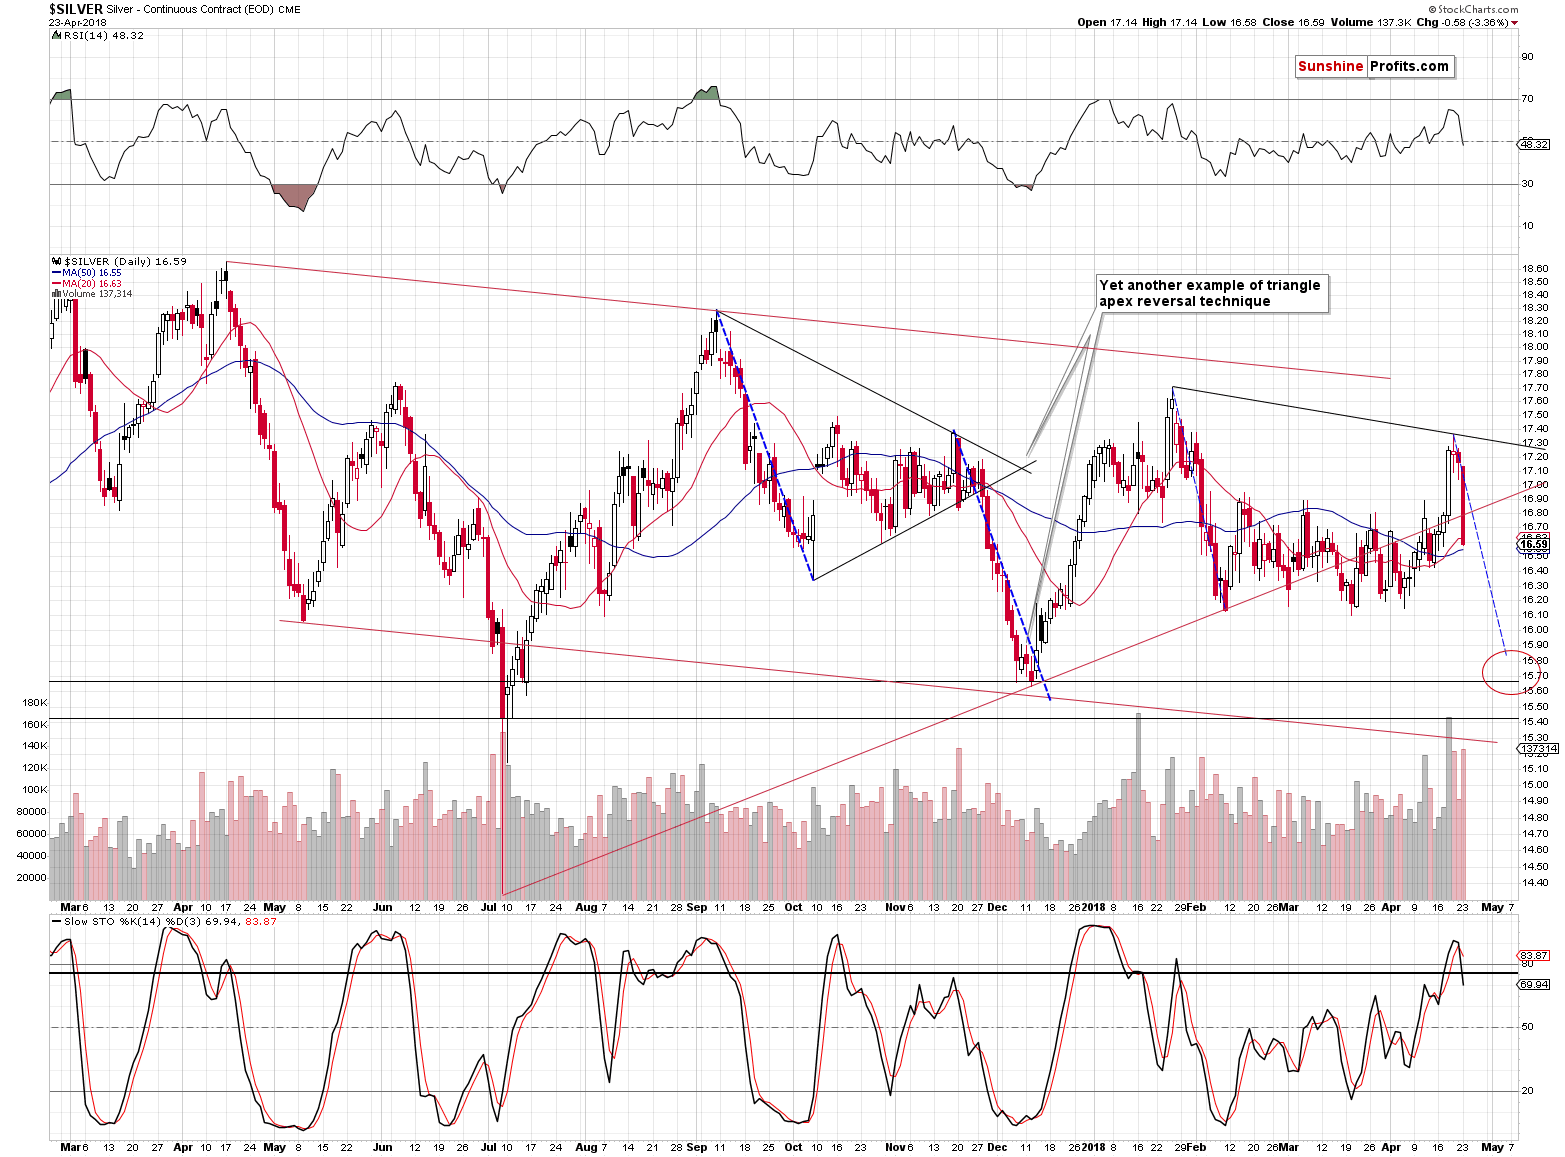
Silver erased more than the entire week of gains in just one day. That’s how silver works. Please remember the above picture and recall it every time you feel the emotional need to buy silver right after it rallies sharply. It’s very often a trap.
The Stochastic indicator moved below its signal line and below the 80 level, both of which are used as sell signals. The RSI declined to 48.32, which is rather meaningless, but we were asked to comment on this number, so we deliver.
The RSI numbers close to 70 suggest that the market is overbought, while values close to 30 suggest that the market is oversold (at least temporarily) – that’s how the RSI usually works. At times, some other interpretations are useful, but only if they have proved to be valid for a given market. The RSI for silver is currently almost right in the middle of its trading range and it doesn’t seem that this accompanied anything special in the past. Consequently, we don’t make much of this value.
What is more important, for instance, is the fact that the self-similar pattern in silver seems to be back to some extent. Based on the recent move higher and the subsequent slide, the current situation once again (to a smaller extent, but still) resembles the September 2017 – December 2017 price performance. The implications are bearish as back then silver continued its slide soon after the final reversal.
Silver’s Outperformance Continues
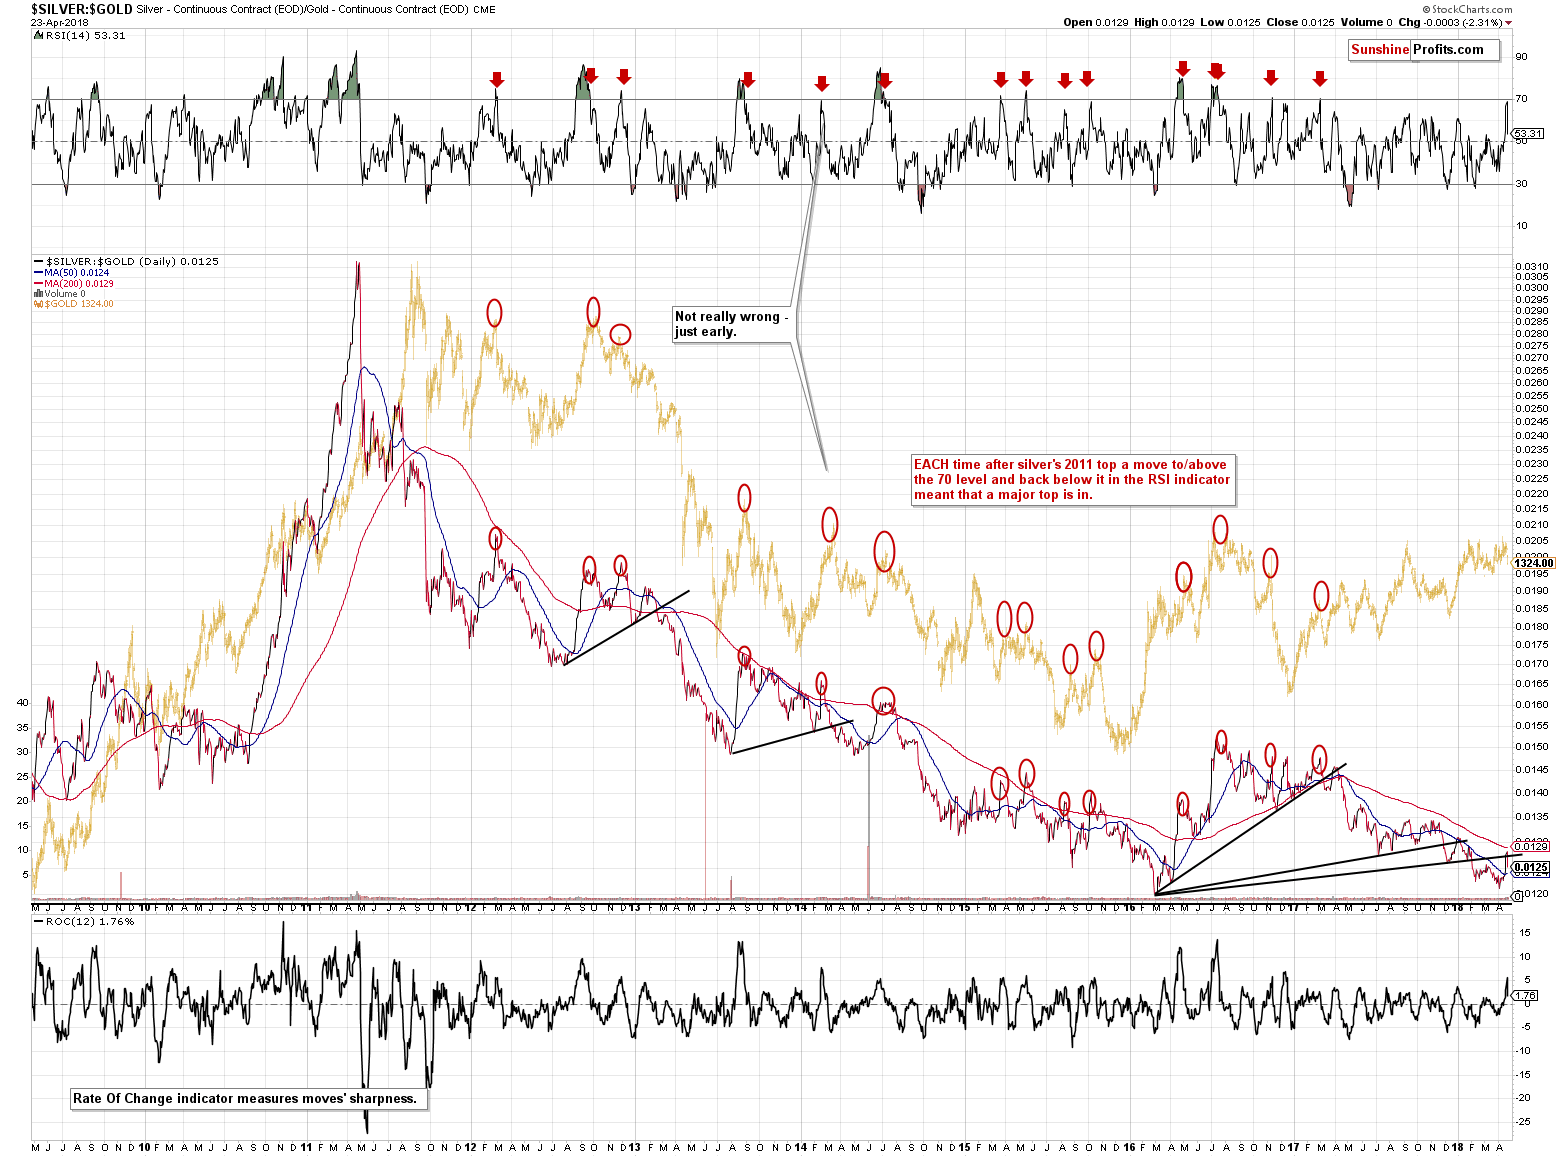
The silver to gold ratio is where the RSI indicator was much more useful. Practically whenever it moved to 70 or above and then declined again, it served as a confirmation that the major top was formed and that much lower prices are to be expected.
On Friday (based on Thursday’s outperformance), we wrote the following on the above chart:
Silver has indeed outperformed once again yesterday, but the outperformance in terms of the daily closing prices wasn’t significant enough to push the RSI above 70. It moved to 67.98, though, so it’s much closer to the key 70 barrier. It seems close enough to say that if we saw a sizable downswing in silver and in the ratio here, it would serve as a very strong confirmation that the final top is indeed in from the medium-term perspective.
In yesterday’s alert, we added the following:
Silver did decline, but it was still strong relative to gold, thus pushing the ratio a bit higher. The same goes for the RSI indicator based on it, which moved to 69.29. It’s almost right at the critical 70 level.
Combining this with the analogy to the 2011 top, we see a situation in which silver once again outperforms for a day or two and then slides erasing the entire previous week of gains, and then declines further.
We didn’t even have to wait – silver plunged right away. The silver to gold ratio and the RSI based on it declined significantly and it seems that the 2018 tops for gold and silver are in. The outlook for the following weeks is clearly bearish.
Please keep in mind that those who went long silver even in the early part of Wednesday’s rally in silver are most likely still holding to their long positions. By being patient with your position you managed to take advantage of yesterday’s slide instead of being hurt by it. Our previous comments on the above remain up-to-date:
Before moving to gold, let’s take a moment to consider what the likely effect of the upcoming price moves in silver will be on those who trusted silver’s outperformance directly and went long. Based on many years or working with investors and traders, we know this effect – people are likely to think and react to certain price moves. Naturally, there are always exceptions, but on average investors and traders often act similarly.
Those who went long silver are likely very happy with their positions right now, feeling very confident and dismissing anything that could make their position seem incorrect. Some of them would even respond very emotionally (even to the extent of being aggressive) to the suggestions that they should short the market. They are also likely to dismiss the decline initially and then to argue that the outlook remains bullish. Once the position is under water, they will convince themselves that their trading position is actually a long-term investment because of silver’s positive fundamentals (forgetting that silver’s fundamentals will not stop a short-term slide, just like they didn’t in 2008) and this will go on until the losses are unbearable, which is when they will capitulate. For the entire time they will likely be blaming everyone else and manipulation in general.
But not you. You’re holding strong, sticking to logic and facts even though it’s very difficult to do amid temporarily rising prices – which is admirable. The funny thing about investing is that what is often difficult to do emotionally is usually also profitable. Your patience and persistence are likely to be well rewarded.
Gold’s Performance After Reversal Week
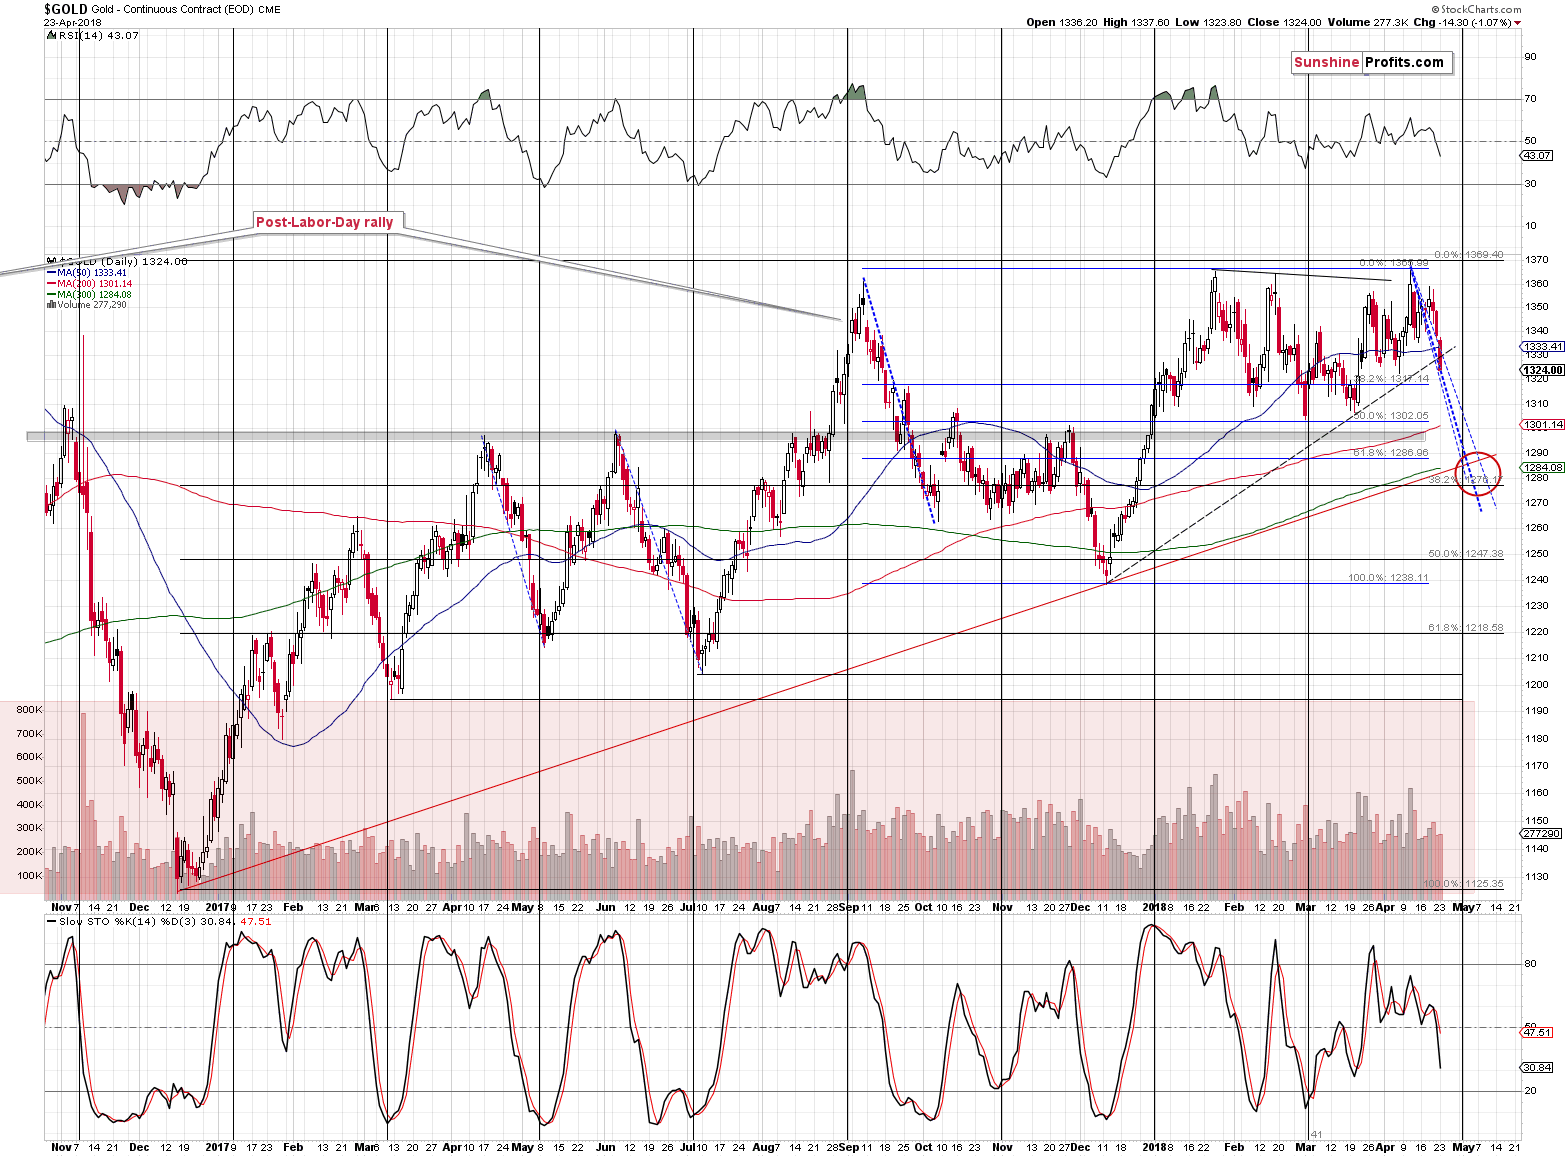
Gold declined once again which is in tune with both: our expectations and the way in which gold declined previously. Our previous comments on the above remain up-to-date:
Also, with each daily decline it becomes clearer that the April turnaround that we saw during the reversal week (right between the apex-based reversals for gold, gold stocks, and silver) was a major reversal, and it is increasingly likely that it was the final top for this year.
Mining Stocks Follow PMs Lower
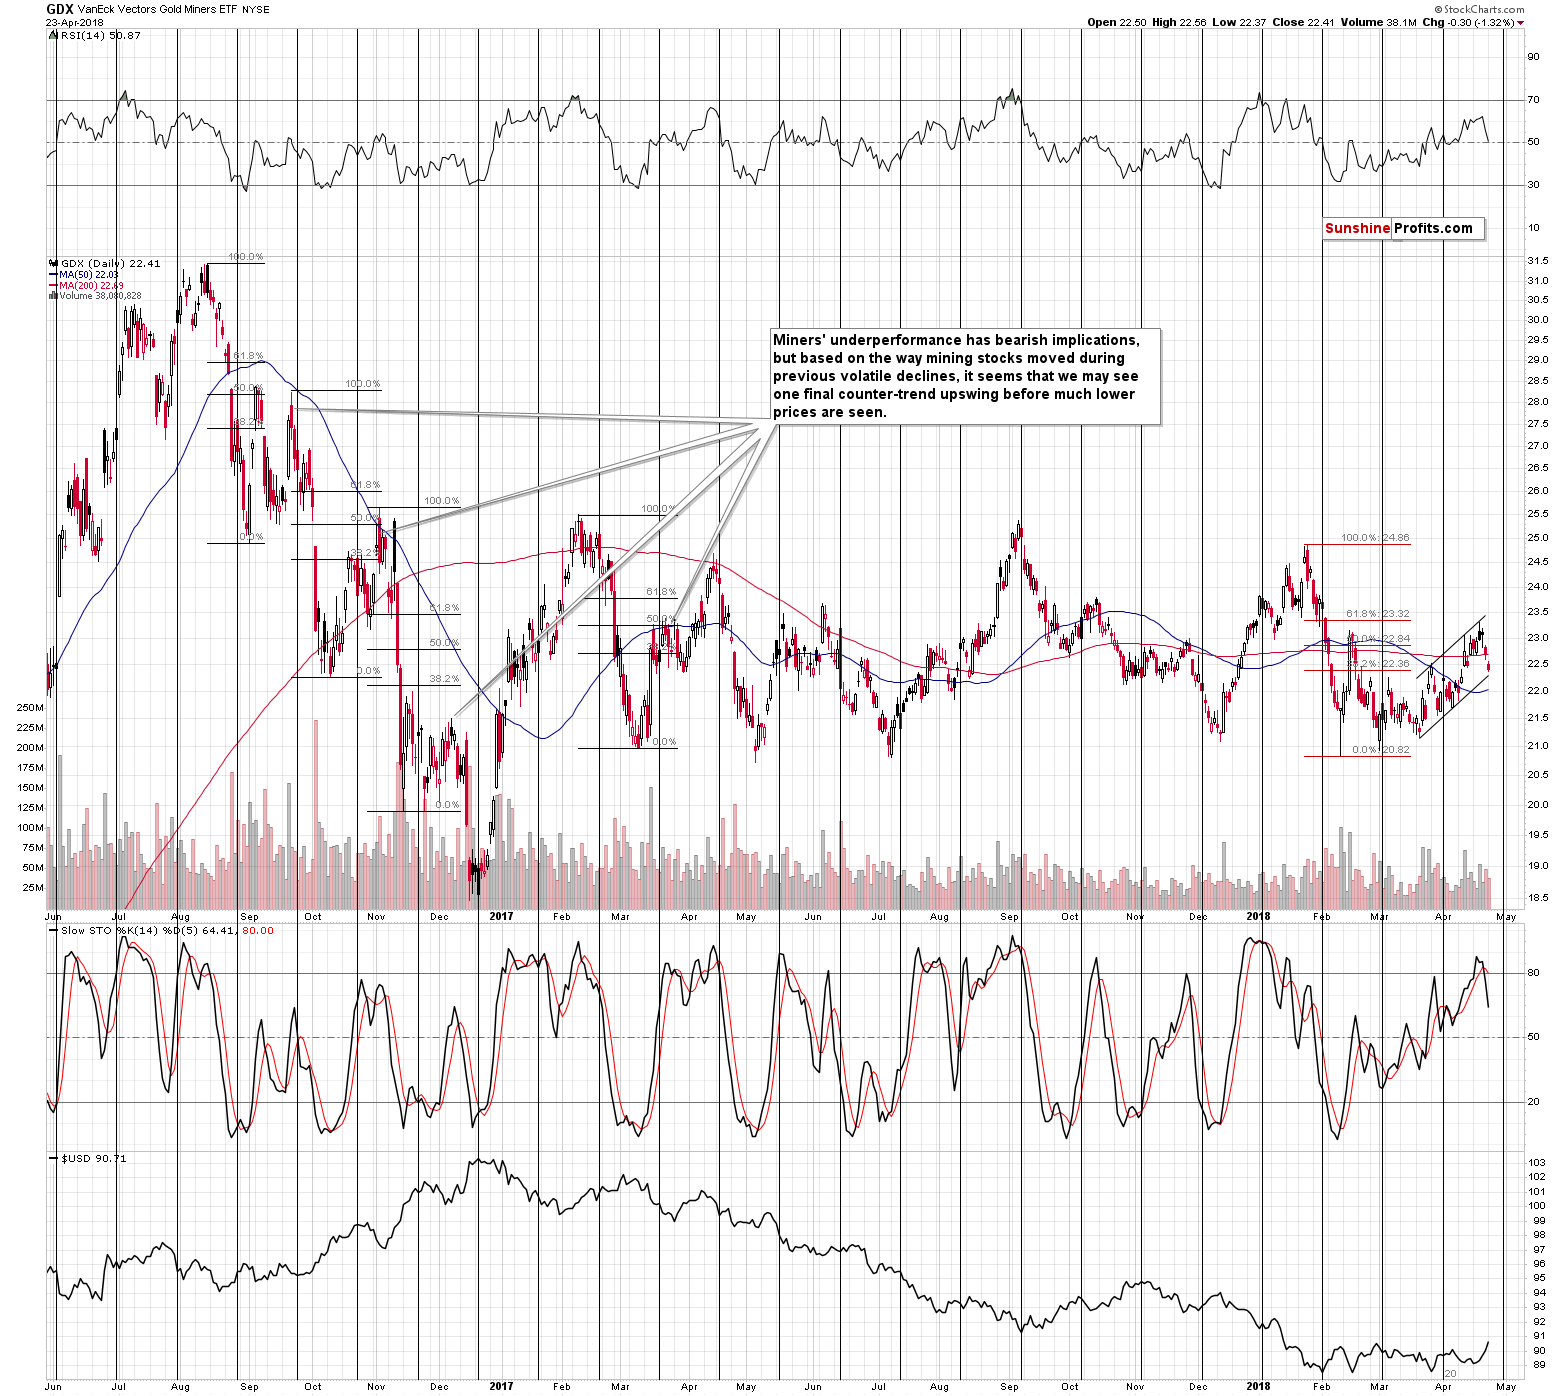
Miners declined on rather average volume and they have not yet broken below the rising short-term support line which is the lower border of the rising trend channel. If gold and silver continue lower, we’ll likely see this breakdown shortly. If it doesn’t happen shortly, then it’s likely to happen soon anyway as it doesn’t seem that anything more bullish than a small counter-trend correction is likely at this time.
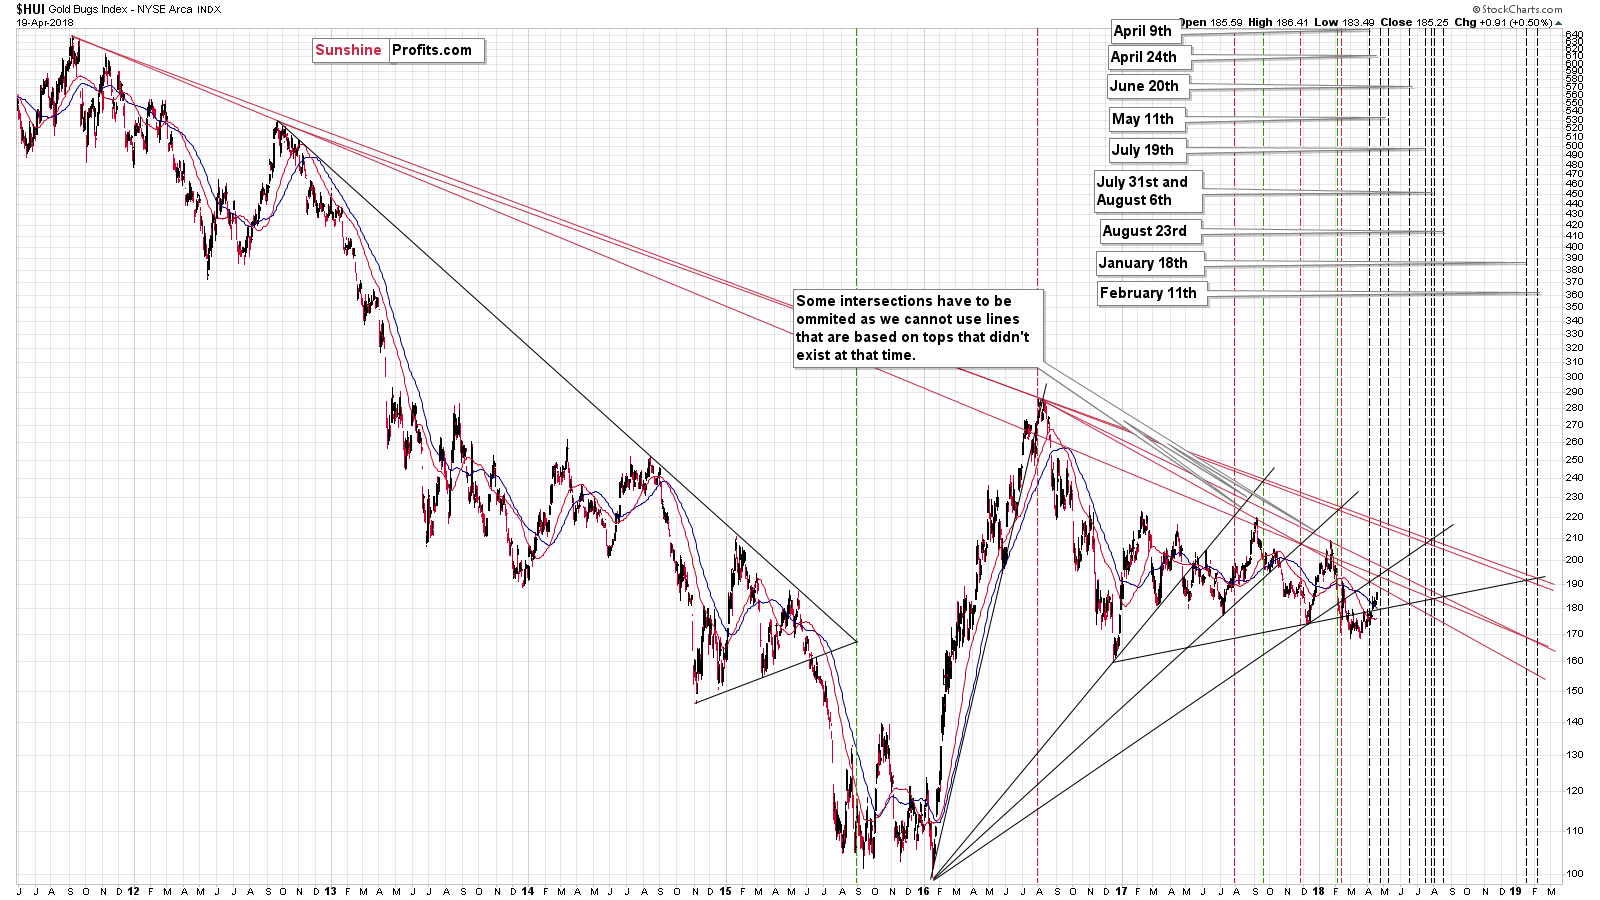
In yesterday’s analysis, we wrote that the next triangle-apex-based reversal was today, but since the miners have already reversed very recently, it doesn’t seem that any new major reversal is likely at this time.
Summary
Summing up, the decline in silver was not surprising, but normal and expected and the outlook for the following weeks remains bearish. Silver’s anniversary along with other similarities continue to point to lower silver prices and the same is likely for the rest of the precious metals sector.
We are likely to see an interim bottom in a week or so i.a. based on the self-similar patterns in gold and silver and on gold and mining stocks’ cyclical turning points. We’re likely to see an additional decline before that time.
On an administrative note, due to your Editor’s travel plans for the rest of the week, the next few alerts will be shorter than the ones that we’ve been publishing recently (yesterday’s price moves were too interesting to keep today’s alert short, though). Of course, we will keep an eye on the market and we’ll keep posting the alerts on a daily basis, plus intraday alerts whenever the situation requires it.
As always, we will keep you – our subscribers – informed.
To summarize:
Trading capital (supplementary part of the portfolio; our opinion): Full short positions (200% of the full position) in gold, silver and mining stocks are justified from the risk/reward perspective with the following stop-loss orders and initial target price levels:
- Gold: initial target price: $1,218; stop-loss: $1,382; initial target price for the DGLD ETN: $53.98; stop-loss for the DGLD ETN $37.68
- Silver: initial target price: $14.63; stop-loss: $18.06; initial target price for the DSLV ETN: $33.88; stop-loss for the DSLV ETN $19.27
- Mining stocks (price levels for the GDX ETF): initial target price: $19.22; stop-loss: $23.54; initial target price for the DUST ETF: $39.88; stop-loss for the DUST ETF $21.46
In case one wants to bet on junior mining stocks' prices (we do not suggest doing so – we think senior mining stocks are more predictable in the case of short-term trades – if one wants to do it anyway, we provide the details), here are the stop-loss details and initial target prices:
- GDXJ ETF: initial target price: $27.82; stop-loss: $36.14
- JDST ETF: initial target price: $94.88 stop-loss: $41.86
Long-term capital (core part of the portfolio; our opinion): No positions (in other words: cash)
Insurance capital (core part of the portfolio; our opinion): Full position
Important Details for New Subscribers
Whether you already subscribed or not, we encourage you to find out how to make the most of our alerts and read our replies to the most common alert-and-gold-trading-related-questions.
Please note that the in the trading section we describe the situation for the day that the alert is posted. In other words, it we are writing about a speculative position, it means that it is up-to-date on the day it was posted. We are also featuring the initial target prices, so that you can decide whether keeping a position on a given day is something that is in tune with your approach (some moves are too small for medium-term traders and some might appear too big for day-traders).
Plus, you might want to read why our stop-loss orders are usually relatively far from the current price.
Please note that a full position doesn’t mean using all of the capital for a given trade. You will find details on our thoughts on gold portfolio structuring in the Key Insights section on our website.
As a reminder – “initial target price” means exactly that – an “initial” one, it’s not a price level at which we suggest closing positions. If this becomes the case (like it did in the previous trade) we will refer to these levels as levels of exit orders (exactly as we’ve done previously). Stop-loss levels, however, are naturally not “initial”, but something that, in our opinion, might be entered as an order.
Since it is impossible to synchronize target prices and stop-loss levels for all the ETFs and ETNs with the main markets that we provide these levels for (gold, silver and mining stocks – the GDX ETF), the stop-loss levels and target prices for other ETNs and ETF (among other: UGLD, DGLD, USLV, DSLV, NUGT, DUST, JNUG, JDST) are provided as supplementary, and not as “final”. This means that if a stop-loss or a target level is reached for any of the “additional instruments” (DGLD for instance), but not for the “main instrument” (gold in this case), we will view positions in both gold and DGLD as still open and the stop-loss for DGLD would have to be moved lower. On the other hand, if gold moves to a stop-loss level but DGLD doesn’t, then we will view both positions (in gold and DGLD) as closed. In other words, since it’s not possible to be 100% certain that each related instrument moves to a given level when the underlying instrument does, we can’t provide levels that would be binding. The levels that we do provide are our best estimate of the levels that will correspond to the levels in the underlying assets, but it will be the underlying assets that one will need to focus on regarding the signs pointing to closing a given position or keeping it open. We might adjust the levels in the “additional instruments” without adjusting the levels in the “main instruments”, which will simply mean that we have improved our estimation of these levels, not that we changed our outlook on the markets. We are already working on a tool that would update these levels on a daily basis for the most popular ETFs, ETNs and individual mining stocks.
Our preferred ways to invest in and to trade gold along with the reasoning can be found in the how to buy gold section. Additionally, our preferred ETFs and ETNs can be found in our Gold & Silver ETF Ranking.
As a reminder, Gold & Silver Trading Alerts are posted before or on each trading day (we usually post them before the opening bell, but we don't promise doing that each day). If there's anything urgent, we will send you an additional small alert before posting the main one.
=====
Latest Free Trading Alerts:
Breaking News! North Korea has agreed to denuclearization. Great! But what does it mean for the gold market? And… why is this not true?
Will Kim’s Denuclearization Dethronize Gold?
Well, not literally, but the British pound has definitely seen better days. And the worse it gets for the pound, the better is gets for those who followed our analysis as we’ve been shorting this market almost right from the top. The support, however, is just around the corner. What’s next?
London Bridge Is Falling Down, Falling Down
Big-cap tech stocks led the market lower on Friday, despite coming quarterly earnings releases. Was this a downward reversal or just quick correction before another leg up? It seems that the stock market will open virtually flat today, so there may be some more uncertainty after Thursday-Friday move down. There are still two possible medium-term scenarios.
Stocks Lower Again as Plot Thickens in Earnings Play
=====
Hand-picked precious-metals-related links:
PRECIOUS-Gold steadies after 3-day slide as dollar stabilises
OCBC Bank raises year-end Gold prices foreast from $1,150 an ounce to $1,400 an ounce
Barrick Gold earnings just beat market; turns focus to growth
Randgold expects Kibali gold output to rise thanks to automation
=====
In other news:
Bonds Edge Up as Dollar Holds Gain; Stocks Climb: Markets Wrap
Google helps stock markets recover, oil stretches above $75
How 3% Yields Could Reshape the Investing Landscape
3% on the US Treasury yield is ‘just noise’ and does not matter, economist says
Facebook Stock Is a Bubble About To Be Popped, Famed Fund Manager Says
One in five financial institutions consider cryptocurrency trading, survey says
=====
Thank you.
Sincerely,
Przemyslaw Radomski, CFA
Founder, Editor-in-chief, Gold & Silver Fund Manager
Gold & Silver Trading Alerts
Forex Trading Alerts
Oil Investment Updates
Oil Trading Alerts

