
The year 2011 began with strange, unpredictable events around the world. Five thousand red-winged blackbirds fell dead on New Year’s Eve in Arkansas and 500 more in Louisiana. Then thousands of turtle doves rained down on roofs and cars in an Italian town in the latest in a growing spate of mass animal deaths across the globe. Two million dead fish washed up on the shores of the Chesapeake Bay in Maryland.
We don’t believe in omens, but these strange events remind us that nature, like the markets, is unpredictable and full of risks.
What are some of the risks and lingering structural weaknesses in the economy that we can identify for the upcoming year? What are the black swans, or angry economic birds that might rain down from the sky? Most investors still have portfolios filled with capital losses and clear memories of the financial collapse of 2008. Last week we wrote about the “Risk On – Risk Off” phenomenon where investors either believe the future is good and risk appetite is ON; or else they believe the future is doom and gloom and risk is OFF. There does not seem to be much middle ground.
Here are some risks that bear watching in 2011.
The Euro Zone
This week we will already see the euro zone's debt crisis entering a new phase as Portugal struggles to convince investors to buy its bonds. Other European governments will step up pressure on the country to seek an international bailout. Portugal hopes to raise new funds in a bond auction this week, despite a market selloff in recent days that pushed the interest yield on Portuguese 10-year bonds above 7% Friday, the highest level since the euro's creation. Economists said such high borrowing costs are unsustainable for the country, which is struggling to rein in its debts amid chronically low economic growth. While the debt crisis in Ireland appears to be under control, all eyes are now on Spain and Portugal. But we wonder about Italy, which has escaped the limelight so far. Italy is l 2 Trillion EUR in debt and has much worse debt statistics than Spain. Keep in mind that Greece got into trouble with a debt-to-GDP ratio of 116%. Italy’s is 118%. Italy's deficit is smaller and it has a high savings ratio. However, if there is a nominal GDP contraction in Italy, its debt stats will worsen very rapidly.
And hey, did anyone notice that Belgium is still without a government for more than 210 days? After numerous rounds of negotiations between the winners of this summer’s federal elections, Belgium’s Flemish nationalists and the French-speaking socialists are still gridlocked. The lack of political stability may well harm Belgium’s credit rating in the near future. As one of the most highly indebted countries in Europe with government spending equaling almost 50 percent of GDP, Belgium’s ability to borrow is pivotal.
How will all this affect the price of precious metals? If people lose even more confidence in the euro they will look to precious metals as a safe haven.
Bonds in a Bind
After years of delivering gains, bonds may not be such a great investment idea for 2011. For the past two years individual investors poured more than $600 billion into bond funds. But there is a distinct possibility that in 2011 long-term interest rates might rise which would spell trouble for bondholders. We just saw an estimate telling us that by the end of Obama's term, the US will be spending a third of its tax revenues just to service its debt.
How will that affect that price of precious metals? That’s a no-brainer. If bonds are no longer a good option as a safe haven, precious metals will look even more attractive than ever.
Real Estate—Real Trouble
Housing is a key driver of expansion during economic recovery but it looks like home building will remain in a depression with a huge backlog of unsold and vacant homes. Foreclosures will continue with yet more houses dumped into a weak market.
How will that effect gold and silver? If real estate is not a good place to park your money, precious metals will look like home sweet home.
Currency Wars
The financial Times reported this week that Brazil has warned that the world is on course for a full-blown “trade war” as it stepped up its rhetoric against exchange rate manipulation. The country’s finance minister said Brazil was preparing new measures to prevent further appreciation of its currency, the real, and would raise the issue of exchange-rate manipulation at the World Trade Organization. The US and China were among the worst offenders, he said. Chile, one of the most free-market of emerging economies, has also unveiled a campaign of intervention against its currency. There is a real chance this race to the currency bottom, which is a form of protectionism, could degenerate into a trade war. If investors will lose even more confidence in fiat currencies, they will likely turn to gold. Next week we will take a look at some other risks.
To see how gold is performing with the start of 2011 let's begin this week's technical part with the analysis of the Euro Index. We will start with the long-term chart (charts courtesy by http://stockcharts.com.)
Euro - USD Indices
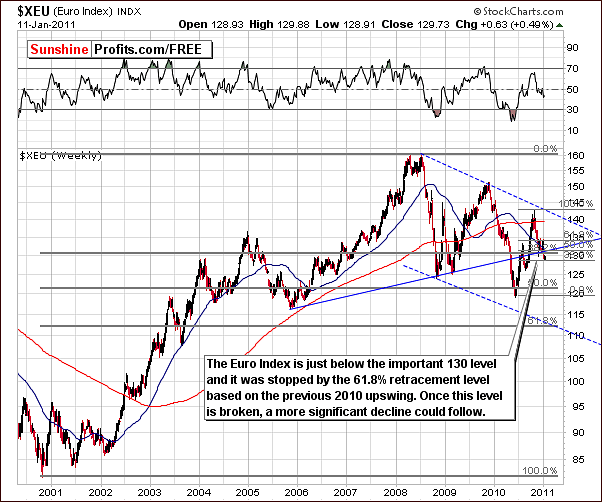
Once again we begin this week’s Premium Update with the very long-term Euro Index chart. Many support levels have been broken in the recent decline of the euro, most of which were in the 130-range. The index closed on Tuesday on 129.73 which is right at the 61.8% Fibonacci retracement level - the lowest of many support levels coinciding in that area.
Several support levels have been broken but to an insignificant degree. One support level remains and appears to be the last stop to prevent a decline down to the 120 level. There is still a possibility that the recent trend will reverse. If this does not occur, additional declines of as much as 8% are likely.
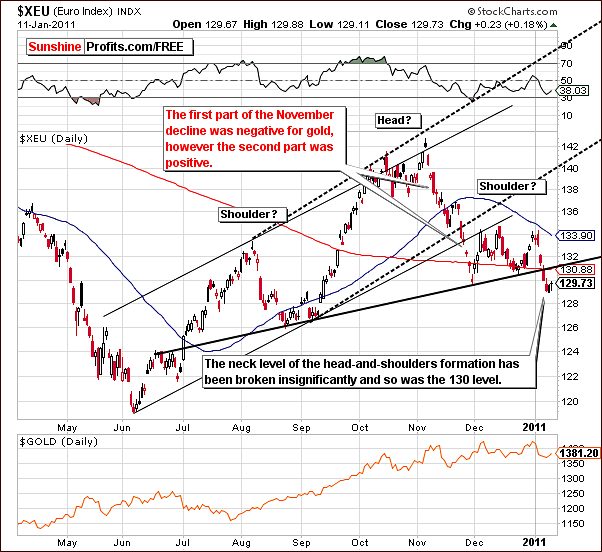
In the short-term Euro Index chart this week, the neck level of the head-and-shoulders pattern has been broken and this breakdown is being verified. One support level remains (as mentioned earlier) and although a rally from here is possible, the odds are against such an outcome. The outlook is quite bearish at this time for the Euro Index.
Gold prices have recently declined along with Euro Index levels and some Subscribers have questioned this commonality. As we discussed at length in last week’s Premium Update, the USD appears to have been leading gold not moving against it. Although the euro and gold appear to have trended in a similar manner recently, this does not appear to be the main observation here.
A large decline could eventually materialize in the Euro Index with a small consolidation taking shape now and a second period of decline to follow. This is what was seen last November and can be termed a zigzag pattern, two declining periods with a consolidation in between. At that time, gold declined initially (during the first decline within the zigzag) as well but rallied when the downtrend following the consolidation began. In short, further declines in the Euro Index do not automatically infer lower gold prices.
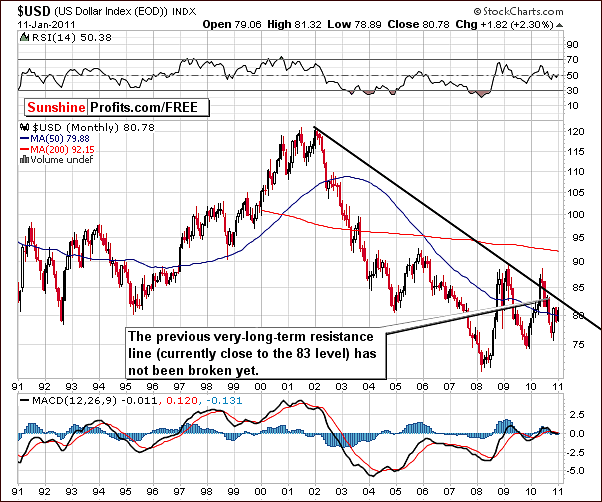
In this week’s very long-term USD Index chart, we see the impact of the declining euro. Since the currency EUR/USD exchange rate is a large component of the USD Index, a declining euro generally is paired with higher USD Index levels. The USD Index outlook is bullish for the upcoming days and weeks. Although the 83 level target has not yet been reached, it is still a valid target for the near-term.
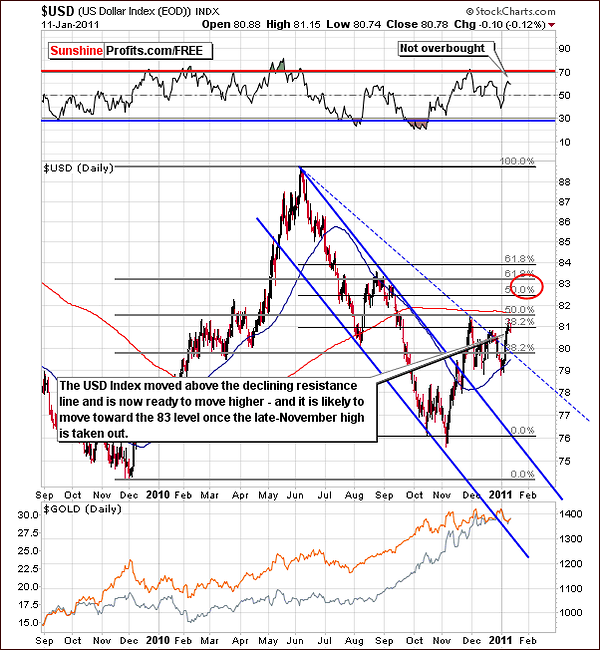
In the medium term USD Index chart, current index levels are seen to have moved above the declining resistance line and appear to be heading higher. Once the late November high is taken out, the target level of 83 is likely to be approached soon thereafter. Additionally, Tuesday’s closing RSI level of 59.97 is not close to an overbought situation meaning the rally still has room to grow.
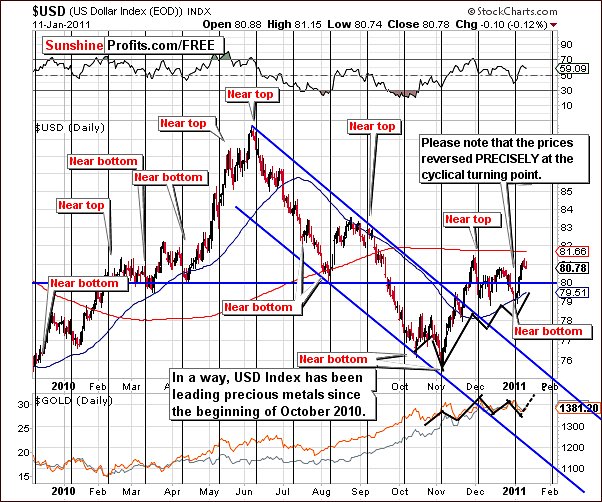
The above short-term USD Index chart shows how gold has been following the trend of the dollar since October. It is clear that a quick rally in gold prices is possible as has been seen in recent USD Index level movements. Based on the above chart, bullish sentiment for the USD Index is likely to create the same for the precious metals sector.
Summing up, the prevailing sentiment for the USD Index is bullish at this time. Although, index level trends appear to be the opposite of what has been seen for gold, silver and mining stocks, it is likely that the next period of euro index decline will have a very different influence on the precious metals sector. Since the USD has been seen to lead precious metals of late, the implications for gold, silver and mining stocks are overall slightly bullish. We will comment on this phenomenon once again in the section dedicated to correlations.
General Stock Market
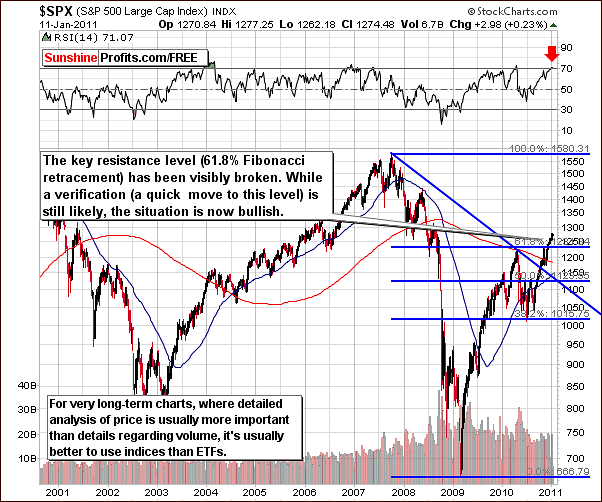
The situation did not change in the general stock market this week. Observations made in last week’s Premium Update are still valid. “…it is important to note here that the uptrend has continued and now surpassed 2010 highs. More importantly, index levels are now above the 61.8% Fibonacci retracement level. With an RSI greater than 70, caution is advised. A recent decline in stocks was not verified and a breakout above previous highs followed. Recent correlation coefficients show little influence from stocks upon precious metals at this time.”
Summing up, the overall picture for the main stock indices is bullish, and a small move lower to the early-2010 high would not invalidate the situation.
Correlation Matrix
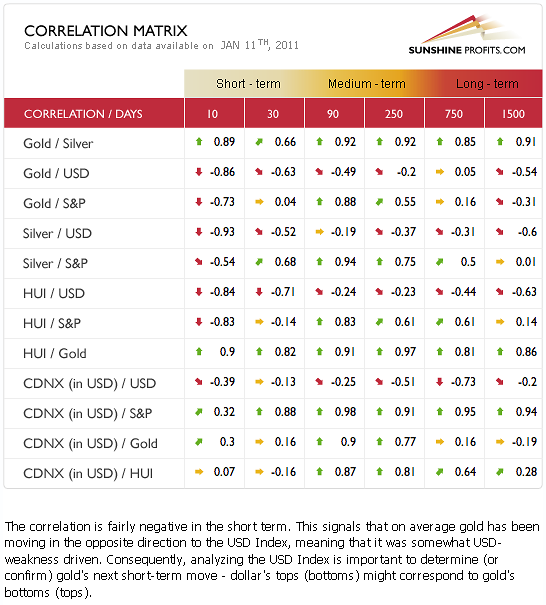
In this week’s Correlation Matrix, a slightly negative relationship is seen between precious metals and the USD. This has been discussed at several points in this week’s update. The precious metals in general have been heavily influenced by declines in the currency markets recently. This is however not as negative as it appears to be.
The influences as well as the coefficients in this week’s Correlation Matrix are somewhat mixed. No clear implications are provided. The bullish case resulting from the indirect relationship between currencies and metals, which has been discussed for the USD Index, combined with slightly bearish readings from the above table, leads us to a slightly bullish sentiment for gold, silver and mining stocks.
In the 30-day column, the general stock market is seen to have little influence on gold and mining stocks with a somewhat greater influence upon silver. However, it is important to note that values are still significant in the 90-day column. This means that a small move lower in the general stock market is not a serious threat to gold, but a big decline in stocks would still likely cause gold to decline.
Summing up, taking the abovementioned direct factors into account, and the ones mentioned earlier makes use conclude that the situation remains slightly bullish at this point.
Gold
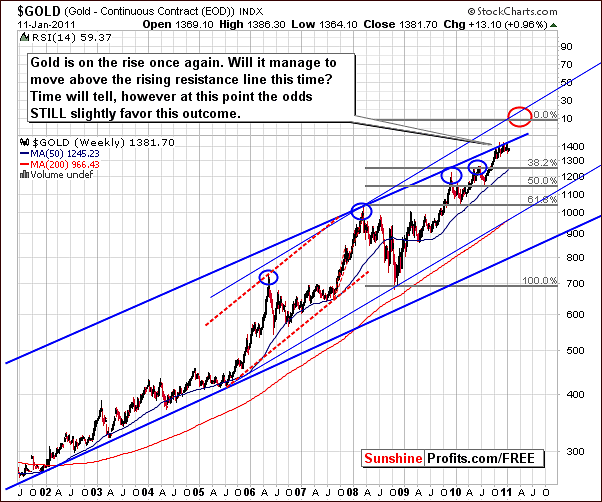
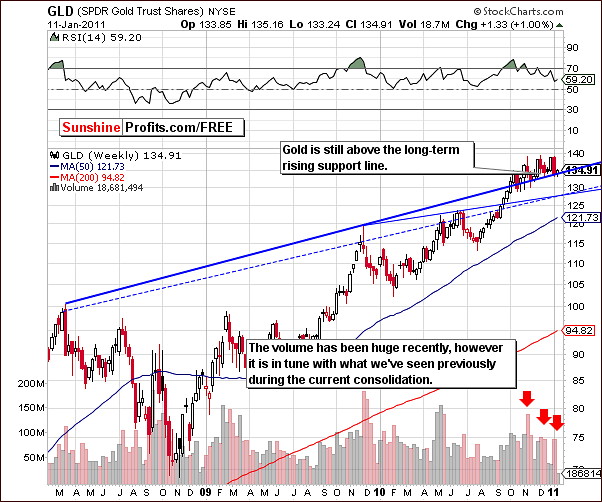
In this week’s very long-term gold chart, we again get a perspective on the significance of gold’s recent price action. Once again no sign of a breakdown is yet visible. As we mentioned in last week’s Premium Update, periods of consolidation have been followed by additional rally in just about all cases when looking back over the past ten years. The consolidation was not followed by a local top on any occasion. Consequently the above chart suggests that higher - not lower - prices are to be expected for gold.
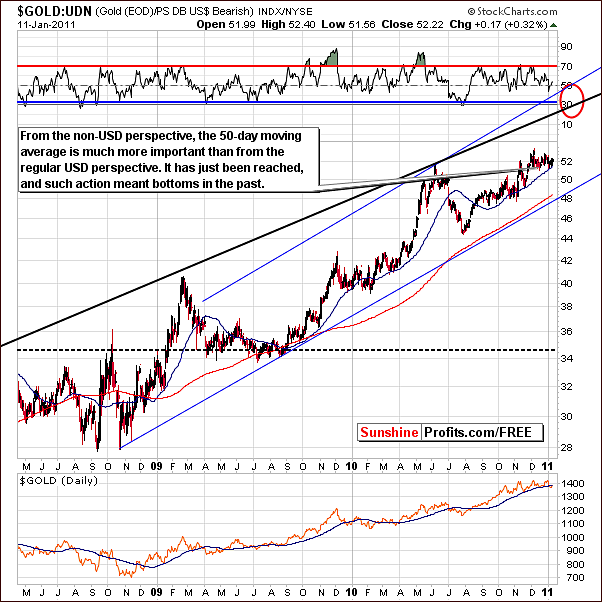
From a non-USD (meaning the average of gold prices, when priced in currencies other than the US dollar) perspective, we have seen slightly higher prices in recent days. The index level touched the 50-day moving average, which once again has provided support. The trend from this point still appears to be up as daily closing levels have remained above 2010 highs. No breakdown has been seen.
When following a trend such as the case here, the expectation normally is for the trend to continue until it is invalidated. Invalidation would require a breakdown and verification of the breakdown by three consecutive days of closes below the previous support line. Since no evidence of a breakdown has been seen, the target marked with a red ellipse remains valid.
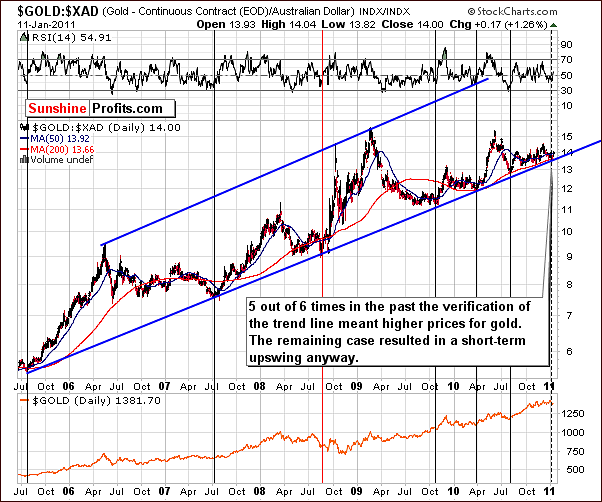
We have included a new chart this week, which illustrates gold’s price in terms of the Australian dollar. This is one of the non-USD gold charts that we monitor. Usually, these charts don't provide really conclusive calls, so we don't feature them (instead we feature an average in the form of the gold:UDN ratio). However, this time, the Australian perspective appears to provide us with an important confirmation.
From the perspective of the Australian dollar, gold is seen to have touched the long-term support line. In five of the past six times in which this occurred, higher prices followed. Consequently, the above chart provides us with a clearly bullish signal.
In 2008 (when the remaining situation was seen) the situation overall was somewhat upside down as the general stock market took a severe plunge. Such is not the case today however, nor do we expect to see this, at least in the following weeks. The implications for gold are therefore clearly bullish.
There is another factor that should be taken into account. Currently Brisbane, Australia's 3rd largest city, is facing major flood similar to the one from 1974. According to Queensland Premier Anna Bligh quoted in CBS article "...last week the cost of the floods could be as high as $5 billion, the latest figure available." We cannot rule out scenario in which Australian dollar will suffer from these events, thus giving the GOLD:XAD ratio additional reason to move higher.
From a regular USD perspective, gold’s price moved right to the support level and stopped. The support line was created from important 2009 and 2010 highs, which makes a significant one. A recent slide was stopped and no breakdown below this support line was seen. Once again we can state that the trend remains up.
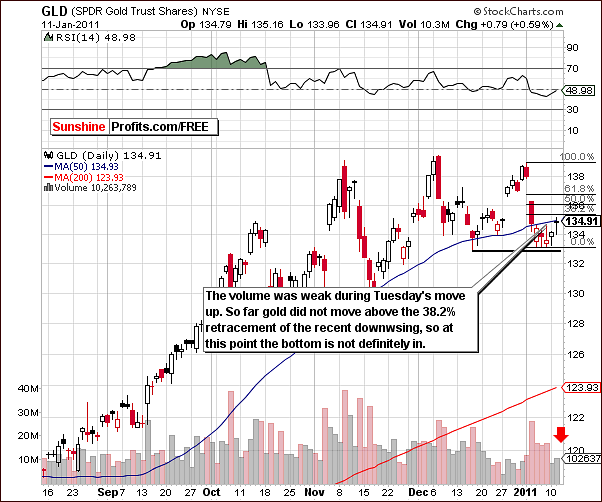
In this week’s short-term chart, featuring the GLD ETF, we actually do have a slightly bearish indicator. In recent days, higher prices have been accompanied by lower volume levels. Whereas in previous weeks, the low volume could be attributed to holiday factors, current volume levels are no longer affected in this way. Volume levels should be higher if the price moves, which are taking place are sustainable.
In the days ahead, further price increases of $5 to $10 on significantly lower volume may cause us to issue a Market Alert advising to close long positions and/or open short positions. We do not however advise any such move at this time.
Summing up, the signals this week are predominantly bullish, although a bit of bearish sentiment prevails when viewing the short-term chart. Going with the majority of this week’s market signals, we remain bullish for the short to medium-term.
Silver
As with gold, we first view silver from the very long-term perspective, which allows us to determine the validity of our sentiment. Silver’s volatility has been a drawback in the past. In 2008, when the white metal’s price moved below $10 per ounce, its volatility was considered quite negative. During the past few months and likely going forward, however, this volatility could actually be a positive factor in silver’s price action.
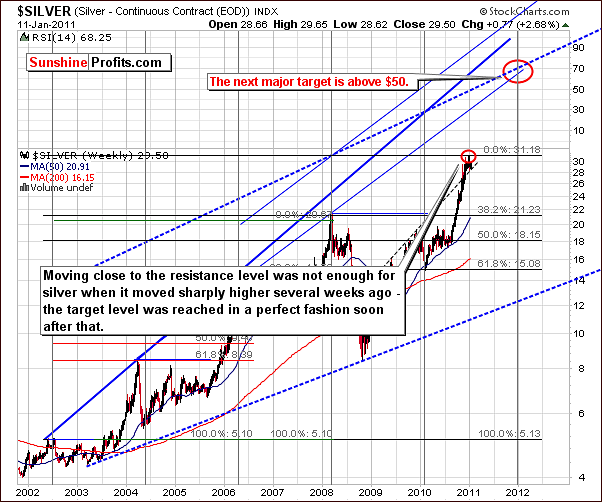
Analyzing previous price extremes, it appears likely that silver’s price will move to substantially higher levels. Although the $60 to $70 level is possible, we prefer at this point to state that silver will likely move “above the $50 level”. Based on analysis of previous cyclical turning points, it appears that this target level will likely be attainable towards the end of 2011 or early in 2012.
Keeping a long-term perspective in mind, it truly doesn’t matter if silver’s price moves higher now and corrects later or a correction is seen now to be followed by higher prices. In short, silver’s price truly does seem likely to move much higher and the long-term outlook is very bullish.
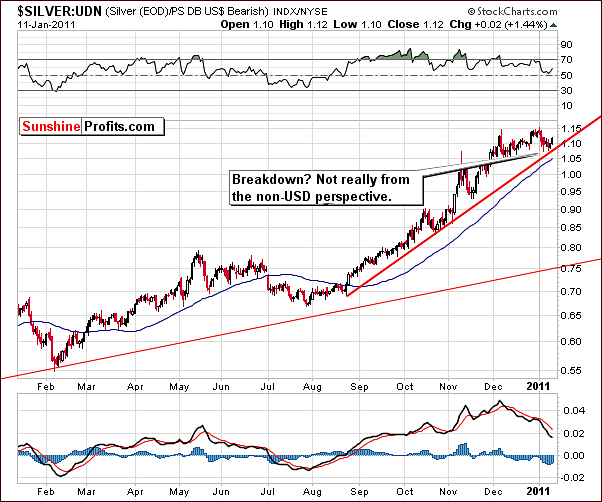
From the non-USD perspective, the trend for silver appears bullish as well. Since late August of 2010, this ratio has trended strongly upwards. In all, the gain has been close to 60%. Current ratio levels have moved along the trend line, touched it on occasion, and remained above it.
The trend has not been invalidated yet and thus is likely to continue. A breakdown along with verification of such a move would be required to invalidate this current trend. Lacking this development presently, we expect to see higher prices going forward and an uptrend in this non-USD ratio as well.
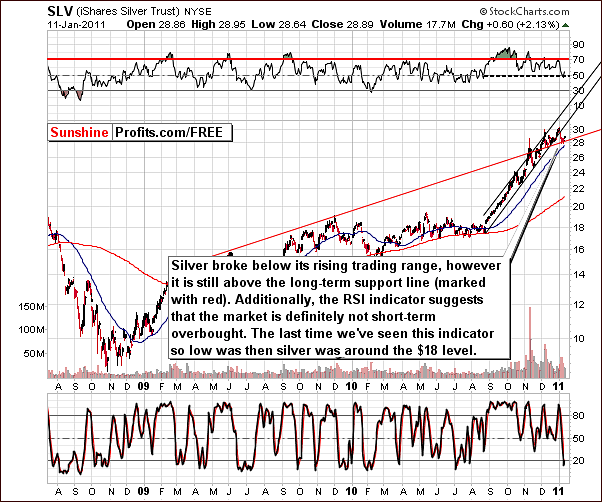
In this week’s long-term chart, silver’s price is seen to have moved below one rising support level only to be stopped by another, even more important one. Overall analysis of recent price trends, support and resistance levels taken together yield a bullish sentiment going forward.
Summing up, not much has changed in the past week. Volume levels have been rather low but this is very much in line with prior periods of rising prices following local bottoms. For this reason, the low volume levels do not create a bearish sentiment for the period ahead.
Platinum
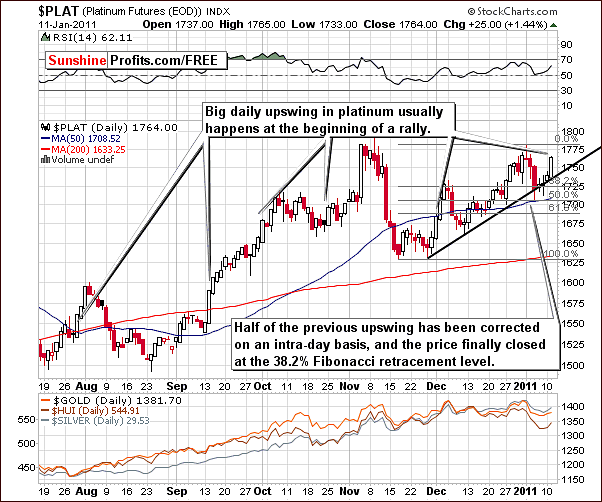
In the chart for platinum this week, an important development was seen on Tuesday. A significant price rise close to 1.5% was seen in a single day’s trading and this is often the predecessor of a big rally. Indications are that platinum will see higher price levels soon and this expectation can also be applied to the other precious metals and mining stocks as well.
Mining Stocks
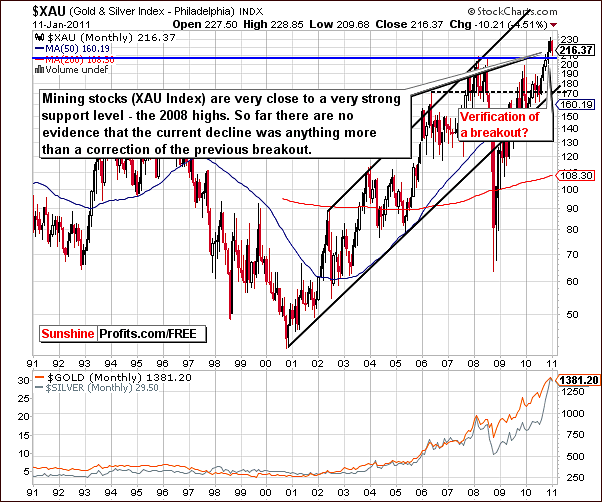
The XAU Index of gold and silver mining stocks this week clearly illustrates how index levels are currently above the important support line created by 2008 highs. The decline seen this week is likely a simple correction of the previous breakout and a part of the verification process.
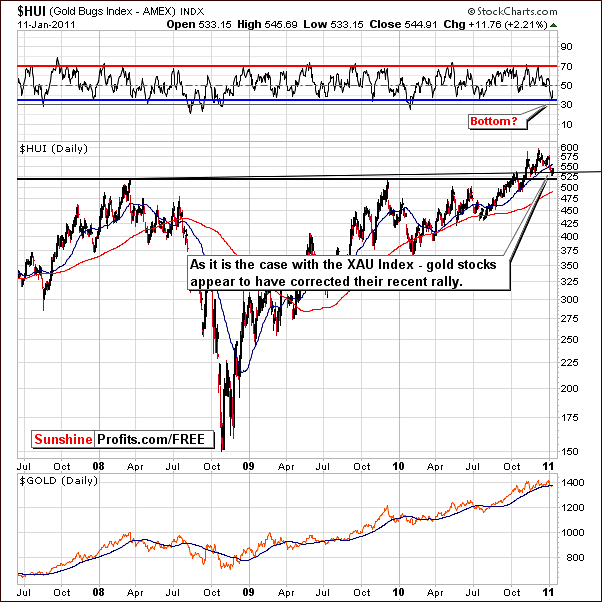
In the HUI Gold Bugs Index chart, we also see a verification of a previous breakout in progress. At this time, there is no evidence justifying a medium-term bearish sentiment. Although the index level recently declined below the first of the two important support levels, it has quickly moved back above this level and the move below it appears to have simply been a form of correction of the recent rally. Finally, RSI levels appeared to have bottomed and are now on the rise once again. Taking all these factors into consideration, the outlook appears slightly bullish.
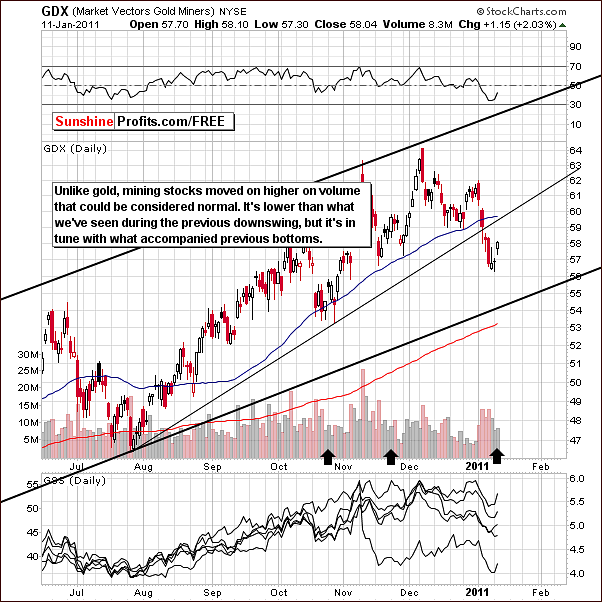
The GDX ETF chart, a proxy for the mining stocks allows us to analyze volume and verify points made earlier. Recall that in the GLD ETF section, we discussed the bearish implications of small volume levels. Here however, the low volume levels are quite similar to those seen around previous local bottoms. The fact that earlier recent declines were accompanied by volume levels greater than what we now see therefore does not lead to a bearish sentiment at this time.
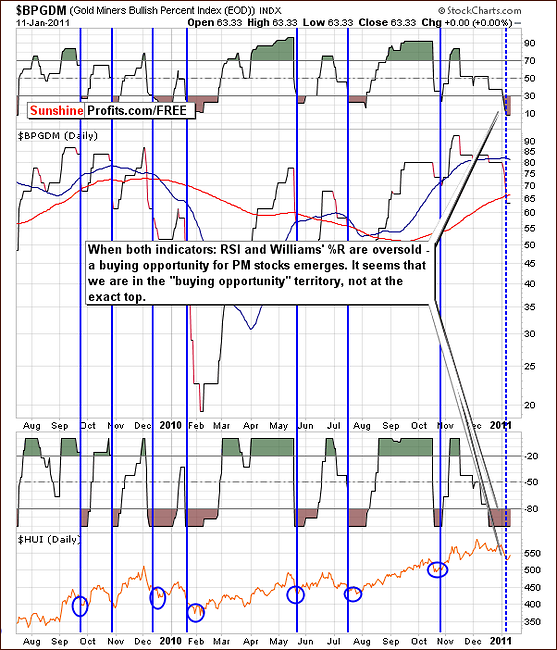
Again this week we have included the Gold Miners Bullish Percent Index. As a reminder, its definition, taken from last week’s Premium Update is “a market breadth/momentum indicator and is calculated by dividing two numbers: the amount of gold stocks on the buy signal (according to the point and figure chart, which emphasizes strong moves while ignoring small ones) and the amount of all gold stocks in the sector.”
Both the RSI and William’s %R point to an oversold situation at present. This indicates a buying opportunity, and has been particularly reliable in the past. Therefore, it's a very bullish indicator for gold stocks today. Higher prices are quite likely in the weeks ahead for gold mining stocks.
Summing up, the situation in mining stocks appears bullish at this time. Volume levels have been low in recent days but this is consistent with historical trends when mining stocks are near their local bottoms. It seems in short to be nothing more than a verification of the previous breakout.
Letters from Subscribers
This week we have received interesting question about using fractals to analyze the gold market. One of our Subscribers spotted information based on such analysis and asked us if it's possible that gold reached its top recently and will retrace all the way down to the major 38.2% Fibonacci retracement level of the whole current bull market, which would be around $980.
This question happens to coincide with the research stage on our new tool - a fractal model of prices. Although the tool is far from completion, we used some of the gathered data to analyze the current situation in the gold market. It turns out that for the last month the estimate of the fractal dimension exceeds 1.8 (something that ranges from 1 to 2; 1 denotes a simple line trend whereas 2 denotes a fairly complicated price structure). This means that the market is not likely to follow a line trend at the moment. Instead it is likely to drift sideways. A significant break of this pattern is yet to be identified. These results are confirmed by our new tool (yet to premiere, but we have posted some results in June 8th, 2010 Premium Update) - the seasonal charts as these charts suggest that a short-term decline is not likely to start until the first days of February. For the time being, we would be also skeptical about the possible drop to $980. It's not that it couldn't happen - it's that we don't find it likely. Taking both factors mentioned in this section into consideration, we currently do not see significant fall in prices likely to occur before the beginning of February. Of course, we will keep you updated.
Summary
The USD Index appears to be heading upwards to a target level of 83. The opposite is true for the euro, which is expected to move below a final support level, perhaps declining to 120. This would provide an even greater bullish outlook for the USD Index.
The influence upon precious metals from the currency markets is slightly bearish in a direct manner but indirectly there appear to be two bullish factors worthy of consideration, namely historical trends and the recent pattern of the USD Index leading gold. Overall, the influence primarily from the USD Index leads us to a slightly bullish sentiment for gold, silver and mining stocks.
The general stock market has had no meaningful influence on the precious metals (with the slight exception for silver) in the short-run. Gold itself provides several bullish signals with volume levels of the GLD ETF being the only bearish indicator. Since this has not been confirmed by mining stocks or the GDX ETF, it is pretty much disregarded and our sentiment for gold remains rather bullish.
The outlook could change dramatically if higher precious metals prices are seen in coming days on visibly lower volume. Sunshine Profits will watch for this invalidation and advise Subscribers accordingly. Only small long positions are justified at this time and long-term holdings should be kept intact.
Our next Premium Update will be back on a normal schedule and be published on Friday, January 21, 2011.
This completes this week's Premium Update.
Thank you for using the Premium Service. Have a great weekend and profitable week!
Sincerely,
Przemyslaw Radomski

