
Last week we listed some of the risks that investors may face in 2011. There were so many, however, that we didn’t want to inundate you all at once. So, this week we are listing the rest of the risks. Forewarned is forearmed.
Slowdown in China
Emerging market economies continue to grow, but that poses risks of inflation. China remains the 800-pound gorilla, with economists wondering how it will manage its rapid growth. Inflation in China is 5% with a targeted inflation rate of 3%. If China does not curb growth, inflationary pressures are going to pick up across the emerging world. Inflationary pressures will force some emerging economies to implement more capital controls and put upward pressure on interest rates. Expect growth to cool off somewhat, as the emerging markets grapple with inflationary forces. Precious metals are a classic hedge against inflation.
Social unrest
This year we are likely to see social unrest, demonstrations and riots as increasing food prices will send thousands to the streets. We have already started the year with the uprising in Tunis and the toppling of its President after 23 years of authoritarian rule. Other Arab dictators have taken notice and are worried that the Tunisian revolution could be the catalyst of rebellion and unrest across a region troubled by Iraq, Islamic extremism, the Palestinian-Israeli conflict and the malignant influence of Iran. Tunis may go down in history as the Arab equivalent of the Polish Solidarity movement in 1980 that sparked wider protests that ultimately led to the collapse of the Soviet Union and its empire.
The events in Tunis followed riots in neighboring Algeria a week earlier over soaring food costs. The violence erupted after deep anger at increases in prices for basic goods, some of which have risen by as much as 30 percent since January 1st.
Keep in mind that if rising food prices irritate the West, they can cause starvation in much of the rest of the world. Global food prices have just hit a new high. The rising cost of food will cut into consumer spending in markets where food makes up a big part of daily living costs. Australia’s wheat crop is down by 10%, but the bulk of it has been so damaged by the worst rain in a hundred years. Throw in drought in Russia, severe drought in Argentina, floods in Brazil and Venezuela, odd weather in the agricultural parts of China, and you get rising food costs all over the world.
In the developed world government overspending and social benefits has left many citizens with a sense of entitlement which will make austerity measure hard to swallow. We saw evidence of that in the Greek and French protests and rioting last year. We can expect more social unrest in 2011. Where there is unrest, people turn to gold.
Speaking of gold, according to the French Le Monde newspaper, Tunisian's first lady may have fled the country with 1.5 tons of gold bars, worth about 45 million euros. (Must be nice to have your own set of keys to the country's Central Bank vaults.)
Hyperinflation
Sovereign debt across the West is past danger level and it won't take much for people to lose confidence in their currencies and start trading them for anything of value (gold?) There have been cases in history where people had to load up wheelbarrows filled with currency to buy bread. Several weeks ago in the Premium Update we discussed the risk of hyperinflation in depth.
Hyperinflation has a single cause: It occurs when a government cannot borrow money because its debt has risen so much that investors believe they will never be paid back with close to the same purchasing power. As a consequence of this flight of confidence, such a government is forced to print money to meet its obligations. This further undermines the value of its currency, often culminating in a frenzied collapse. A nation needs to inspire a lot of confidence to keep that Ponzi scheme alive. Unfortunately, markets know that even the U.S. government will print money to meet expenses when necessary.
Hyperinflation can only mean amazing gains for precious metals.
War in Korea, or Iran, or Pakistan, or the Middle East
We certainly hope war will not take place anywhere in the world and we pray for peace. But nevertheless, it’s always a real risk. We don’t have to tell you what war in any of the places will do to the price of precious metals and for that matter--oil.
European Sovereign Debt
Italy, Spain, Belgium, and Portugal will need to raise over $800 billion this year to cover rollover debt and new borrowing. If you add in Greece, Ireland, and a few other countries, pretty soon you're talking serious money, a trillion or so. Belgium is problematic with a growing cadre of citizens who want to divide the country. To get in in-depth look at thee a Euro-mess we recommend you read Paul Krugman's excellent magazine piece at the New York Times on the prospects for Europe and the euro. Its title is "Can Europe Be Saved?" The question remains unanswered.
On another note, the London Bullion Market Association conducted its annual survey of leading analysts to ask them where the price for gold will go in 2011. A total of 24 contributors gave their estimates for the high, low and average price for 2011 for gold, silver, platinum and palladium. In 2011, Forecast contributors predict rises for all precious metals. Their average gold forecast is US$1,457, a 19.0% increase on the 2010 average price, similar to the forecast of $1,450 made by delegates at the 2010 LBMA Precious Metals Conference in Berlin last September. Analysts predict that the average silver price will be $29.88, a 48.0% rise on the 2010 average price. The average 2011 Platinum price is forecast to rise 12.6% from the average 2010 price, to $1,813 and palladium shows no sign of slowing down with an average 2011 price prediction of $814.65, a 54.8% increase on last year’s bumper average price.
To see if all those London mavens will be right this year, let's begin this week's technical part with the analysis of the Euro Index. We will start with the short-term chart (charts courtesy by http://stockcharts.com.)
Euro - USD Indices
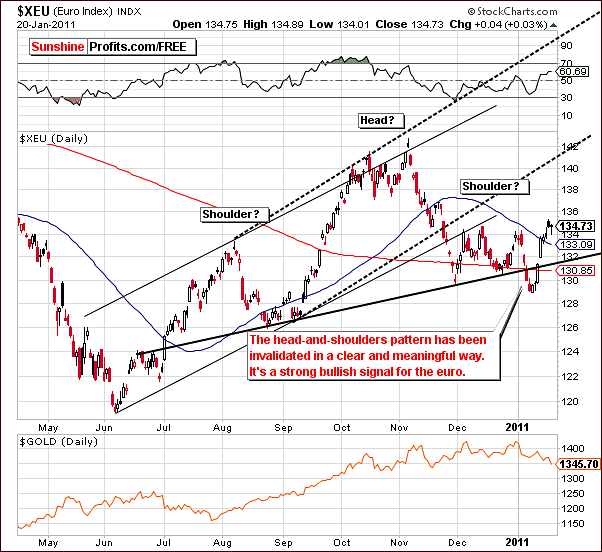
The bearish head and shoulders pattern, which has been developing and much discussed in previous updates, has clearly been invalidated. This is a very important development and has direct implications upon other markets, most notably the USD Index.
The invalidation of a bearish pattern is a strong bullish indicator for the Euro Index. The recent decline was reversed and the subsequent move up was made with vengeance. As we will see in later sections, this has bearish implications for the dollar and also for the precious metals sector, which has been following the dollar in recent weeks.
Summing up, the Euro Index made an abrupt turnaround this week and did so with some authority. This reversal immediately impacted the USD Index and may very well carry over to stocks and metals as well.
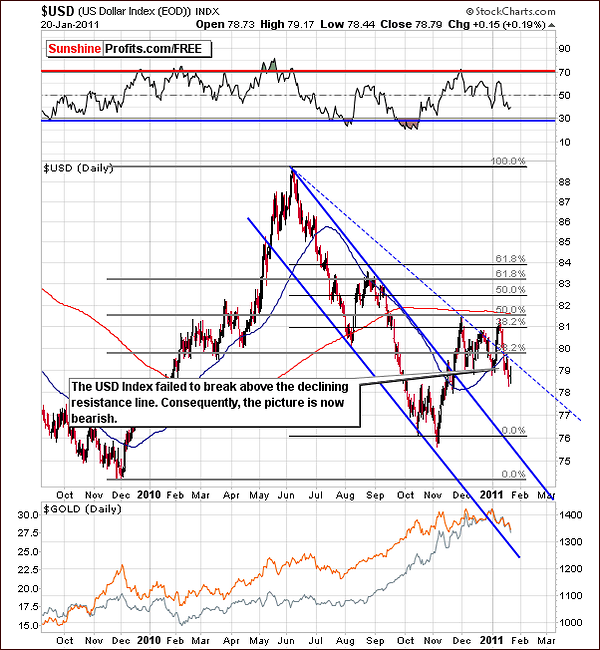
In this week’s long-term USD Index chart, we see a major development with index levels moving below the declining resistance line. Although the move lower has not yet been verified, it is an invalidation of the previous breakout and is a very bearish signal for the dollar.
The RSI is not presently at true oversold levels and further weakness could very well be seen. All-in-all, this chart is clearly bearish with no real bullish indicators visible at this time.
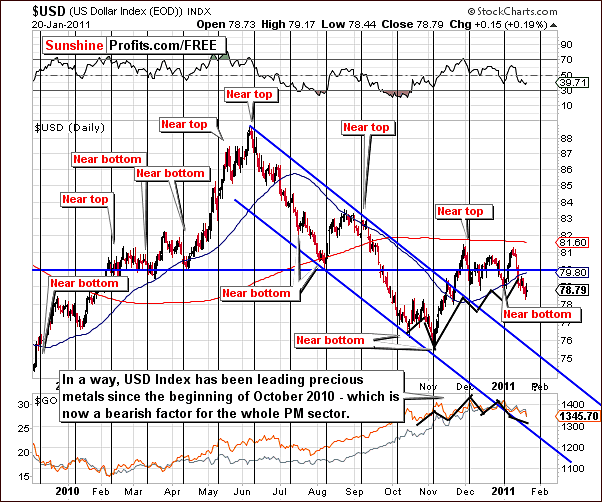
In this week’s short-term USD Index Chart, it does not appear that the final bottom is in yet. This is based on the cyclical turning points and it seems likely that some sideways movement may be seen in the days ahead. In other words, since dollar is not close to its cyclical turning point it and it has just moved lower, it is unlikely that a quick move higher is going to be seen here – such move would mean the USD Index is at a local bottom right now, and that is not very probable as the cyclical turning point is over a week away.
Summing up, the USD Index reversed its direction last week and this week the sentiment has turned bearish. Further declines or sideways movement appear likely in the days ahead. This, in and of itself, is an indirect bearish sign for gold, silver and mining stocks. As we discussed in last week’s Premium Update, the USD Index has been leading the precious metals sector in recent weeks. Therefore, the recent decline seen here is a bearish signal for the metals sector.
General Stock Market
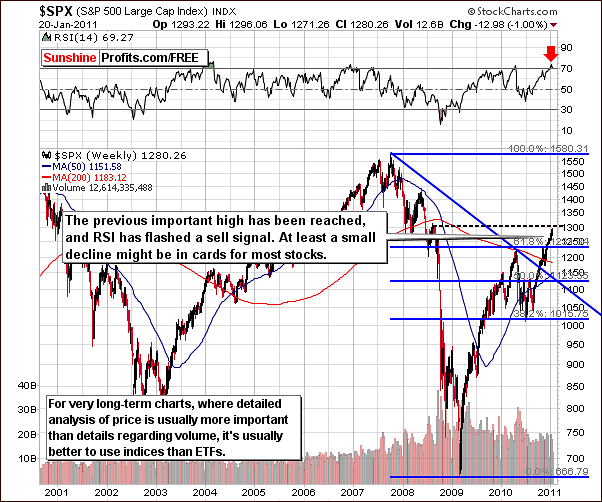
In the very long-term S&P 500 Index chart this week, we see that an important resistance level has been reached. This is equal to the late 2008 high, which was followed by a quick severe decline. The price action, which followed this high towards the end of 2008 and this 1,300 level itself are therefore important factors (from the psychological point of view) from which some possible 2011 projections can be made.
At this point we would like to digress a bit. One might ask - why does the previous high make a resistance level? The answer is that people tend to see trades in only two ways – win or loss. Most people would see bigger difference between winning $1000 and losing $1000, then between losing $6000 and losing $9000. That is because in the first situation one is faced either win or loss, and in the second situation is a loss either way. Still, the second situation is more important, because the difference between two outcomes is 50% higher ($2,000 vs. $3,000). The vast majority of Investors and Traders originally became Investors and Traders to make money; however most people ultimately find it more important to feel that they are winning than that they make money. In this case, most people would consider the difference between $-1,000 and $1,000 as more important than the one between -$6,000 and -$9,000.
Another way to put it is to take a look at the question that Investors and Traders sometimes ask – I agree that the market is going to move lower, but my speculative long position is at a loss, so should I sell? The answer is – of course – if you think the market is going to move lower than you should close your long position, period. How much weight should one put to the fact that the position is already at a loss? None. If one believes the market is going lower, then ones loss would turn into a bigger loss – and why would anyone even consider wanting to have a bigger loss?
The real answer is that because that it requires one to admit that the position that one has previously entered turned against them. One feels responsible for it and wants it to be closed at a profit. What one fails to realize at this point, is that the same position could be re-opened at lower prices, which would make it even more profitable in the end. Again – one often takes into account the win/loss psychological factor instead of calculating profitability of each action.
Consequently, one maximizes the times that they are holding a winning position, but not their overall rate of return. For instance it’s better to lose $10 and gain $110 than to gain 20$ two times.
The abovementioned phenomenon alone makes the previous highs and lows important resistance/support levels. Many investors but at the top or very close to it (that’s why we usually see strong volume at/close to local tops), and once price declines they never sell – waiting to close their position at no loss whatsoever. Consequently, they sell when price moves to the previous high, since it is their purchase price. So, many Investors/Traders, who purchased stocks in August and September 2008, were waiting for the price to reach the price levels that we have just seen, in order to sell their stocks. This strong selling pressure is naturally a bearish factor.
Getting back to today’s situation - the RSI level is above 70 and this overbought status suggests that at least a short-term consolidation is likely. The Hindenburg Omen, which is a long-term bearish signal, seemed to have appeared recently.
Without going into details - this is a rather sophisticated technical indicator that is based on the number of stocks that formed a new 52-week high, and that reached a 52-week low. Other exchanges can be used, but typically NYSE is. The idea is that when there is a large number of both new lows and new highs on the market, then there is a high probability of a big downswing in the market in the following several weeks/months.
We have seen that signal previously, and we wrote about in the August 27th, 2010 update. At that time, however, stocks did not plunge as expected. This may be avoided once again as we go forward from here. Still, since at least a small move back to the levels of 2010 highs seems to be probable based the previous high being reached, the Hindenburg Omen provides a confirmation.
Speaking of confirmation, we have interesting situation in other stock indices where non-confirmation is – in fact – a confirmation of the previous points. Let’s take a look below for details.
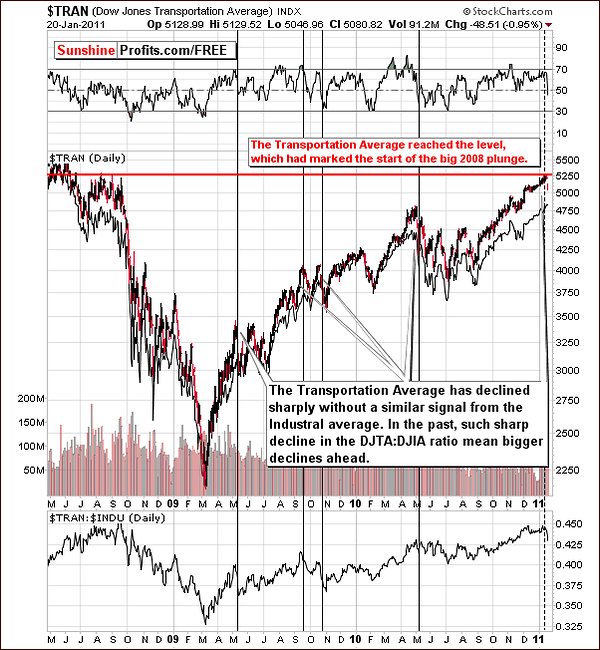
According to the classic Dow Theory the signals form the industrial average should be confirmed by the ones seen in the transportation average. Without that a signal does not mean much.
Here, we are using this divergence in a slightly different way. In the past few days we have seen a sharp decline in the Dow Jones Transportation Average, without a similar action in the Dow Jones Industrial Average. In order to isolate this relative phenomenon, we have included a transportation:industrial stocks ratio below the price chart. Here, we clearly see that the ratio moved quickly lower recently.
Since this signal is quite clear, let’s take a look what it meant in the past. The fact is that in the past it was an early warning about the coming decline. In the past, declines such as this were seen to continue for days or even weeks. The implication here further confirms the short-term bearish case for stocks.
Summing up, the outlook for the general stock market is bearish for the short-term and perhaps medium-term. The impact on precious metals will be discussed in the following section.
Correlation Matrix
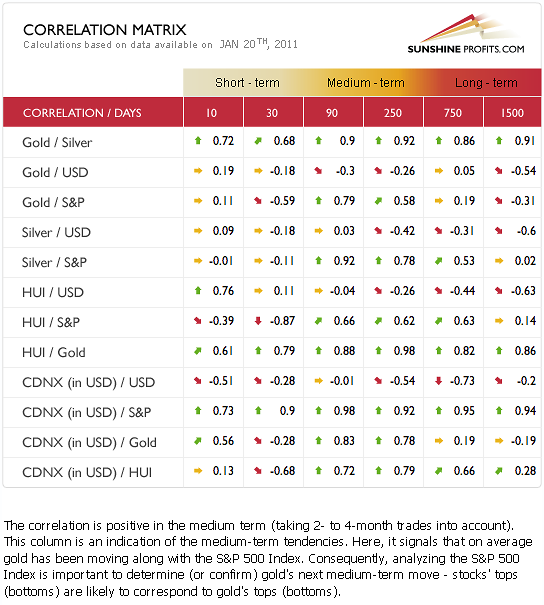
In this week’s Correlation Matrix, the short-term coefficients are not as significant as in weeks past. There appears to be a slight negative correlation between metals and stocks but this does not hold true for silver.
It seems that the medium-term coefficients (90-day and 250-day columns) are of more value at this time. Recent breakdowns have been seen in many of the markets this week but in most cases have not yet been verified. The situation is such that if these breakdowns are verified in the days ahead, the impact will likely be felt for weeks and therefore the medium-term columns will provide valuable insight.
Only the general stock market appears to have a significant influence on the precious metals for this time-frame. Therefore, if stocks decline from here, the same will likely be seen across the precious metals sector for they will be dragged down as well by the declining stock prices. Although the relationship is not clearly seen on a day-to-day basis (short-term correlation is weak), the bigger move in stocks is still likely to have influence one the precious metals sector.
Summing up, the most important influence upon precious metals this week seems to be the general stock market and the outlook for stocks appears bearish. An additional indirect influence comes from the USD Index and the sentiment here is bearish as well.
Gold
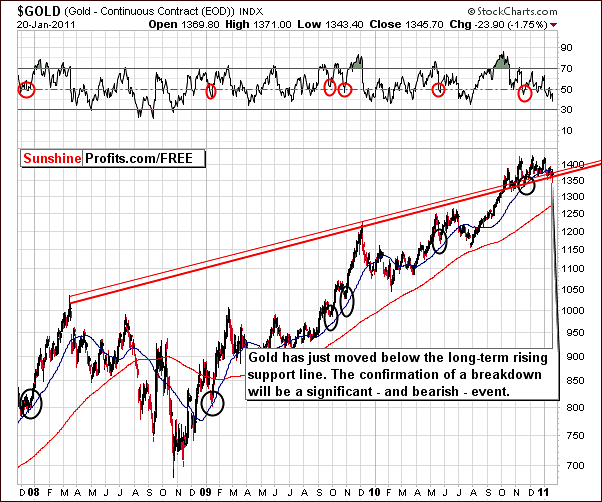
The very long-term chart for gold this week shows a key breakdown below the long-term support level. Price has declined below the 50-day moving average and slightly below the rising support line. This latter breakdown however has not been verified. Three days below this previous support level are generally required to verify such a breakdown.
Should a small insignificant move back up to this level be seen with a failure to move beyond it, it may very well be a signal to open short positions. This will be watched closely in the coming days.
Before moving to the following chart, we would like to digress once again. In the recent several weeks we have seen several moves lower, and mentioned several verifications that are needed. At this point one might get an impression that no signal is meaningful if we require verifications over and over again. That is not the case usually – the point is that we are in a situation where big trends can change, and this could impact the long-term holdings in a meaningful way. Selling long-term holdings is an important decision and should be utilized only at particularly favorable (or unfavorable, if you prefer to view it this way) conditions. It is these verifications and confirmations that provide us with enough certainty that a bigger move lower or higher is in the cards – that’s why we have been mentioning them so often recently.
Having said that, let’s take a look at gold from the non-USD perspective.
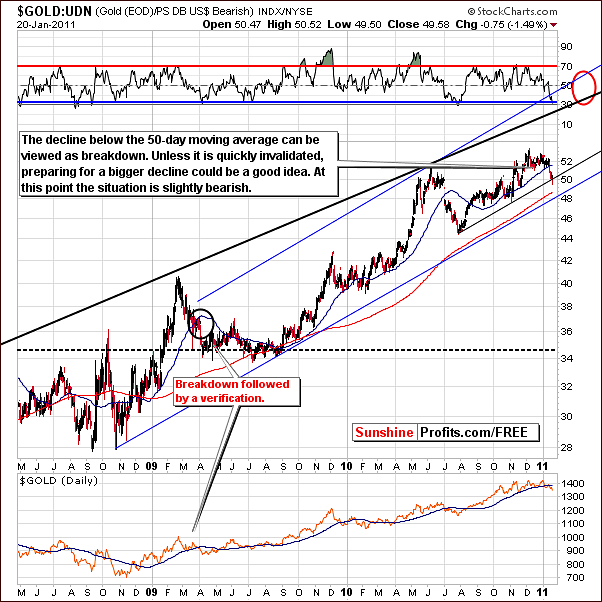
From a non-USD perspective, it is clearly seen that the 50-day moving average, an important support level, has been broken. At this point, it seems that a retest of this breakdown could be seen.
Nearly two years ago, in March of 2009, we saw a similar decline followed by a sharp move up and then further declines. Similar price action was seen at that time on the USD side as well. A repeat of this pattern would lead to slightly higher prices soon and perhaps allow an exit at a more favorable price level. We will let you know, should that take place.
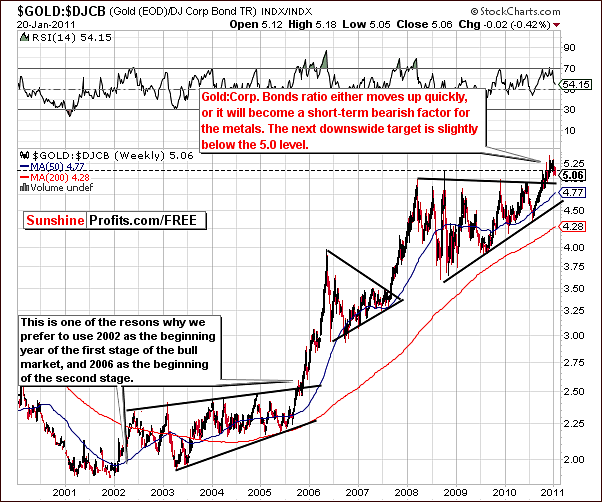
This week’s chart of gold to corporate bonds ratio shows a failure for the ratio to hold the level it has just broken above. This is a bearish indication and it’s likely that this ratio could move below 5.0, perhaps as far down as 4.6. This would mean approximately $100 decline in gold.
Verification however, is still needed and waiting for confirmation of moves such as this in any market, index level or ratio is critical. It is important to keep this in mind and not follow sharp moves in either direction without first seeing a verification of the move.
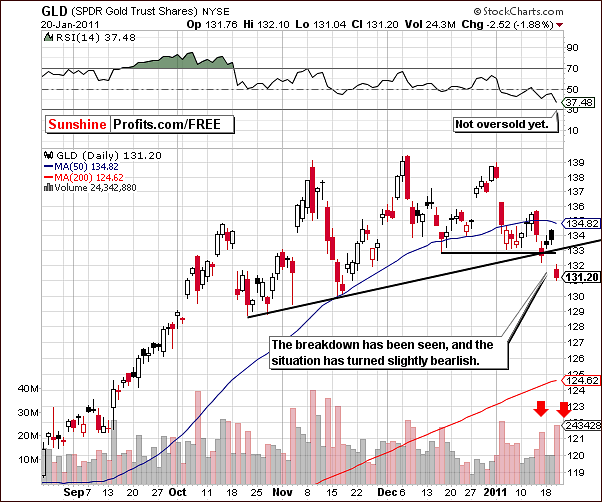
From a short-term perspective, we see that daily volume levels are providing yet another bearish signal at this time. Lower prices have been accompanied by high volume and higher prices with low volume. Although volume levels have not been extremely low, they have been less than those accompanying price declines.
If the index level moves slightly higher on volume that is even lower than the one seen during previous daily upswings, say to $133 in the GLD ETF, which would be about an $18 increase for spot gold prices, this would likely lead us to issue an alert to short gold.
Summing up, in the coming days, there is a good possibility that gold’s price action may warrant selling some of one’s long-term holdings. This situation is not bearish enough at this time, however. We will continue to watch the situation closely.
Silver
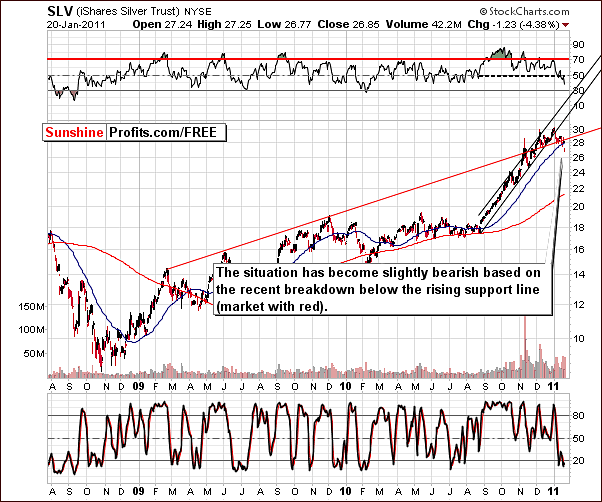
This week’s long-term chart for silver shows price action similar to that seen for gold. There has been a breakdown below the long-term support level which has not yet been verified. This is a slightly bearish signal and, if verified and seen in other precious metals markets, will likely result in silver prices declining quickly as well. As we have often mentioned in past updates, silver is the least predictable of the precious metals and often follows the trends set by gold and mining stocks.
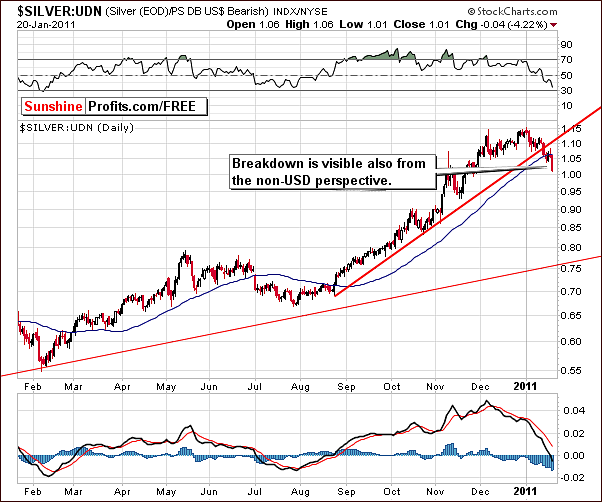
From a non-USD perspective, a breakdown is clearly visible this week. A small verification has actually been seen although the move below the 50-day moving average, which was seen on Thursday, has not yet been verified. Once this final verification is seen, we could see a decline similar to what has already taken place in the past weeks.
As it is the case with the gold market, a quick reversal on low volume will be an indication that lower prices will follow. If this is indeed seen, a bet on lower prices may very well be in order and a suggestion in this direction will be provided at that time.
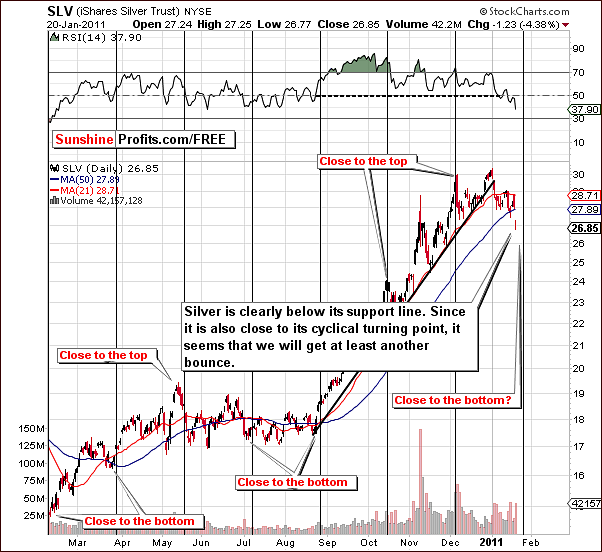
In this week’s short-term chart, indications are that even though breakdowns have been seen, a temporary move up seems probable. This is based upon cyclical turning points and the likelihood that the next one is very close. It seems probable that lower prices would follow soon thereafter. Within the several following days, slightly higher prices are expected.
Summing up, silver’s price has moved below important support levels in a manner quite similar to that seen for gold. This is a slightly bearish signal at this point in time. It is not however, bearish enough for us to advise selling one’s long-term holdings or for opening short positions yet.
Mining Stocks
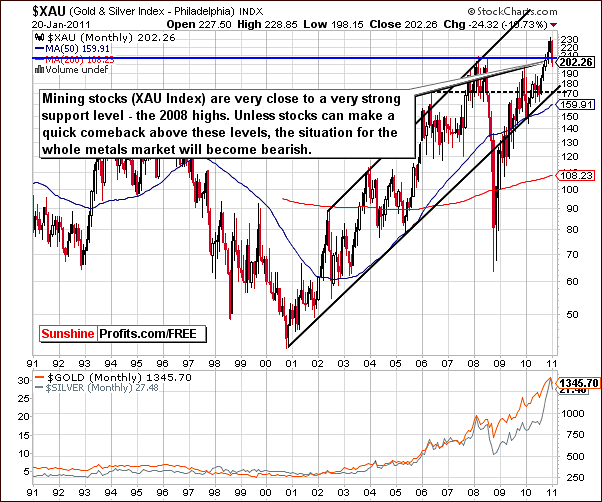
The XAU Index of gold and silver mining stocks saw a decline in excess of 10% since the beginning of the year. The previous increases have failed to hold the breakout above the 2008 highs, and at this moment the price is below this particular level. A move back to the 2008 highs will verify this recent breakdown. If this does indeed happen (mining stocks fail to move quickly above this level), further declines will be likely and perhaps a bet on lower mining stock prices would be in order.
Until this is seen, speculative positions should not be entered and long-term holdings should remain intact. If the big decline does come to pass, the XAU Index levels will likely move down close to 180 and nearly to the lower border of the rising trend channel.
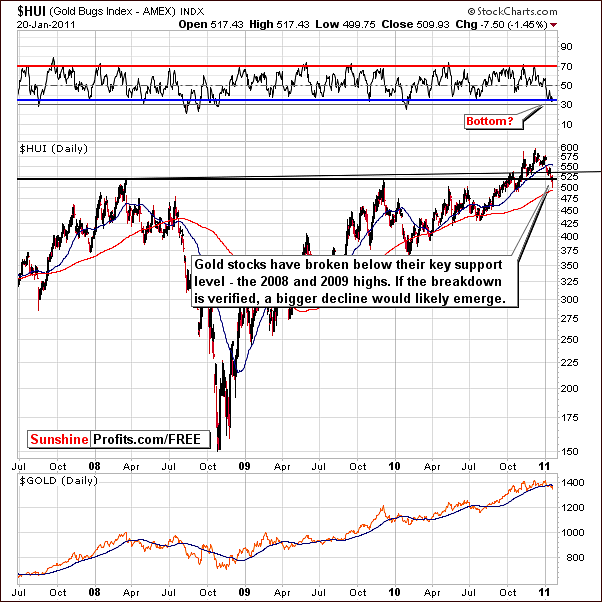
In this week’s HUI Index chart, we see that index levels have moved below 2008 and 2009 highs. Furthermore, a slight move below the 500 level on an intra-day basis was also seen. The important point here is the breakdown below previous highs. A move back up to but not above the level of these highs would be a strong indication that further declines would likely be seen. The RSI, which is already at oversold levels, points to a quick bounce being very likely.
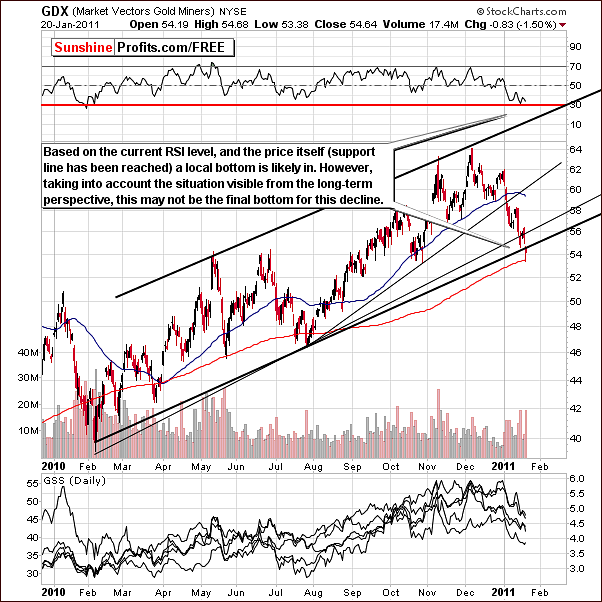
Here, in the GDX ETF chart, the RSI also indicates that a slight bounce to higher levels may be seen soon. One year ago, there was a similar oversold situation which coincided with a local bottom. It appears one may be close at hand right now.
Additionally, one could argue that the November, December highs along with 1st January create a head-and-shoulders formation (which would be confirmed by the volume here), and if we consider it as a fact, the target based on this formation has just been reached. The height of the head – meaning December top ($64) minus the neck level at that time ($58) = $6 - is more or less how much the mining stocks declined after moving below the neck level (at $60 at the beginning of January), which is how targets are constructed based on this formation.
Either way, only aggressive Traders should bet on higher prices at this time. Due to the overall situation in all metals (bearish medium-term signals in form of breakdowns), such action is not recommended for most Traders today.
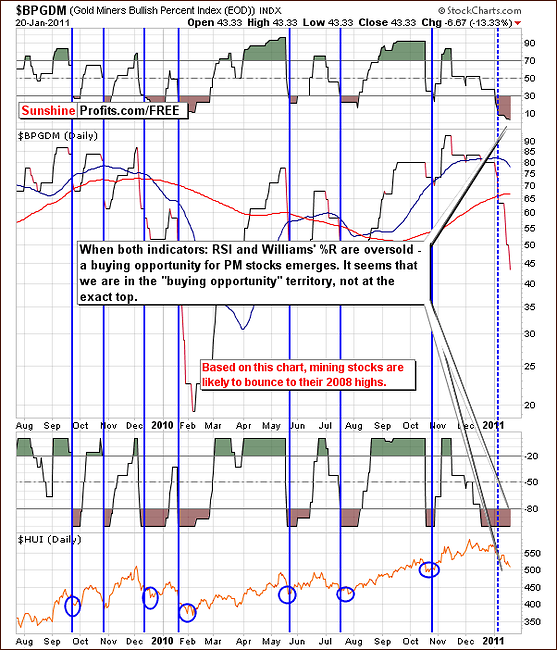
In this week’s Gold Miners Bullish Percent Index chart, both: RSI and Williams’ %R indicators continue to show an oversold situation. This has been the case for a few weeks now. Consequently, it appears that mining stocks are oversold on a short-term basis and a rebound is likely. This bounce may take the mining stocks back to the levels of the 2008 high.
Summing up, if we see higher prices for mining stocks, which appears likely, and this increase is stopped by the level of the 2008 highs, this would be a strong indication that lower prices for the whole precious metals sector could soon be realized.
Letters from Subscribers
Lately we have received question about the Elliot Wave pattern analysis and asked why we don't use it and also asked if we are under another Hindenburg omen.
We have discussed possible H&S formation earlier in this Premium Update, and that was also the case with the Hindenburg Omen, which leaves us with the Elliot Wave theory here.
In fact, we have explained why we don't use the Elliot Wave Theory in our Premium Updates some time ago:
The Elliott Wave Theory is a part of the technical analysis, and as such it is more of an art than of a science. Therefore, it is impossible to prove that it is either good or bad for any market. I have personally not found it particularly useful. When gold broke through the $400 level I remember many Elliott Wave analysts writing about imminent correction to the $200 area, which never happened. I understand that these wave patterns often do occur, but I found them easy to spot and reliable only in hindsight. Of course EW analysts have more experience in reading these waves and I don't claim to be an expert on that field.
Since that time we have not changed our opinion on this particular technique. By the way, when we mentioned it previously back in April 26th, 2009 Premium Update, it was because Subscribers asked us if it is possible for gold to move down to $650 really soon, as that was what many EW analysts predicted. It turned out that it was very close to the bottom, and lower price levels were never reached since that time. Our comment at that time was:
I respect the Elliott Wave theory and people using it, but I would not recommend waiting with one's long-term holdings for a not-very-likely plunge. What if it does not materialize? It's very easy to get "all emotional" about any market while trying to time it with a very large (on a percentage basis) amount of money. This alone is dangerous, as it often makes one wait for the big (or at least small) pullback for the whole upswing and finally "give up" right at the top. Therefore, even if you decide to wait for gold to plunge to $650, I would suggest waiting with only a (speculative) part of your capital.
Summary
The Euro Index and the USD Index reversed their directions this week. This is bearish news for the precious metals sector on the whole. Breakdowns have been seen in a number of markets and indices with virtually none having yet been verified. Much depends on the price action of the next few days which will determine the validity of recent downturns and perhaps warrant a few Market Alerts to guide our Subscribers to profit opportunities.
Given the size of the potential move in either direction from here, one should focus on factors influencing precious metals in the medium term – and at this point it is the general stock market. The bearish sentiment which now prevails for stocks is therefore likely to have a negative influence on gold, silver, and mining stocks.
Long-term positions should be kept intact at this time, as the recent breakdowns, which are in the process of being verified could be invalidated as well. The risk is simply too high at this time but a number of opportunities could arise in the week ahead.
Only aggressive Traders should enter the market with speculative capital with a bet on a quick bounce to the upside.
Our next Premium Update will be on a normal schedule and be published on Friday, January 28, 2011.
Thank you for using the Premium Service. Have a great weekend and profitable week!
Sincerely,
Przemyslaw Radomski

