
Although the picture this past year has been bleak, there are plenty of bright spots around the world. We touched on this point in one of our recent essays, and we would like to elaborate further. In economic terms, this decade was very kind to countries like China, India, Brazil and Indonesia. If you exclude the U.S., they also happen to be the four most populous nations in the world (The U.S. ranks third.) Together, they account for more than 40 per cent of the world's population. All four countries have made remarkable progress this decade in terms of economic growth and standards of living.
In any given year, an extra percentage point of economic growth may not seem like such a big deal. However, if taken over a longer period of time, the difference between an annual growth of 1 percent and 2 percent will determine whether the standard of living is doubled every 35 years, or every 70 years. A 5 percent annual economic growth means that living standards will double about every 14 years. By the way, the above calculations can be easily approximated by the "rule of 70" which says that if you want to know how many years it takes for the GDP to double you take 70 and divide it by the growth rate (in percentage terms), for instance 2 percent growth means doubling the GDP in 35 years, as 70 / 2 = 35. Although this may sound complicated, the true calculations behind this rule of thumb are not that complex - you will find more information here.
Moving back to the regular part of the commentary, Indonesia had solid economic growth during the entire decade, mostly in the 5 to 6 percent range annually. Brazil also had a good decade, with growth at times exceeding 5 percent a year. China and India have made extraordinary strides.
It seems that the US is losing its privileged place in the world, taking a step backwards, while some of these countries, especially China, are taking a giant leap forward. It was White House Chief of Staff Rahm Emanuel who said about a year ago: "you never want a serious crisis to go to waste." He was on to something. In some cases, the catalyst for setting these emerging powers on the road to economic reform and national resurgence was fiscal and foreign exchange crisis.
For example, in 1978 China was desperately short of cash and Deng Xiaoping was more willing to liberalize the Chinese economy with ideas that promised to deliver faster growth and higher revenues.
India embraced economic reform in 1991 when its government found itself with foreign reserves that were worth just two weeks' worth of imports. The Indians had to send gold to London to secure an emergency loan from the International Monetary Fund.
Manmohan Singh, then finance minister and now prime minister, urged his colleagues to "turn this crisis into an opportunity to build a new India". The rest is history.
The wealthier that countries like China, India, Brazil, Russian and Indonesia will become, the more customers there will be for new innovations and products. Also, from our point of view, there will also be more customers clamoring for gold.
The BRICs - Brazil, Russia, India and China - are gaining power and their economies are growing at a much faster rate than the developed western economies. They achieved the growth by producing and selling products - often in dollars, which is what they have now in their reserves. The BRICs have little gold and find themselves hostage to America's paper money.
India took a step a few months ago and purchased 200 tons of gold from the International Monetary Fund. We expect the others to follow to add to their gold supplies.
If you put all the BRICs together they have more than 2,200 tons of gold, as compared with 8,000 tons of gold that the U.S. holds. The BRICs have 10 times as many people as does the U.S.
Until recently India was the world's largest consumer of gold. This year the Chinese people have proven themselves insatiable for the yellow metal. With the Chinese New Year approaching (The Year of the Tiger), Chinese families are on a buying spree of gold jewelry, gold bars, gold coins and gold ETFs. Chinese mining companies and bullion dealers are all in the grip of the 'yellow' fever.
In fact, everything about gold is booming across China. China today is the largest producer of gold in the world and the country is poised to overtake India as the world's undisputed largest consumer of gold. China is also set to outshine several other countries, including India and the Middle East, to become the world's gold trading ground. China surpassed South Africa as the largest gold producer.
We talked about the BRICS but there are also a few other nations around the world on the rise. Someone has already invented a name for them, the acronym - MAVINS. That stands for Mexico, Australia, Vietnam, Indonesia, Nigeria and South Africa.
Mexico boasts a growing middle class and a healthy population growth trajectory set to reach 125 million by 2020, and then 148 million by 2050. The country is strategically positioned next to the world's largest economy.
Australia, with its rich commodities sources, can provide the building blocks of Chinese growth. It has a well developed manufacturing and services economy plus an enormous surplus of land, if it can only solve its water problem.
Vietnam is a country on the go. It is liberalizing its economy while at the same time benefitting from the near-term political stability and centralized command and control that communism provides. Its population is already larger than France or Germany and will exceed that of Japan by 2050.
Indonesia has come a long way politically and is one of the largest democracies in the world with 240 million people. The country is rich in gas, oil, tin, coal, copper, silver, and our favorite-gold. It is also geographically close to China and India. By 2050 its population is expected to be 313 million people, more than the U.S. has today.
Nigeria, with 155 million people, is the most populous nation in Africa and also one of the most populous in the world. It is rich in oil.
South Africa has modern institutions, vast commodity wealth (gold, platinum, coal, diamonds), and an excellent location at the tip of Africa. Positioned as the gateway to Africa, South Africa will most likely be the continent's financial hub.
That's not it - there is even one more way of describing the developing nations - the Next Eleven (N-11). Wikipedia defines this group as Bangladesh, Egypt, Indonesia, Iran, Mexico, Nigeria, Pakistan, the Philippines, South Korea, Turkey, and Vietnam-identified by Goldman Sachs investment bank as having a high potential of becoming the world's largest economies in the 21st century along with the BRICs.
The verdict is still out on how this past decade will be remembered in history. It all depends on where you lived. What will the next ten years bring? I guess that also will depend on where you happen to live.
Moving on to the technical part of this week's Premium Update, let's begin with gold, which has just moved considerably lower.
Gold
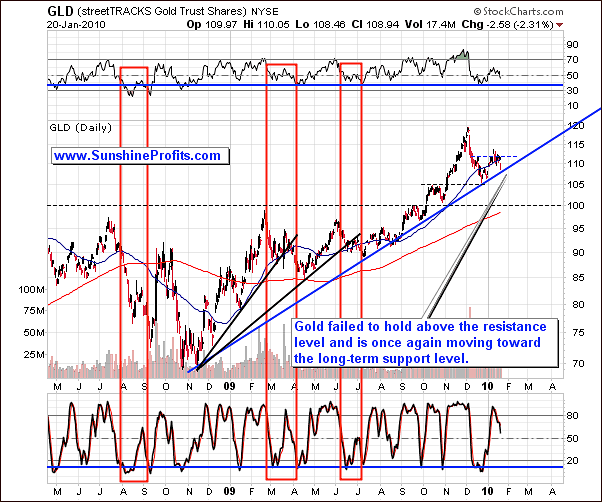
Analyzing the long-term chart before providing short-term details allows us to keep the proper perspective, and helps out to filter out the noise. This time, this approach lets us see that gold is still above its long-term trend line, and the history suggests that it will need to move below it before the bottom is reached. Please note that it was the case during the March-April 2009 downswing and the June 2009 one - we have marked the analogous trend lines with black thick lines. Naturally, the question now is whether the bottom has been already put or not.
The above chart suggests that gold may need to move lower before rising once again. The Relative Strength Index is visibly above the 37-38 area, which confirms the above assumption. The same can be said about the Stochastic indicator - is it far from the blue horizontal line. If history is to repeat itself once again, the Stochastic indicator is likely to move below the 20 level and hit the blue line once again. Consequently, we will have a particularly favorite buying opportunity in the yellow metal.
Having covered the long-term picture, let's turn to the short-term one for more details.
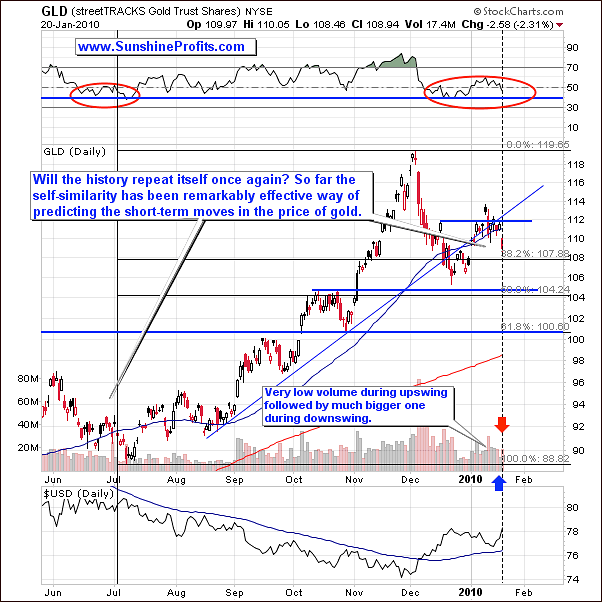
The above chart reveals that gold has finally given up on holding the rising short-term support line, and is now moving lower. The second thing that comes to mind after looking on the above picture is that the similarity between the June-July decline and the current one is really remarkable. Naturally, the very recent decline is much bigger than what we've seen 6 months ago, but the way the price behaves on a relative basis has virtually identical so far.
I have used a black vertical line to mark the time/price combination analogous to where we are today according to the recent similarity between two patterns, and it suggests further declines. The recent action in volume confirms it - we've seen very low volume during the latest move up, while the volume during the subsequent downswing was normal.
Therefore, should the pattern hold in the coming days (which seems likely), gold will move lower. It is not certain how low would gold go, but for now it seems that gold will either move to the previous lows (just above the $104 level in the GLD ETF), or move all the way down to $100.
Silver
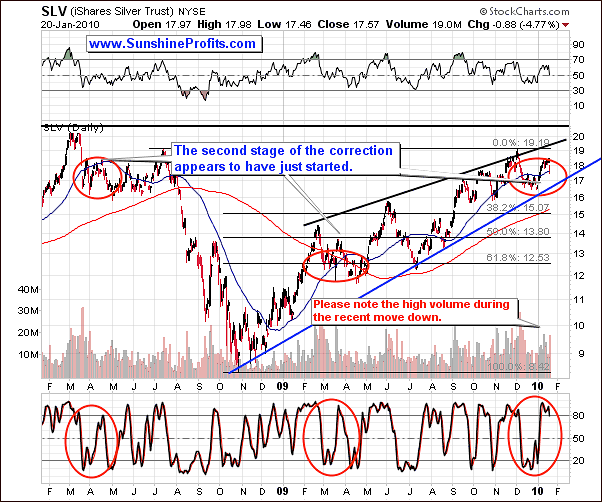
The analysis of the silver market confirms points raised earlier - namely, the second stage of the correction appears to have just started. The long-term picture did not change since last week. In the previous Premium Update we wrote the following:
The tendency for the silver to correct in more than one stage is even stronger for the white metal than it is for the yellow one, especially after big upswings. This has a lot to do with the fact that silver is generally more volatile than gold (...). The point here is that what we've seen up to date is most likely just a first part of the decline. We doubt that the second part would take us much below the recent low, but it appears likely that it will take some time (a week or a few of them) before the final bottom for this decline is reached.
Please take a look at the situation in the Stochastic indicator. During past corrections it formed some kind of double-bottom, after which it rallied to/above the 80 level only to correct soon after that. This is where we are today - at the moment Stochastic indicator has just moved above the 80 level. Should the history repeat itself once again, silver may move lower soon.
Based on silver's performance during similar corrections, it currently seem that it may need to move lower - to the $16 level in the SLV ETF - before it moves higher once again.
Silver has indeed moved lower during this week, but it is still above $17, suggesting that the bottom has not been reached yet. Let's turn to the short-term chart for details.
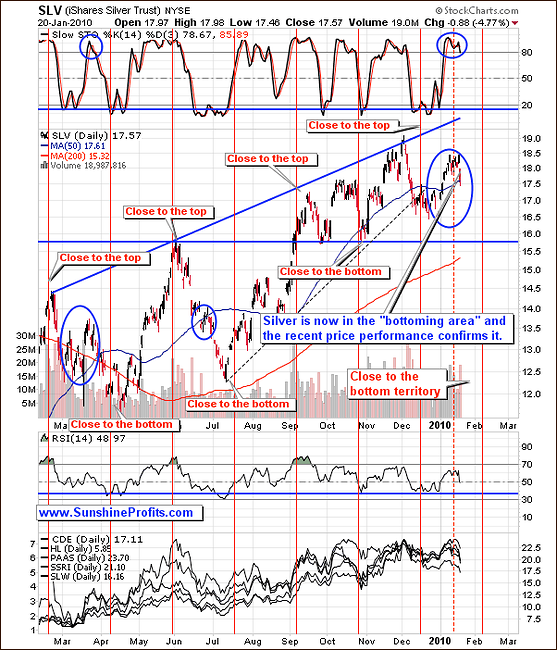
The cyclicality on the silver market suggests that silver is likely to bottom in the first week of February, or at least close to this time-frame. Either way, silver is currently within the "bottoming area" meaning that it is likely to move lower from here until the bottom is reached. This is likely to correspond to the RSI indicator just below the 40 level (touching the blue horizontal line), and a similar level in the Stochastic indicator. It currently seems that the bottom in silver will be formed within the 15.5-16.5 area in the SLV ETF.
We would like to remind you that the above points are in tune with what we wrote about two months ago, in the November 13-th update - namely, when the SLV ETF closed at $17.12 we wrote the following:
(...) I would expect it [silver] to move lower from there on a temporarily basis, possibly to where silver is today. Once silver corrects the rally and trades sideways for several weeks - months, a huge cup-and-handle formation will emerge. The cup would be created by 2008 - 2010 tops and the abovementioned consolidation would be the handle. If you've been following my analysis for some time then you know that this is one of the most bullish formations that can precede a significant move, and that the bigger the formation, the stronger the move that follows.
(...)
Naturally, we don't know yet if the new gargantuan rally will begin from $16-$18, but it currently seems as the most appropriate guesstimate.
The decline and the following upswing did not take the form of a perfect cup, but the implications are still bullish from the long-term point of view.
Precious Metals Stocks
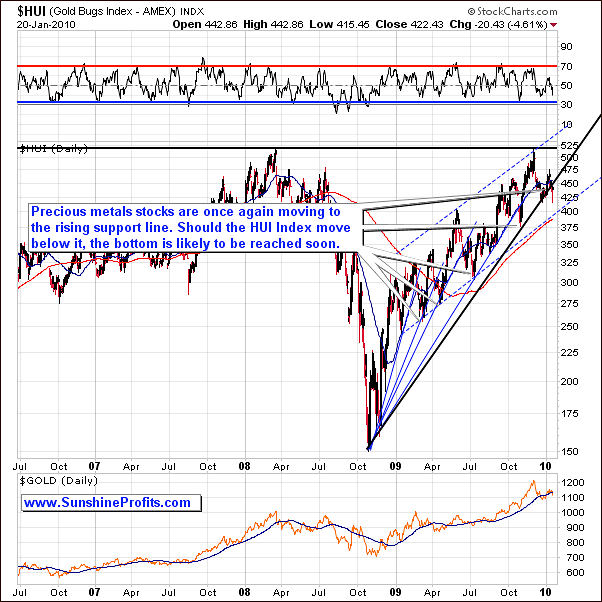
The long-term HUI chart confirms what we wrote in the past:
Please take a look at the thin blue lines coming from the same price/time combination. Each of them was pierced, before the final bottom was put in, and this is what I expect to take place this time.
(...)
(...) taking the historical performance of the gold stock sector into account, it seems that PMs will need to move a little lower before putting in a bottom.
The long-term support line has just been broken, which suggests two things:
- The next bottom will be reached relatively soon (days/weeks),
- The rally following the decline will take precious metals stocks much higher.
The bottom is likely to be accompanied by the RSI Indicator just above the 30 level. The short-term chart provides us with additional details.
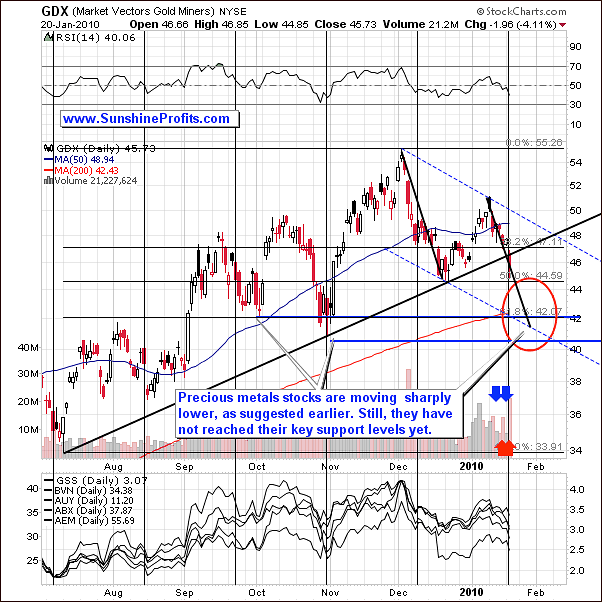
About a week ago we have provided you with the short-term chart that is virtually identical to the one posted above - the value of the GDX ETF moved lower exactly as the black line suggested. Consequently, much of what we wrote back then is still up to date also today:
The analysis of the short-term chart suggests that the PM sector might have already begun the second part of the decline.
First of all, please take a look at the volume, which failed to increase along with higher price on Monday. The volume did in fact increase, but during the move lower on Tuesday, which is a subtle clue that these declines are something more than just noise.
We have emphasized in the past that the corrections on the precious metals market often take form of a zigzag, which by itself suggests that another move lower is likely.
Moreover, in case of PM stocks, the second part of decline tends to be similar to the first one. Therefore, we have extrapolated the previous move to the current one (assuming that the decline began on Monday), and the result for the GDX ETF is that the bottom is likely to be put in a few weeks at around the $42 level, which is slightly lower than the previous bottom.
This week signals coming from the analysis of volume are even stronger. Please take a look at the huge discrepancy in size of volume between days when GDX rose, and days when it declined. High volume during declines serves as a confirmation of the bearish move. Consequently, PM stocks are likely to move lower from here along with metals.
Additional details come from the analysis of the Gold Miners Bullish Percent Index (a market breadth/momentum indicator that is calculated by dividing two numbers: the amount of gold stocks on the buy signal (according to the point and figure chart, which emphasizes strong moves while ignoring small ones) and the amount of all gold stocks in the sector.)
Gold Miners Bullish Percent Index
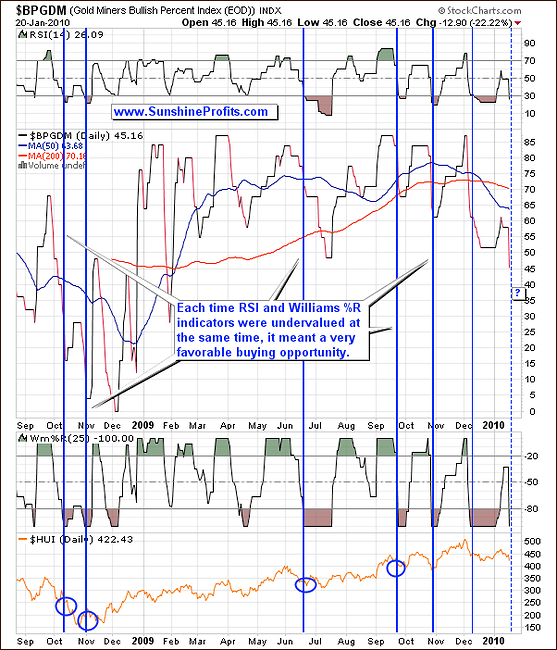
The above chart features the particularly favorable moments for opening long positions in PM stocks. These moments are created by three signals: the value of the index declined significantly, the value of RSI is below 30 and the value of William's %R is below -80.
This is not a signal for day-trading, but rather for estimating the medium term bottoms / tops. The implications of the above analysis are in tune with what we wrote previously - we are at / near a buying opportunity from the long-term point of view. Please note that according to the Gold Miners Bullish Percent Index, we already have the best buying opportunity since February 2008. We have put the "buying opportunity" in bold because it is not the same as bottom.
In short - bottom is one time/price combination at which everyone would like to buy, but in reality it is better to buy around the bottom because it dramatically increases the odds of entering transaction at all. In other words, saving several pennies isn't usually worth the risk of missing a huge move.
Therefore, we are already at a "buying opportunity", which means that if you are long-term oriented, and you were waiting with your capital on the sidelines, it seems that it is a good idea to start moving back on the long side of the market. The above chart suggests that the final bottom has not been reached (the final bottom usually formed several days/weeks after the initial "buying opportunity" signal emerged), but it seems that PMs are close enough to the bottom to make long-term purchases right away. Please note that by buying now, you are definitely not buying at the top.
As far as the short-term is concerned, we believe that PMs may stop declining for a few days, because the previous bottom has just been reached (at the moment of writing these words), which provides short-term support. However, after a few days of pause, PMs may need to decline further before the final bottom is reached.
Let's review the situation on the key driving markets for PMs for more in-depth understanding of the current situation.
Correlations
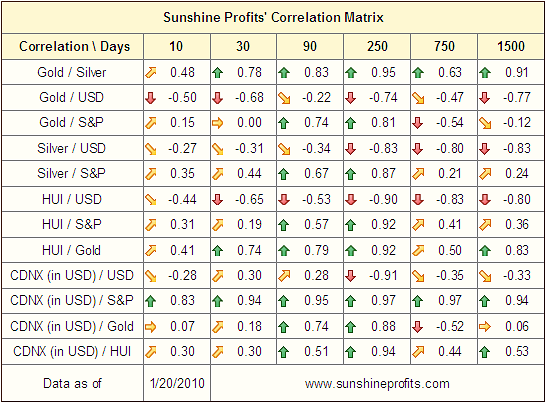
There are no big changes in the correlation matrix since last week, as far as the general stock market is concerned - the correlation coefficient for silver and S&P 500 is now positive, but it's so low that it practically equal 0. This means that a breakdown in the general stock market does not need to have a direct influence on the precious metals market.
The correlation between silver and S&P 500 does equal 0.44, but the analogous number for gold is still 0.00, and it is 0.19 for the HUI Index, so on average the short-term correlation has been weak. Consequently, the breakdown in the general stock market may have a limited impact on PMs.
On the other hand, the correlation between PMs and the USD Index has been strongly negative in case of gold and gold stocks. Therefore, this week we will begin with covering the situation on the U.S. Dollar market.
USD Index
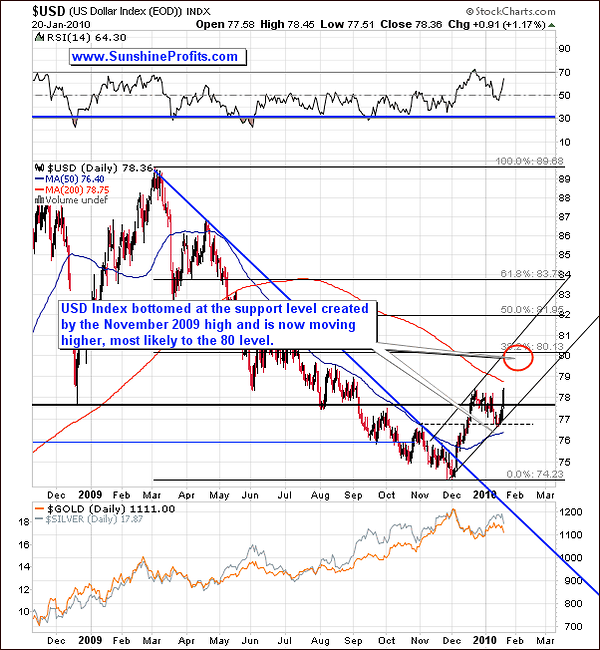
In the previous Premium Update we wrote the following:
The USD Index moved lower to the November 2009 high and stopped at the support level that this particular high created. Since it was not broken, the short-term trend remains up, and the dollar is still likely to reach the 80 level, possibly at the end of January / in early February.
Additionally, please note that the dollar's recent decline didn't cause a rally in gold and silver. This is one of the most reliable short-term indicators (...)
Since that time USD moved much higher and if it is to reach the 80 level during this rally, almost half of the rally is behind us. The area marked with a red circle (around the 80 level) still seems to be the most likely time/price combination for the coming top. The analysis of cycles provides us with additional timing details.
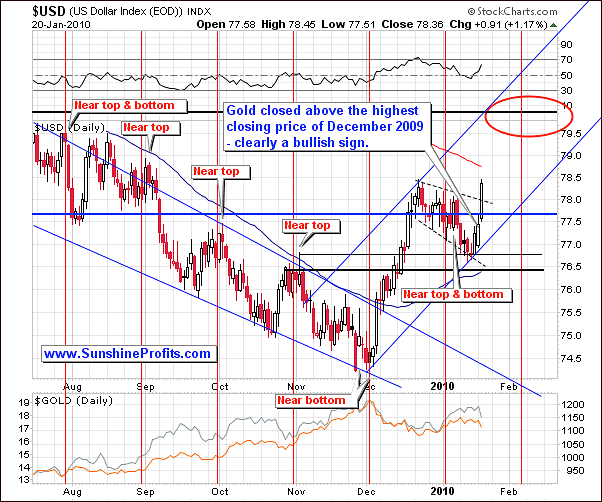
In the previous update we suggested that the next top might be reached in the first week of February, and it is still the most probable outcome. Naturally, the cyclical tendencies that are used on the above chart are not supposed to provide exact time/price combinations, but rather indicate when the next turning point is likely to materialize on a "near" basis. Still, they were quite reliable in the past, so we may expect USD to rally and PMs to decline in the coming days.
Clearly, the point made above (the dollar is still likely to reach the 80 level, possibly at the end of January / in early February) is not invalidated by the above chart.
We have already mentioned that the general stock market is not the key driver of PM prices at the moment, but we would like to provide you with the analysis of this market in case you own some of the popular stocks. Additionally, it will allow us to maintain the continuity of past analyses.
General Stock Market
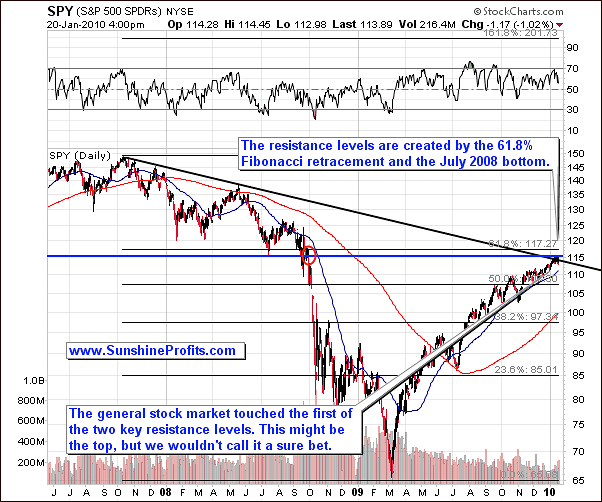
The general stock market has just reached the lower of the two support levels that we have outlined in the previous issues:
The long-term chart of the SPY ETF (proxy for the general stock market) informs us that the 50% Fibonacci retracement level has been taken out, although the testing took about 2 months. The volume did not increase lately, so points made in the previous Premium Updates are still up-to-date, namely, that the buying power is drying up, which means that the top is likely to emerge sooner or later. The key question remains - when, and exactly how high.
Since the 50% Fibonacci retracement level has been broken, the next serious resistance is just above where we are today - in the $116 - $118 area. The upper border of this range is created by the most classic Fibonacci retracement level - 61.8% - the $117.87 level. The lower border is created by the July 2008 bottom - the last visible bottom before the major plunge. Additionally, this area is the place where the price used to trade just before the dramatic fall.
Moreover, please note that the general stock market has just reached a multi-month resistance level in the form of the declining black line. In the vast majority of cases, when many strong resistance levels cross at one point, it is very unlikely for the price to go above it at the first attempt.
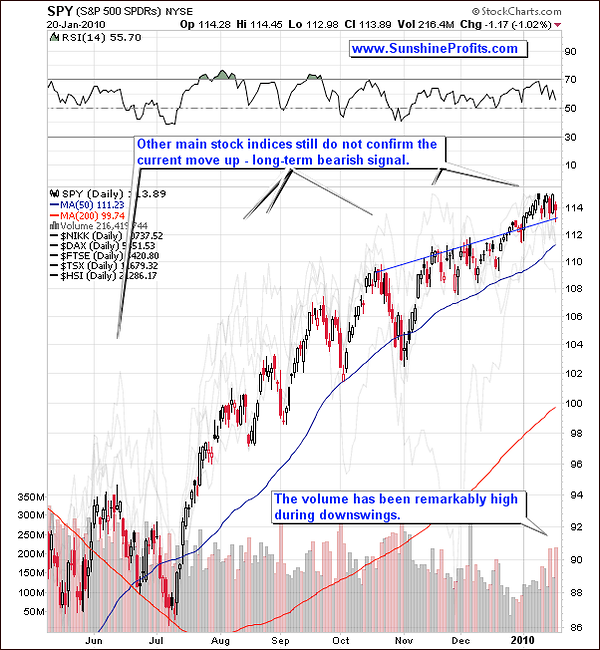
The short-term chart suggests that the decline may be underway. The volume has been very high during recent downswings, and it has been rather limited during upswings. Additionally, the SPY ETF has just (at the moment of writing these words) broken below the short-term support level (rising blue line), and this breakdown is taking place on high volume.
Naturally, we need to wait for a confirmation to say that the top for this rally is finally behind us in the form of three consecutive closes below the blue support line, but the size of the volume suggests that the decline from here is likely.
The final confirmation comes from the analysis of the financial sector.
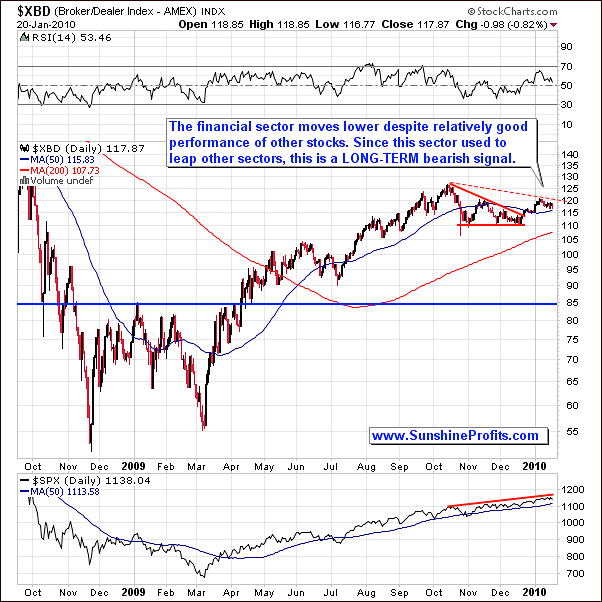
The financial sector (the Broker/Dealer Index is being used as a proxy) used to lead the whole market in the past, so the fact that each new top is lower than the previous one, signals that the whole market may plunge sooner rather than later. This brief analysis is in perfect tune with what we wrote in the above paragraph, so the odds of further declines from here in the general stock market are even higher.
Summary
The precious metals market has been moving rapidly lower in the past few days and it seems that PMs are close enough to the bottom to make long-term purchases right away. Please note that by buying now, you are definitely not buying at the top.
As far as the short-term is concerned, we believe that PMs may stop declining for a few days, because the previous bottom has just been reached (at the moment of writing these words), which provides short-term support. However, after a few days of pause, PMs may need to decline further before the final bottom is reached.
The main key driver of the PM prices is currently the U.S. Dollar, and it seems that the bottom in PMs will be reached along with the top in the USD Index. There are several factors, which point to the 80 level as the target for the coming top, so once this level is reached, we may see a bottom in the precious metals market as well.
The next Premium Update will be posted on Wednesday, January 27th (ahead of the regular schedule), as mentioned a week ago.
Thank you for using the Premium Service. Have a great weekend and a profitable week!
Sincerely,
Przemyslaw Radomski

