
January has been a tough month for gold. From its year-end 2010 price of $1,420 an ounce to its recent low just over $1,320, gold has lost some $100 - about seven percent. In percentage terms, this doesn’t amount to much of a correction in the metal’s 10-year- old bull market. Gold has corrected in price in excess of 20% no less than 46 times since the onset of the bull market in 2001. Each time, the market mavens heralded the bull market’s demise.
On Wednesday, the World Gold Council published its annual Gold Investment Digest for the fourth quarter and full-year 2010 with some interesting insights.
According to the World Gold Council last year’s price performance was driven by developments in key gold markets:
- China saw increased investment activity, driven in part by innovative new gold investment vehicles offering improved access to the gold market.
- Jewelry consumption rebounded in India, the world’s largest gold market.
- Globally, investors remained concerned about uncertainty in the macro-economic environment and turned to gold to hedge against weakness in the US dollar and rising inflation in many economies.
We find the last point particularly interesting, as the USD Index finished the year slightly higher than was the case in 2009. As mentioned many times in our updates, after 2006 things are much more complicated than simply USD up = gold down and vice-versa.
Juan Carlos Artigas, Investment Research Manager, the World Gold Council commented:
The gold story in 2010 is about growth in demand and not just economic concerns. It is significant that consumers increased their gold jewelry spending during the first nine months of last year, despite the rising price of gold. Strong investment activity and a normalization of gold demand in technological applications during the same period further supported gold’s stellar appreciation.
The price of gold reached new highs in most developed market currencies during 2010, the notable exception being the Australian dollar, according to the report. Gold’s performance was the strongest in US dollar, euro and pound sterling terms during the year in general and Q4 2010 in particular. As the European debt crisis continued to unfold, investors in Europe used gold as a currency hedge. Similarly, a weak US labor market and monetary policies implemented by the Federal Reserve made gold an asset of choice for many investors. During 2010, gold prices rose by 39.7% in euro terms, 34.9% in pound sterling and 29.2% in dollar terms.
During 2010, palladium and silver were the best performing commodities, rising by an impressive 96.6% and 80.3% respectively.
The annualized gold volatility in 2010 was 16.1% compared to 21.4% the previous year, similar to its historical trend of 15.8% over the past 20 years. Gold is a unique asset among commodities for many reasons, according to the report. In particular, gold remained, on average, one of the least volatile of the commodities that the WGC monitors.
Key findings from the latest Gold Investment Digest show that:
- The gold price rose by 29% in 2010. By comparison the S&P Goldman Sachs Commodities Index (S&P GSCI) rose by 20%, the S&P 500 rose by 13%, the MSCI World ex US Index increased by 6% in US dollar terms, and the Barclays US Treasuries Aggregate Index rose only by 6% over the year.
- Gold price volatility at 16% on an annualized basis in 2010 remained consistent with its long-term trend. By comparison, volatility on the S&P Goldman Sachs Commodity Index was 21% during the year, based on daily returns.
- Gold benefited from the continued contagion from European sovereign debt problems as investors hedge their currency risk. This was evidenced by strong gold buying in ETFs, bars, coins and other investment vehicles in Europe and other parts of the world.
- Investors bought 361 tons of gold in the ETFs the WGC monitors in 2010, bringing total holdings to a new high of 2,167 tons, worth US$98 billion. This represents the second largest yearly inflow on record, after the 617 tons of net inflows experienced in 2009.
- During the first nine months of 2010, global jewelry demand totaled 1,468 tons, increasing 18% from the same period during 2009. Gold demand for technological and industrial applications continued to recover during the first nine months of 2010, registering a 19% increase over the same period in 2009.
- Central banks became slight net buyers of gold for the full-year, after two decades as a steady source of supply to the market. The IMF successfully completed its gold sales program of 403.3 tons without disruption to the market.
According to the report, on a risk-adjusted basis, gold had a stellar performance during 2010 relative to most assets that investors might hold in a portfolio. It considerably outperformed not only equity and commodity markets, but also assets such as US Treasuries which tend to have much lower volatilities. The report concluded that beyond its strong price performance, gold’s relatively low volatility and lack of correlation to many assets makes it an ideal candidate for portfolio diversification and risk management strategies.
Here, we would like to add that the above is true to long-term correlations, which are important while constructing investment portfolio. Speculative-wise, we can still often notice periods, during which gold moves along or in the exact opposite to other markets.
Surprise, Surprise—Everyone is to Blame
Another report released this week was not surprising at all. The 2008 financial crisis was an “avoidable” disaster caused by widespread failures in government regulation, corporate mismanagement and heedless risk-taking by Wall Street, according to the conclusions of a federal inquiry.
The Financial Crisis Inquiry Commission that investigated the crisis cast a wide net of blame, faulting two administrations, the Federal Reserve and other regulators for permitting a toxic brew of shoddy mortgage lending, the excessive packaging and sale of loans to investors and risky bets on securities backed by the loans.
“The greatest tragedy would be to accept the refrain that no one could have seen this coming and thus nothing could have been done,” the panel wrote in the report’s conclusions. “If we accept this notion, it will happen again.”
The commission held 19 days of hearings and interviews with more than 700 witnesses; it has pledged to release a trove of transcripts and other raw material online as well as the 576-page report. It accuses several financial institutions of greed, ineptitude or both, some of its gravest conclusions concern government failings, with embarrassing implications for both parties.
Perhaps some of the Wall Street bankers could put it on the night stand for their bedtime reading.
Risk—Not Just Game
For the past two weeks we wrote about the risks that we might all face in 2011 and mentioned the problems caused by rising food prices and the social unrest they might unleash. We didn’t expect it to happen so soon.
After Tunisia’s revolution and the ouster of its president after 23 years of rule, Egypt seems to be next on the North African crisis list. One of the main grievances of the protesters in Egypt, just as it has been in Tunisia, has been the soaring price of food in the shops. The crisis and food shortages may spread to other Arab countries and no one knows where that can lead. We only know one thing—in times of crisis and uncertainty, people turn to gold for a safe haven. Friday thousands of demonstrators calling for the ouster of President Hosni Mubarak poured from mosques in Cairo after noon prayers clashing with police who fired tear-gas, rubber-bullets and water-cannons, according to news reports.
Internet and cellphone connections have been disrupted or restricted in Cairo, Alexandria and other places, cutting off social-media Web sites that had been used to organize protests. Destabilization in Egypt could spread to other countries in the Middle East and cause upheaval in a region that already has enough of its share of problems. We shudder to think what it could mean to oil prices and to the global economy.
To see what the near future has in store for precious metals let's begin this week's technical part with the analysis of the Euro Index. We will start with the short-term chart (charts courtesy by http://stockcharts.com.)
Euro - USD Indices
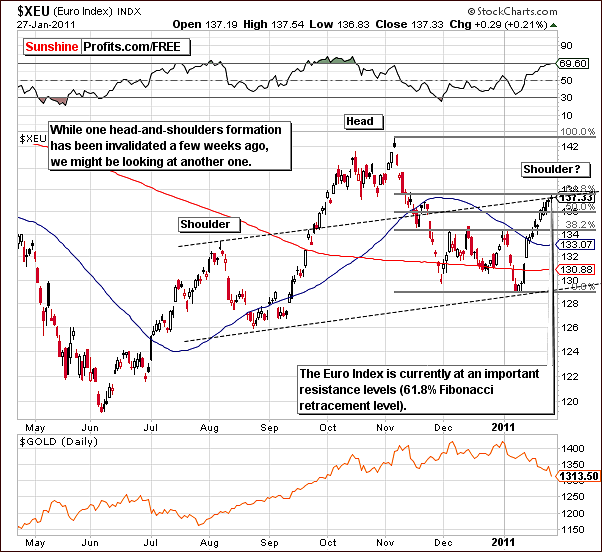
In the short-term Euro Index chart this week, the rally of recent weeks is seen to have brought the index close to the resistance line coinciding with the 61.8% Fibonacci retracement level. This means that nearly 61.8% of the major decline which began in November has been “retraced” or shall we say “taken back”. Historically this has been a strong resistance line on many occasions not only on this market but on virtually all markets.
At this point, the Euro Index is likely to change direction and decline or at least pause at current levels. Yet another head and shoulders formation could be developing with the August 2010 top as the one shoulder and recent price action creating another. Further declines from here would confirm this theory.
The Euro Index has been moving in the opposite direction of gold recently, so the bearish implications of the chart this week seems to support bullish sentiment for the precious metals sectors, at least temporarily.
Of course, what’s bearish for the Euro Index is bullish for the USD Index.
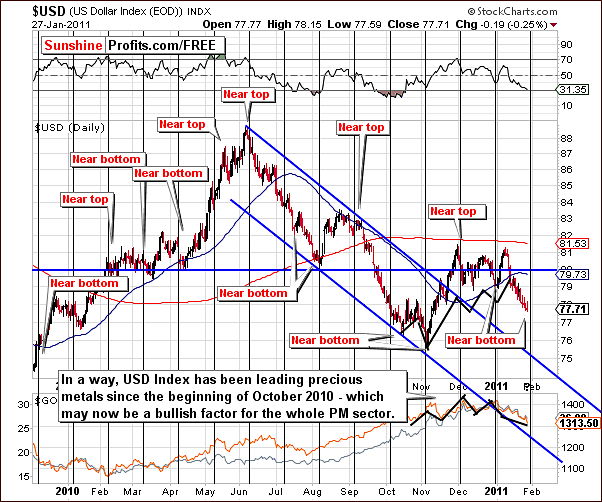
In this week’s USD Index chart, a cyclical turning point is close at hand and should put an end to the recent declines seen in this index. It is important to note that the actual timing of the turning points here are somewhat delayed when compared to those of silver. Please note that silver did move higher on Wednesday – at its turning point, while the USD Index might be
There is a strong possibility however that the trend for the USD Index will reverse very soon. The RSI is close to the 30 level which has coincided with local bottoms many times although not in every case during the past 12-months. So even though it is not a significant signal, it can be taken as a confirmation of the pending cyclical turning point.
Summing up, the sentiment for the USD Index is short-term bullish which also has bullish implications for gold, silver and mining stocks. Recall that during the past few months, the USD has been leading the precious metals and here could very well ignite a turnaround for the metals and the mining stocks.
General Stock Market
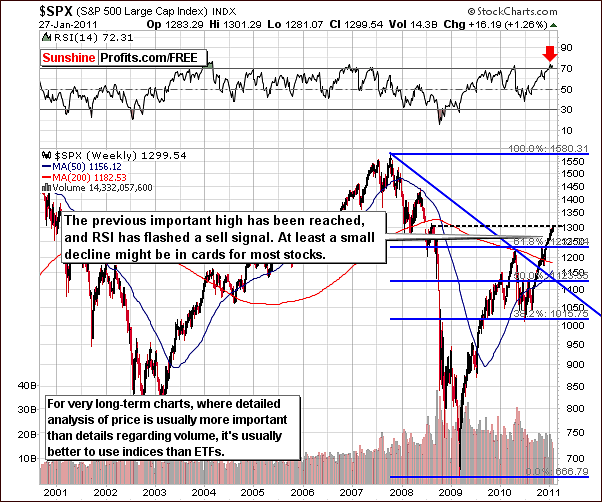
In the very long-term S&P Index chart this week, we see that the S&P 500 is close to the important level of the 2008 highs. This resistance level is further validated by the RSI which is currently overbought.
A sizable rally has been seen since the middle of 2010 with only one very brief period of correction. It is quite likely that a retest of the early 2010 highs could be seen very soon. This is in fact probable in the weeks ahead.
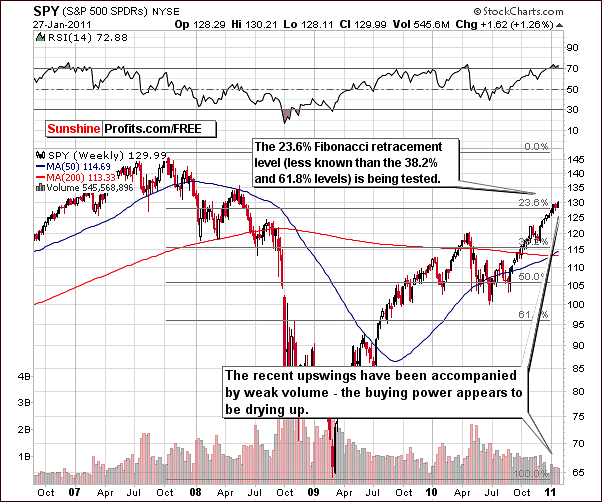
Low volume levels have been seen recently as indicated in the SPY SPDR long-term chart. The recent upswing has not been confirmed. There appears to be a good chance that the buying power is drying up and this makes a correction more and more likely. Lower prices are quite possible for stocks in the weeks ahead. Declines in the general stock market will likely have noticeable impacts on all other markets world-wide.
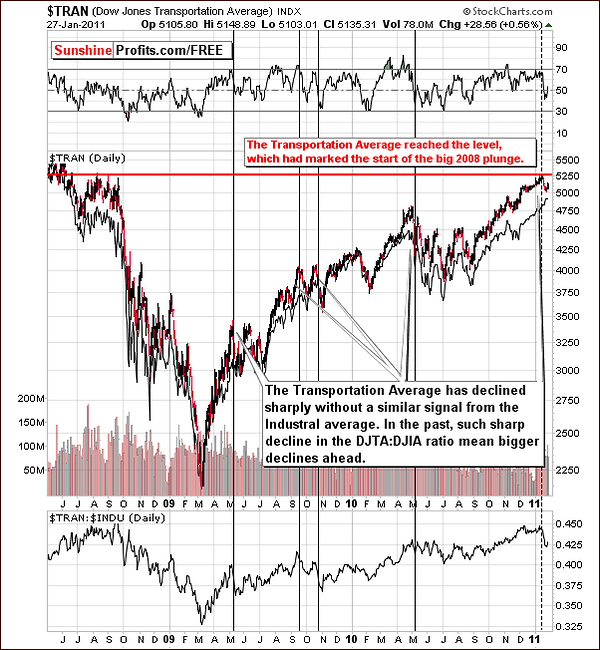
Once again, we have included the Dow Jones Transportation Average Index. As stated last week in our Premium Update, this is “a ratio of the transportation stocks (which have sharply declined) vs. the industrials (which have not declined). “ Nothing has really changed here in the past seven days and our mid-week update discussion and analysis still holds true.
Here, we are using this divergence in a slightly different way. In the past few days we have seen a sharp decline in the Dow Jones Transportation Average, without a similar action in the Dow Jones Industrial Average. In order to isolate this relative phenomenon, we have included a transportation:industrial stocks ratio below the price chart. Here, we clearly see that the ratio moved quickly lower recently.
Since this signal is quite clear, let’s take a look what it meant in the past. The fact is that in the past it was an early warning about the coming decline. In the past, declines such as this were seen to continue for days or even weeks. The implication here further confirms the short-term bearish case for stocks.
The implications are still quite bearish at this time and the divergence is clearly visible here. Since this is a long-term chart, the bearish sentiment applies to several weeks or months out, not necessarily to the days ahead.
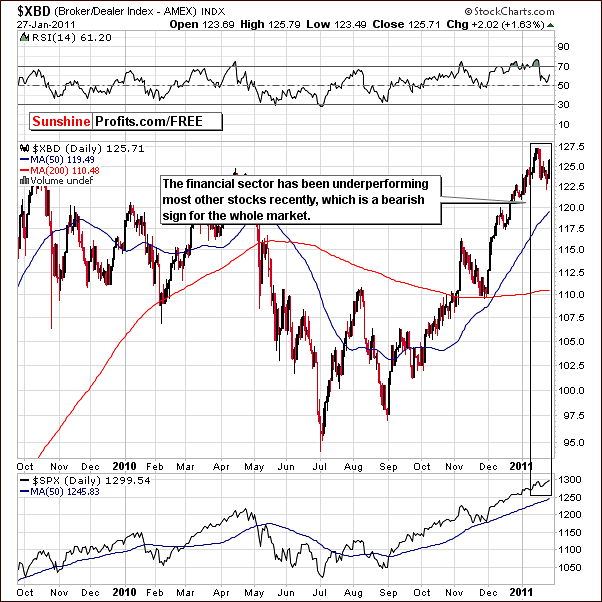
Confirmation is seen in the financial sector, which usually leads the other indices. The underperformance of this index, that is, not moving above early 2011 highs as has been seen in the S&P 500 is a bearish signal as well.
Summing up, the sentiment for stocks is medium-term bearish. A correction back to levels of the 2010 highs is likely. This will likely have a negative impact upon gold, silver and mining stocks.
Correlation Matrix
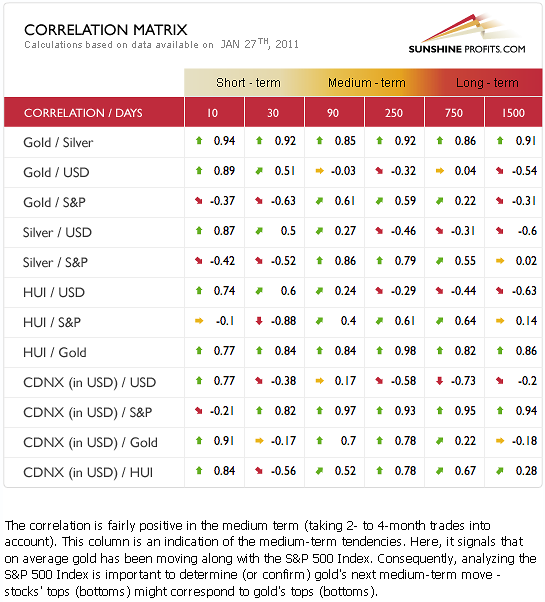
In this week’s Correlation Matrix, the medium-term coefficients are highest between gold and the S&P 500, as well as for silver and the S&P 500. In the short-term the metals – USD link appears valid and positive.
With the dollar approaching a cyclical turning point and likely to rally, gold, silver and mining stocks will likely follow. This week, this indirect relationship is visible also through our traditional measures above. Silver of course, is also approaching its own turning point. The implications here are bullish for precious metals in the short-term, that is one to two weeks and bearish for the medium four to six week term.
Gold
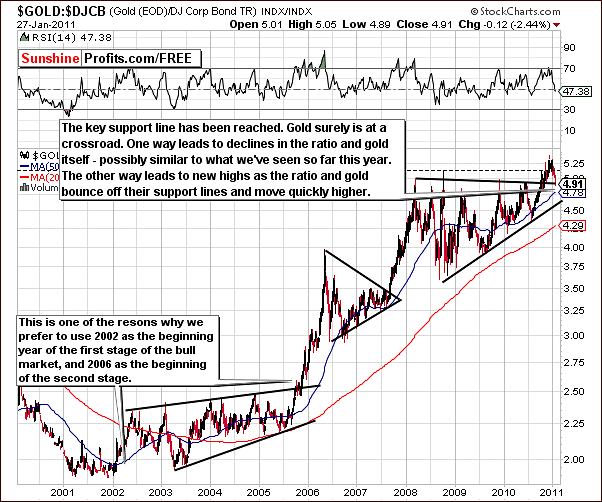
We begin our gold section this week with a look at the ratio between the price of gold and corporate bonds. Here we can see that gold is truly at a crossroads. A move above previous highs for this ratio has been seen however since that time it has broken below the first initial support level. Currently, a more significant resistance level is being tested.
As it is the case with the price of gold itself, large declines have been seen here since January 1. If this continues, and the support line is broken, we could very well move as much lower again as we have already seen this year. However, if the current support level does indeed hold, new highs (!) may very well be seen both in the ratio and in the price of gold itself.
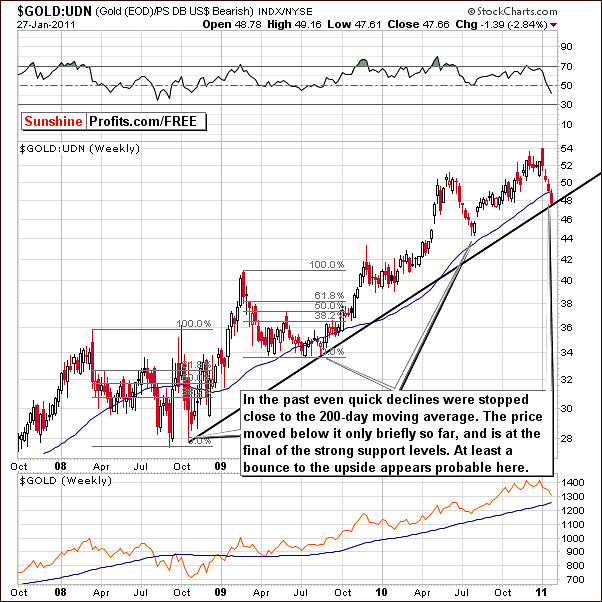
From a non-USD perspective, we draw similar conclusions to what was seen in our previous section. Here gold has declined to the medium-term rising support line. This decline has been fairly large, in fact nearly identical to the one seen in the middle of 2010.
It seems therefore, that a reversal and bounce of sorts is quite possible at this time – and worth betting on. The trends of early February from a non-USD perspective could be quite similar to what was seen last August when a quick 10% jump was followed by a couple of weeks of sideways movement here.
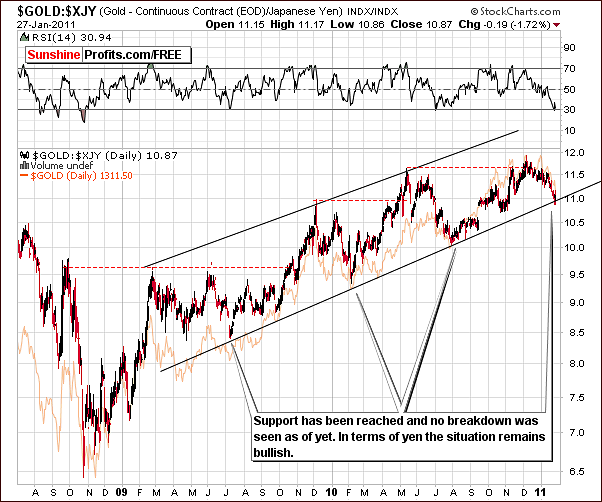
We now turn to a chart which shows gold’s price action in terms of the Japanese yen. Generally, this ratio differs to a considerable extent from those of other currencies and helps us to analyze gold from a different angle as well as provide further confirmation of signals from other markets.
Note how the chart patterns differ here. Whereas many of the other markets and currencies trend similarly, this chart immediately is seen to be quite different. We clearly see that gold’s price has reached a support level here and therefore a slightly bullish sentiment prevails at this time at least for the short-term.
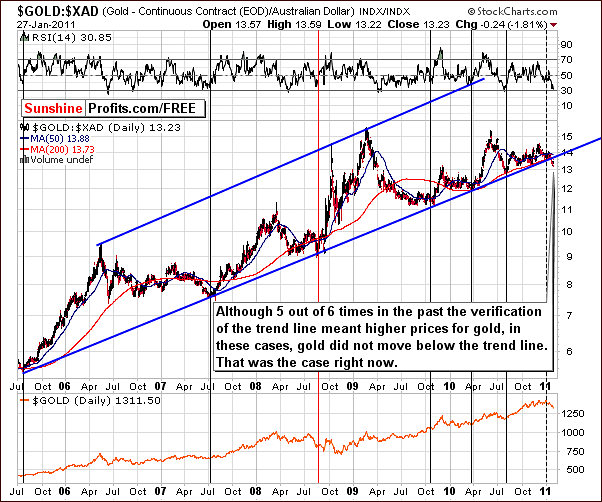
The gold chart in terms of the Australian dollar, on the other hand, is slightly bearish at this time. Prices have declined a bit recently, moving slightly below the 14 level. At this point the breakdown will either be verified or prices will rise, the latter of which would be a very bullish medium-term development.
Generally, the above chart does not invalidate the short-term bullish case, but it suggests that medium-term situation is neutral at best.
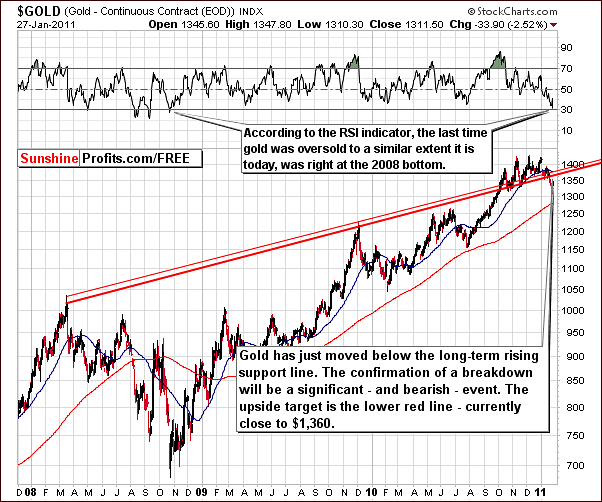
The long-term chart for gold from our regular – USD – perspective, this week shows a decisive breakdown below the rising support level which has now become a resistance level. The RSI level indicates a likely short-term rally from here and if this does come to pass, the likely target level is around $1,360 – at the recently broken support line.
Note that in 2008 when the RSI was last near the 30 level, gold reached a bottom and then rose almost 40% in value (compared to the size of the previous decline). Here it seems likely that a bounce will be seen and the short-term chart will provide more support for this theory. A 40% bounce from Thursday’s closing price would bring gold to just above $1,360.
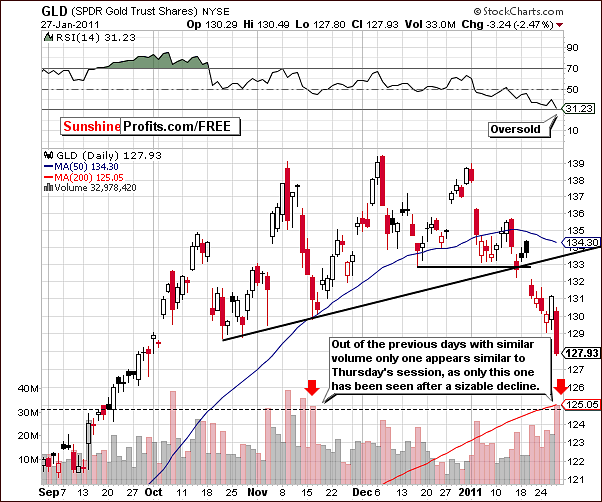
In the short-term chart, we see how volume can be analyzed to support trends seen elsewhere. Previously we have seen high volume levels immediately following a significant decline only when gold was close to a bottom. Perhaps this is the case once again and, if so, this would be a bullish indicator for the short-term. Thursday’s volume level surpassed 30M for the first time in ten weeks or so, last seen in mid-November.
Summing up, the sentiment appears bullish for the short-term and mixed for the medium-term. Much depends on how the previously discussed resistance levels hold the next short-term rally. If they hold and stop the uptrend, then it may very well be prudent to exit a portion of one’s long-term position. It is premature, however, to advise making this move today.
Silver
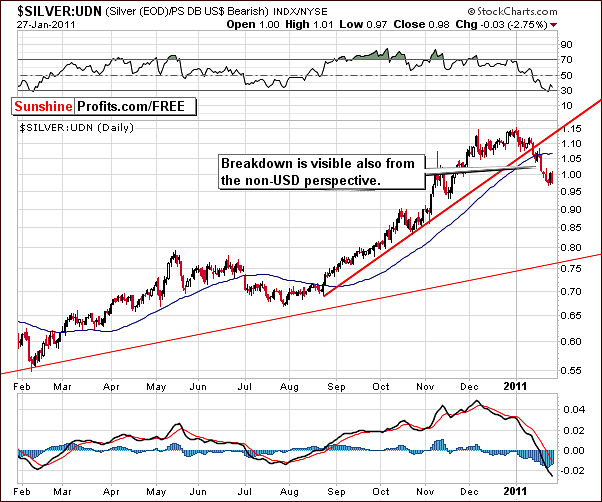
The situation this week for silver from a non-USD perspective is quite similar to the view from the USD side. The breakdown below a significant support line is clearly visible and, thus far, no significant bounce has been seen.
The RSI is close to the 30 level and on two occasions in 2010, in February and July, an RSI at this level coincided with a local bottom for the white metal. A quick rally followed each time last year and could also be seen as well in this case.
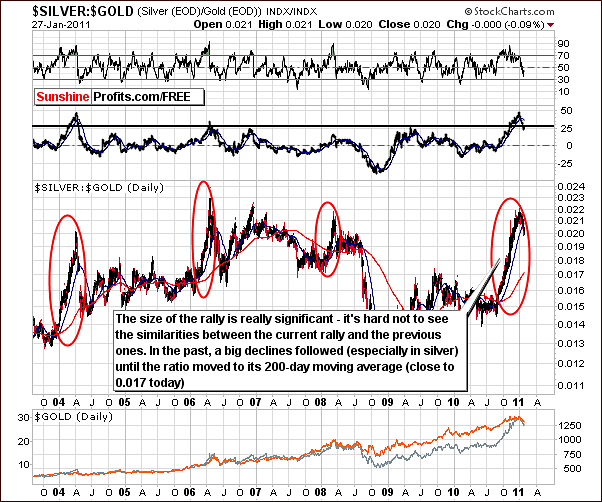
This week’s Mid-week Update which we published on Tuesday discussed the silver/gold ratio. We stated that the ROC indicator (second from the top) has just moved below its moving average and also the key signal line close to the 25 level. The silver to gold ratio itself also moved below its moving average. The situation appears bearish.
Since Tuesday, the ratio has not shown improvement and continues to decline after its meteoric rise late last year. Should history repeat itself, the ratio is likely to continue to move lower in a sharp fashion. If precious metals’ prices do indeed fall, the decline seen in silver will likely be more dramatic than that of gold. This makes the previously-mentioned move out of silver and into gold very appropriate.
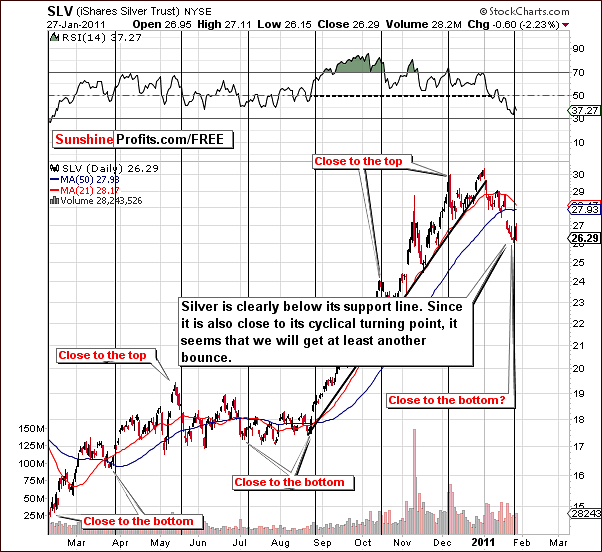
In this week’s short-term chart, we see that once again a cyclical turning point has come into play. The small rally seen on Wednesday, though it only lasted for one day, could perhaps signal a new beginning and a subsequent rally. This would be very much in tune with price action seen around prior cyclical turning points.
Summing up, a rally for silver in the short-term appears quite possible. The strength of silver itself however, is questionable and the bigger (medium-term one; we’re still bullish for the long term) picture is not close to bullish at this time for the white metal.
Mining Stocks
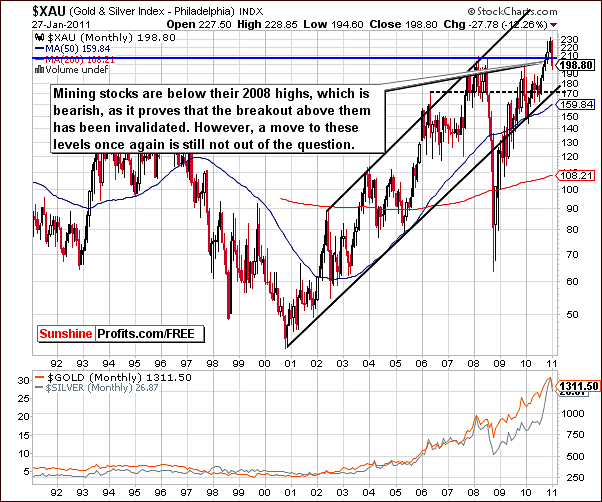
The XAU Index of gold and silver mining stocks has moved to levels below highs seen in 2008. Verification of the recent breakdown has not yet been seen. There seems to be a strong possibility that the trend could reverse and index levels again move to or above these previous highs. Much depends on the verification of breakdowns and strength of support and resistance levels in other markets mentioned above.
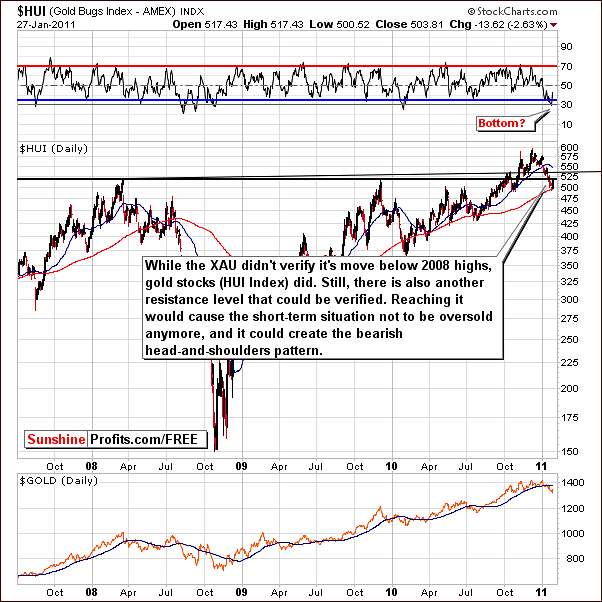
As it was the case a week ago, the HUI Index chart has similarities with what was seen on the previous chart. Here, however, we have two resistance lines. Either of these could stop the small rally, which appears to have begun on Wednesday.
If mining stocks continue to move higher for several days or longer and are then stopped by the upper resistance level, then a head and shoulder’s pattern will be developing. To illustrate this point, view the October top as the left shoulder, the December 2010 top as the head and the next local top as forming the right shoulder. This would be a very bearish development indeed. In this case, the following decline could take the index levels down to the 425-450 range.
One final point of support for the short-term bullish scenario is that the RSI is also suggesting an oversold condition; it’s currently slightly above the 30 level. This has often coincided with local bottoms in the past.

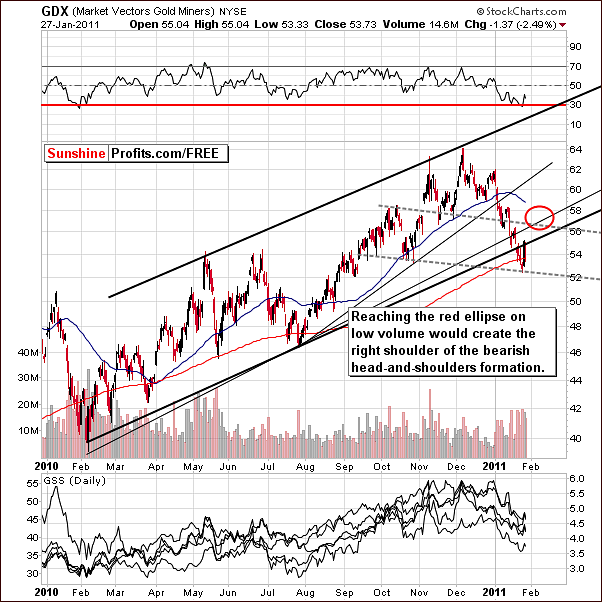
On the short-term GDX Market Vectors Gold Miners chart above, we have illustrated a target level of approximately 57. If the mining stocks do move higher and this index stops around this target area, it will also likely result in a head and shoulders formation and once again a bearish outlook.
Confirmation of these points is seen when analyzing volume levels, which were declining during a recent upswing and have now risen during the January declines for this index. Should higher index levels be seen on low volume, the head and shoulders pattern development will be confirmed. Still, for the short-term the situation remains oversold and bullish.
In this week’s Gold Miners Bullish Percent Index chart, little change is seen and the heavily oversold signals remain (as described on the chart - buying opportunity). The implications here are bullish for the short-term and, quoting from our Mid-week Update, “the above index suggests oversold status. This, by itself is nothing extremely bullish, however the fact that the market has been in this state (in terms of the above chart) virtually since the beginning of the year implies that at least a temporary turnaround is very likely.”
Summing up, mining stock investments might be at risk in the medium-term. At this time, however, prices are below highs seen in 2008 and with an oversold situation prevailing today, a short-term uptrend appears probable.
SP Indicators
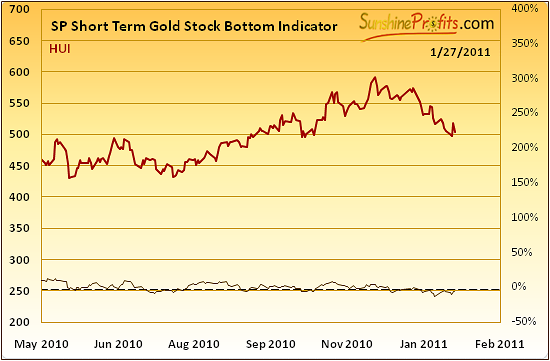
The Short Term Gold Stock Bottom Indicator shows a move up while being below the dotted line in the lower part of this chart. This is a buy signal. Please note that since May 2010, whenever we’ve seen this signal, the prices rallied, at least temporarily.

Moreover, in the SP Gold Stock Extreme Indicator, we see that the suggestion is that a local top or bottom has been reached. When the indicator crosses either of the dotted lines, we see an extreme signal and here it indicates a local bottom, since it was a decline that we’ve seen recently.
Both abovementioned signals are bullish for the short-term and speculative long positions are justified from this point of view.
Letters from Subscriber
At the beginning of this section I would like to thank you for numerous letters with congratulations on the outcome of my CFA Level 1 exam - much appreciated.
We were also asked to clarify the following:
“Please note that the above does not concern the physical bullion in your possession that you own as a form of insurance against the meltdown in the financial system in general"
Do you mean by this only coins/bars etc. that you have taken personal physical possession of, or do you also mean genuinely allocated investments in bullion via people like Gold Money and Bullion Vault? You could argue that both are “physical bullion” holdings, though one is hard to convert to another PM type and the other very easy. Are you just saying if you can switch easily through Gold Money and Bullion Vault then go for it, but don’t bother bringing in your gold bars from your back garden and buying silver ones.
Yes, we meant the metals that one has taken personal physical possession of. Unless you have specifically planned to trade some of these physical metals from time to time, we believe that no adjustments (switching from silver to gold) need to be made.
Summary
The USD Index looks short-term bullish, which also has bullish implications for gold, silver and mining stocks due to the fact that the USD Index has been leading the precious metals during the past few months. However, the sentiment for stocks is medium-term bearish. A correction back to levels of the 2010 highs is likely and may have a negative impact upon gold, silver and mining stocks in a few weeks.
Gold appears bullish in the short-term, however the sentiment for the medium-term is mixed. Much depends on how the resistance levels hold the next short-term rally. If they hold and stop the uptrend, then it may very well be prudent to exit a portion of one's long-term positions. This is not the case today. Conversely, based on the short-term indications – and signals provided by our indicators this week, short-term long position appears justified.
We would like to remind you that we currently believe that due to the situation in the silver:gold ratio, most of one’s long-term capital should be invested in gold, not silver.
As always, we will keep our eyes and ears on full alert and provide you with timely suggestions as each development unfolds.
Our next Premium Update is scheduled for Friday, February 4, 2011.
This completes this week's Premium Update.
Thank you for using the Premium Service. Have a great weekend and profitable week!
Sincerely,
Przemyslaw Radomski

