
Please imagine a private room at a posh downtown restaurant. The guest list is by invitation only and limited to the wealthiest clients of Bank Edmond de Rothschild, which specializes in private banking and wealth management. Rothschild is legendary with a reputation that has made the name synonymous with banking for several centuries. The family-owned bank has been passed down through generations and kept its reputation and solvency despite political turmoil, wars, persecutions, revolutions and market upheavals. It has done so with what the Rothschilds like to call "instinctive caution."
Two leading in-house experts were flown in to meet with the clients at the posh restaurant to deliver a year's end economic report and a look at what's ahead. The title of the talk was "Back to Growth, But Not Yet Back to Health."
Although talk about gold was somewhere towards the middle of the lecture, I'll skip to that, because that is what interests us the most. The savvy folks at the Edmond de Rothschild bank are looking at two target prices, the first at $1,500 and the second at $2,000. The reason is simple, they say, less supply and more demand with central banks being net buyers rather than net sellers. Please note that the first of these two targets is in perfect tune with what I wrote previously after analyzing the very-long-term chart of gold.
Now for a summary of the overall economic picture:
The bank's experts predict growth in all parts of the world in the year 2010, with emerging markets, especially China, leading the way. They expect China to achieve 9% to 10% growth next year due to strong domestic demand. Remember the part from the December 10th Premium Update, when I emphasized the high savings rate in China? It's been mostly in the 30% - 40% area in previous years. Combining this fact along with other high growth of the Chinese economy and the fact that gold is a logical investment for the Chinese it's becoming increasingly more probable that a lot of Chinese Investors will put the upward pressure on gold prices in the coming years.
Further comments include the analysis of the European economy. The Euro Zone is likely to have a slow recovery with some undertow from the more fragile economies, Greece, Spain and Ireland, but business sentiment and consumer confidence are improving.
As far as the U.S. goes, the bank is not bullish. There is a wide discrepancy between consumer and business confidence, but both are firming. A weaker dollar will help industrial activity. Housing, although still under pressure, is recovering. As far as my opinion is concerned, I wouldn't be so sure about any improvement in the real estate market. As mentioned in the essay dedicated to gold fundamentals, once the home prices start to fall, it takes a lot of time for them to reverse their direction. Assuming that the home prices have been declining for approximately 3 years now, it is still a rather small time frame taking the historical perspective into account. The previous decline in this market began around 1990 and it took more than 5 years for the prices to reach bottom.
Going back to the banker's comments - Japan is back to growth but is still facing a lot of headwinds with a banking sector that is still fragile with no clarity about the new government policy. Although Japan is benefiting from the growth in Asia and China, the strong yen is putting pressure on the manufacturing sector. Deflation is more and more entrenched. If the yen gets weaker, Japanese equities may be a buy. My take on the situation is that the charts are not confirming the "strength" of the Japanese economy, so I would still wait for additional confirmations before initiating a long position in Japanese equities.
The experts at the Edmond de Rothschild bank are not worried about inflation for 2010 unless the price of crude oil jumps again, but that is not their view.
Some developed countries have already started to raise banking rates and will continue to do so. Israel was the first country to raise rates, followed by Australia. It is expected that Canada, Korea, and Norway will join. Does it mean that the precious metals sector is likely to plunge because of the renewed "faith" in the paper currencies? After all, interest rates are the price of money, so if they rise - all other things being equal - the value of money also rises, which is another way of saying that the prices of goods/assets are likely to decline. I seriously doubt it, because this is also what happened during the previous bull market in the precious metals (in 1970-80s), and the moderate increase in the interest rates didn't stop PMs' surge. In fact interest rates, followed gold on the way up. Again, a serious increase in the interest rates in the U.S. seems unlikely at the moment.
The key features of the 2010 landscape will be an on-going recovery in the global economy for a few quarters (keep in mind that the main stock indices lead the economic indicators and that they bottomed months ago), a modest recovery in the US and Europe by historic standards. There will be stronger Emerging Market growth. They believe there is still some money to be made in the markets because cash is yielding zero. They like healthcare and biotechnologies, energy, mergers and acquisitions and stocks of companies that are geared towards domestic consumption in the emerging markets. The experts are not worried about the possibility of a major crash in government bonds, although the return is not exciting. They favor corporate bonds over government bonds.
They like gold and prefer gold mining stocks over other gold investments because they offer a discount on the gold price. My take is that diversification of holdings is appropriate for about 90% of Investors, and I really encourage you to go through the Key Principles section if you hadn't already done so.
There you have it. We have been a fly on the wall at an exclusive briefing by some of the savviest, most conservative and cautious investors in the world. And they like gold.
So if super conservative investors like the people at Bank Edmond de Rothschild are on the gold bandwagon, does that mean we are close to the end of the ride?
You can do your own gold bubble test during this holiday season when you see lots of friends and family members at parties.
Ask people if they own gold, or if they know why gold has climbed from $650 to over $1,100 in the past three years and see what they say.
The average person has heard about gold on television and in the media, but has no idea why it's rising, who is buying it, and how far did previous bull markets take PMs in the past. They might even like to buy it, but don't really know how.
Baron Benjamin de Rothschild writes in a letter to the bank's investors that the Chinese world for "crisis" is written with two ideograms, one meaning danger and the other opportunity.
I hope that in the coming year we will avoid danger and embrace opportunity. The best way to do that is to see what the charts can teach us. Let's begin with the gold chart (charts courtesy of http://stockcharts.com).
Gold
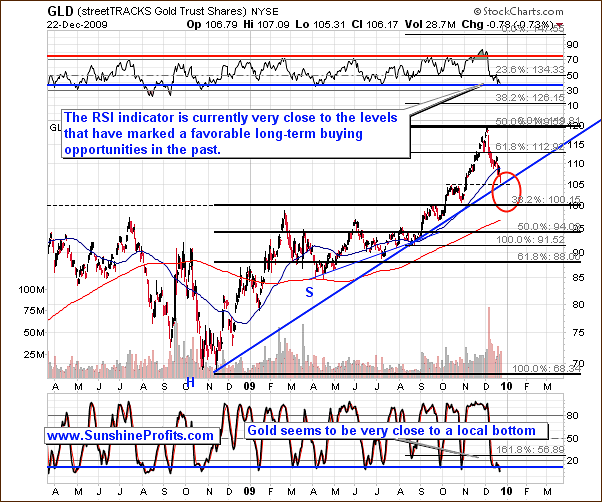
The long-term chart didn't change much since the previous Premium Update was posted. Back then I wrote the following:
Taking a closer look results in one more support level that was previously rather invisible - the $105 level in the GLD ETF. This is the price that stopped the initial post-$1,000-breakout rally, and it currently corresponds also to the medium term support line. This may stop the decline for a while (and both indicators on the above chart: RSI and Stochastic confirm this) (...).
The above applies also this week, but please note that this time the price of gold is very close to the long-term support level (rising thick blue line) - the aforementioned $105 level. It is also currently in the area marked with red ellipse, which suggests that the bottom may be very close.
Let's take a look at the short-term chart for more details.
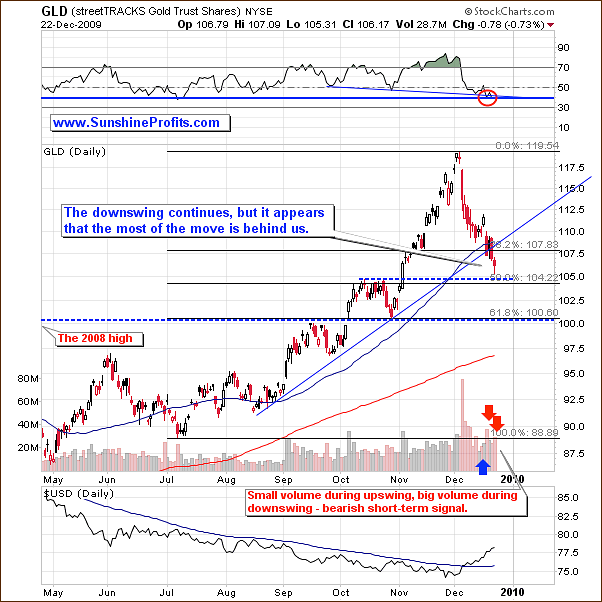
The analysis of the short-term chart confirms that we may indeed be near a turning point in gold, but that may not necessarily be at the $105 level. After all, there is another very strong support level at $100 in the GLD ETF, which apart from being an important psychological barrier (gold goes into 4 digits!) is also the 2008 high, which has been tested only briefly.
The October high combined with the 50% retracement level of the whole upswing creates a strong support signal, which may stop this decline, but it is not as strong as the $100 level. Therefore, if GLD breaks below the $105 level, I would expect it to bottom close to the $100 level. However, given the size of the decline and the fact that it materialized in a relatively small time frame, it seems that we may see gold move higher in a few days. It is impossible to tell if this would be a beginning of a new strong upleg, or would it be just a small rally after gold moves to its 2008 high.
Moving on to the silver market, let's begin with the long-term chart.
Silver
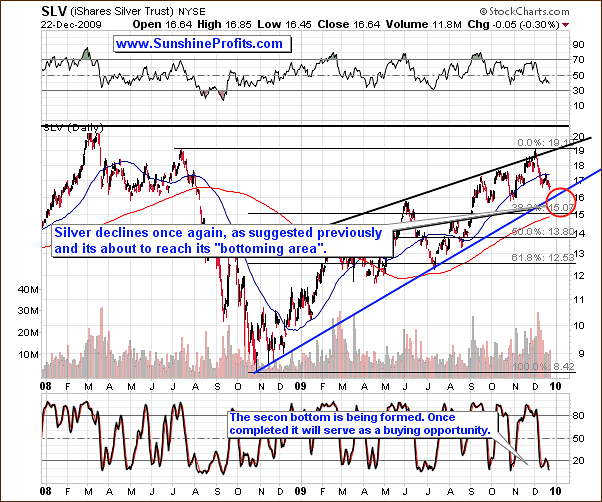
Generally, silver tends to move in a similar way to gold, especially in the short run, so it is often the case that after I analyze the gold market, the silver chart simply confirms points raised in that particular analysis. This time that is certainly the case, with the only difference being that silver is not yet in the "bottoming area" marked with the red ellipse. Still, it is very close to reaching it, so if you were waiting for the early bottoming signals to buy silver as a long-term holding - here they are.
Additional confirmation comes from the Stochastic indicator, which is about to put a second bottom. The double-bottom in this particular indicator often meant that silver is at a favorable buying opportunity. Let's take a look on the short-term chart for more details.
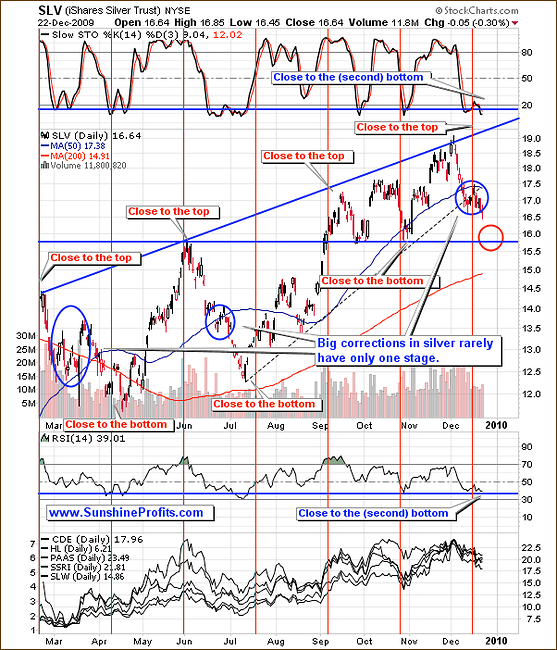
The area marked with red ellipse suggests that the major bottom is not yet in, but may be reached soon. Still, from the long-term point of view, silver is relatively close to the $15.7 level marked on the chart - that's about 6% lower from here. However, silver is now about 12% lower than it was at the latest local top, so it is very probable, that the most of this decline is over. Therefore - analogically to the points made above regarding the gold market - it may be a good moment to purchase your long-term holdings.
Precious Metals Stocks
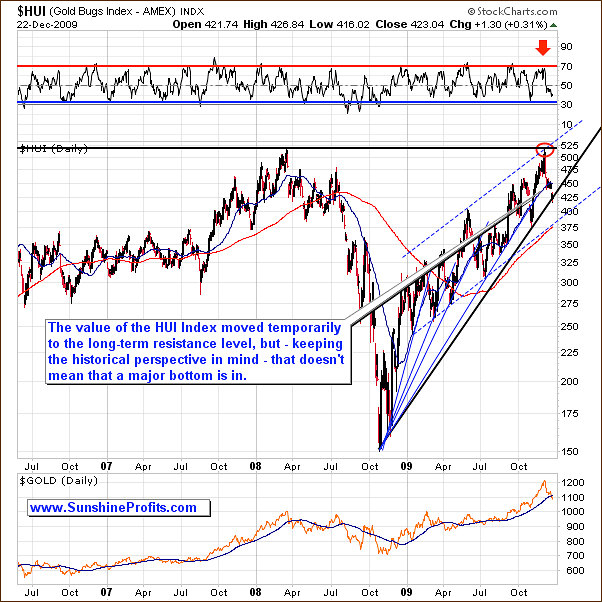
The situation didn't change much from the long-term point of view since the last week. Back then I wrote the following:
Please take a look at the thin blue lines coming from the same price/time combination. Each of them was pierced, before the final bottom was put in, and this is what I expect to take place this time.
The very long-term support line has just been touched. The HUI Index even moved below it on an intra-day basis, but finally closed above this level. Therefore, taking the historical performance of the gold stock sector, it seems that PMs will need to move a little lower before putting in a bottom. The short-term chart confirms this.
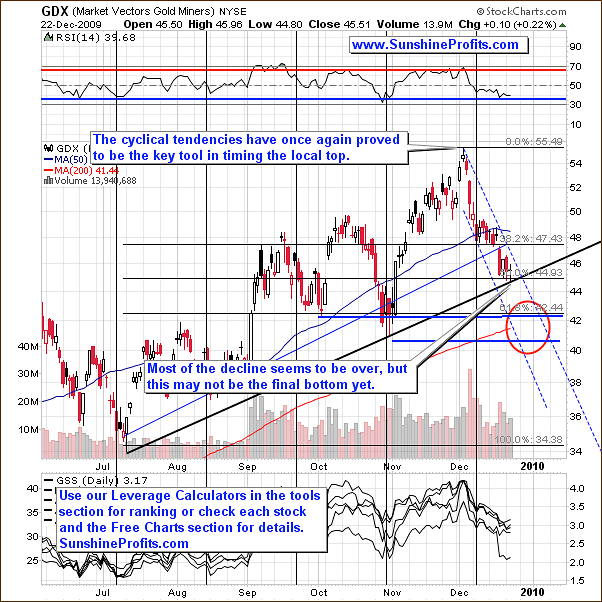
The $45 level, which stopped the decline for a while is created by drawing the medium-term support line from the July and October bottoms, and combining it with the 50% retracement level of the whole upswing.
Still, the upper border of the short-term trend channel suggests that the GDX ETF (proxy for PM stocks) is likely to trade sideways for no more than just a few more days. Naturally, GDX may rally from here, but as far as speculative capital is concerned, it seems that the risk/reward ratio for a long position now in PM stocks is not particularly favorable. It is good enough to initiate a long-term transaction, but not necessarily for day-trading.
The additional confirmation comes from the analysis of the Gold Miners Bullish Percent Index (a market breadth/momentum indicator that is calculated by dividing two numbers: the amount of gold stocks on the buy signal (according to the point and figure chart, which emphasizes strong moves while ignoring small ones) and the amount of all gold stocks in the sector.)
Gold Miners Bullish Percent Index
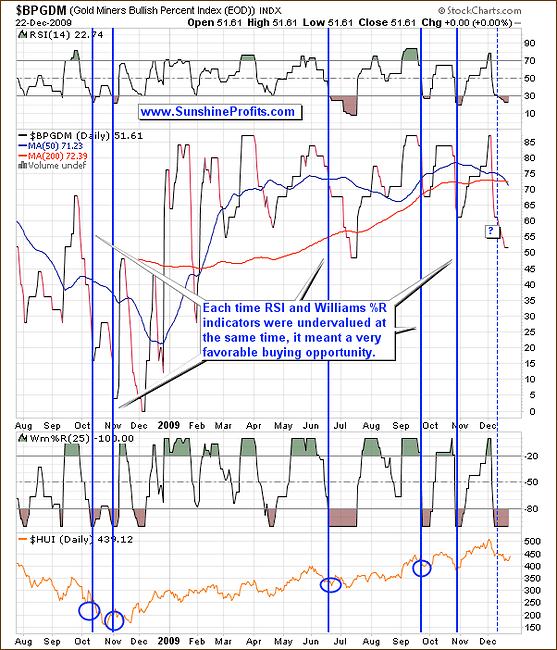
The above chart features the particularly favorable moments for opening long positions in PM stocks. These moments are created by three signals: the value of the index declined significantly, the value of RSI is below 30 and the value of William's %R is below -80. This has been the case for several days now, but please note that the buying opportunity used to emerge several days after the initial signal, so this is what I expect also here.
Naturally, this is not a signal for day-trading, but rather for estimating the medium term bottoms / tops. The implications of the above analysis are in tune with what I wrote previously - we are at / near a buying opportunity from the long-term point of view, but the short-term situation is still cloudy.
Having covered the situation in the precious metals market, let's move to the analysis of the key drivers of the PM prices. However, this time, I would prefer to begin with commenting on the strength of influence from each of the key drivers on the precious metals, so that you will know how important the following part of the analysis is at the moment.
Correlations
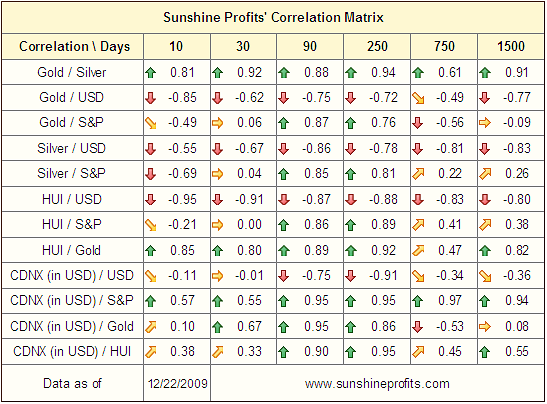
I didn't mention the correlation matrix in the past several issues, because there was very little to report on. The short-term values of the correlation coefficients have been in tune with their long-term counterparts. Gold, silver and precious metals stocks have been moving on average in the same direction as the general stock market did, and in the opposite direction to the way the USD Index moved. In other words, there was no visible divergence that would indicate a top or a bottom, or anything else that would create value for you.
The reason that I've decided to include the correlation table in this weeks update is that it finally features a divergence between the current value of the correlation coefficient for PMs and the S&P 500. The values of the correlation coefficients are currently not in tune with their historical norms. In fact, no matter which of the above S&P 500 correlation coefficients one takes into account (with gold, silver or the HUI Index), it is clear that the correlation has been very low in the past month: 0.06 for gold, 0.04 for silver, and 0.00 for the HUI Index. This means that during the past month, the precious metals market has been trading independently from the general stock market. Consequently, if the main stock indices finally plunge, it may not mark the beginning of a new serious downleg in the metals. Therefore, from the PM Investor's point of view, the analysis of the general stock market and its implications is now less meaningful.
This wasn't the case a week ago, but things can - and often do - change fast in the markets, so I am reporting to you accordingly.
General Stock Market
Last week I wrote the following:
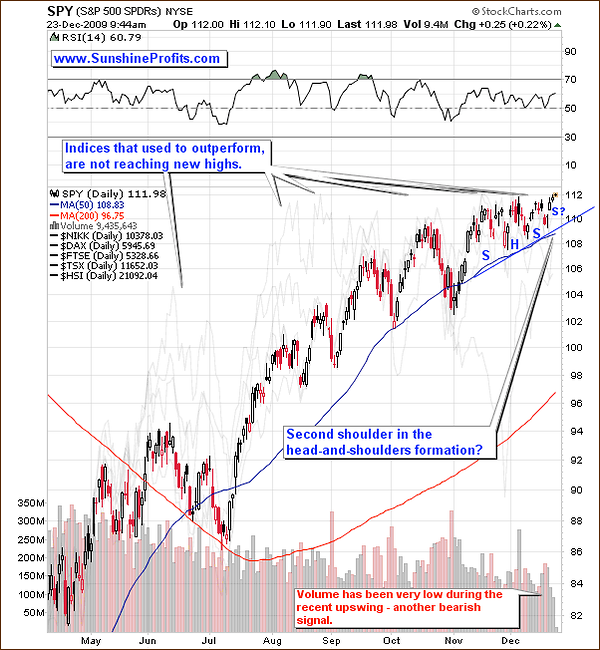
The previous bearish situation in the main stock indices did not change this week. We've seen the general stock market rally once again, but the upswing has once again failed to move above the previous highs, which is another bearish signal. Moreover, this created a head-and-shoulders pattern, which means that once we move below $110 in the SPY ETF, the following decline is likely to stop no sooner than at $107.
The bearish implications of this chart are strengthened by the corresponding volume - which is higher during downswings than during upswings.
The only change this week is that the head-and-shoulders formation has been partly invalidated by the fact that the SPY ETF moved higher. Another way to look at it is that this head-and-shoulders formation is a version with two right shoulders (which makes sense as long as volume declines during upswings and rises during downswings).
No matter how one decides to call the current formation, the recent move up took place on a very low volume, and the situation is bearish either way.
Please note that the values of the correlation coefficients (in the table included in the earlier part of this update) are still meaningful for the PM sector and the USD Index. The values amount to: -0.62 for gold, -0.67 for silver, and -0.91 for the HUI Index - especially the latter appears to be inversely affected by the action in the U.S. Dollar. Consequently, the analysis of the USD Index is still crucial for the Precious Metals Investors. Let's take a look at this particular market from the long-term perspective.
USD Index
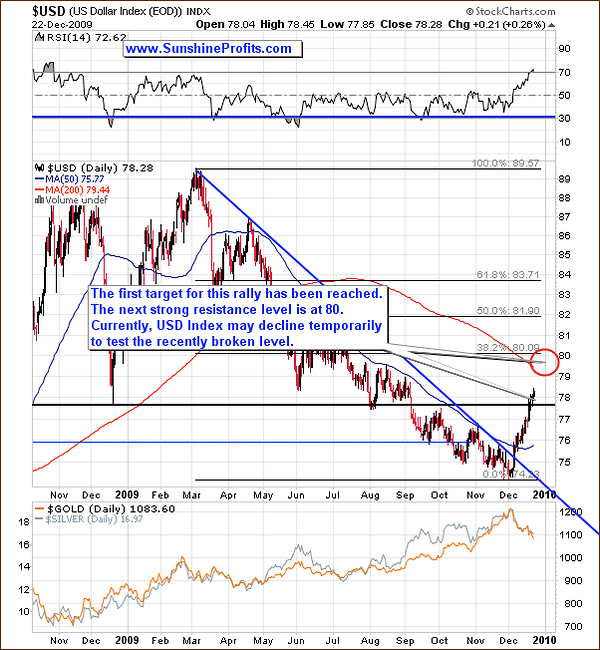
The rally that ignited after the breakout from the declining trend has been quite impressive, but it didn't reach the target value of 80 yet, so USD Index is still likely to put the negative pressure on the prices of precious metals. However, since the upswing has been very sharp, it seems that a few days of pause are likely. This could translate into a verification of the recently broken resistance - the black vertical line. This is even more visible on the short-term chart.
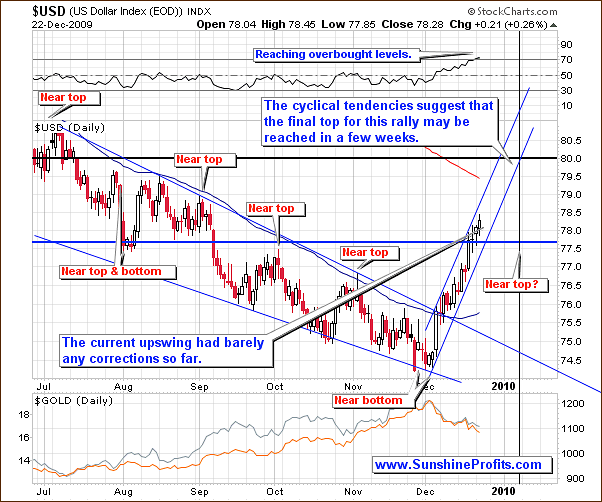
The thick blue line has been broken, but there was no test that would verify it as a support. This doesn't have to take place, but these types of verification are quite common, so it is natural to expect one. Of course, you may take whatever action you wish regarding your investments and that is perfectly fine with me, but I personally wouldn't trade such a small move.
Additional signals come from one of our unique indicators (from the Premium Charts section), which signaled an "extreme" several days ago.
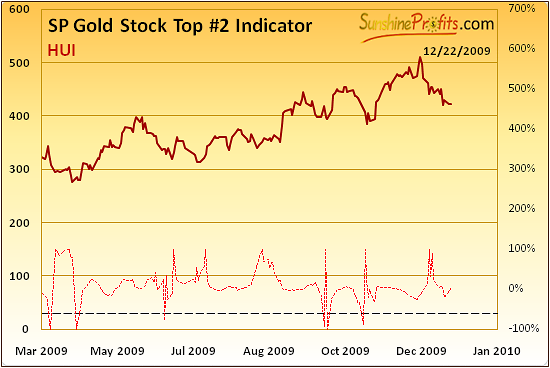
Sunshine Profits' Exclusive Indicators
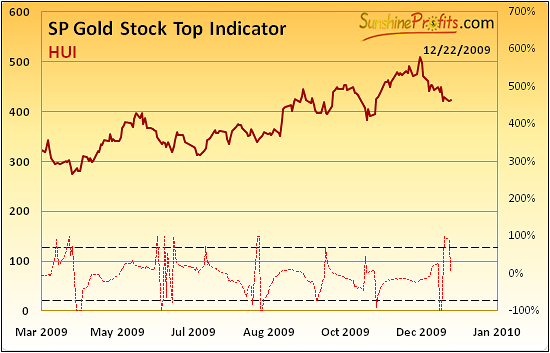
The signal that I'm referring to is the move above (and consequently below) the upper dashed line on the SP Gold Stock Top Indicator chart. Please take a moment to compare the recent event to the previous moments in history, when this indicator flashed a signal. As you may see, this signal often corresponds to a turning point, but if that is to be a bottom, then it is usually an early sign. In other words, you know that the "go!" green light is going to flash any second now, but it's not visible yet.
One way to deal with it is to look for confirmations in other tools. One of them is our second indicator that signals extremes.
Please note that the majority of bottoms were not reached until there was a confirmation from the above indicator. There was no such signal so far, which means that the bottom is likely to be put in the (most likely not too distant-) future, and that it didn't take place yet.
One more thing that I would like to cover this week before summarizing is the fact that although the decline has been rather sharp, and has been in place for several weeks now, I am receiving more and more messages with questions about shorting the market. The latest one was about shorting different parts of the PM market - which is better to short - gold, silver or PM stocks.
I get the feeling that many Subscribers are considering shorting the PM market right now, so I would like to comment on that particular matter.
First of all, from my point of view, it seems that this is not the best time to be initiating a bet on lower prices. Yes, PMs may go lower, but if they do, the size of the decline is not likely to be really profound. Moreover, the fact that I'm receiving many questions about shorting the PM market indicates that many investors have in fact already opened short positions - and when a lot of people get on one side of the boat, it's usually dangerous to join them.
If I wanted to short the PM market, I would wait for an advance on low volume to maximize the chance that the market will indeed move much lower in the short term. Given that gold, silver and PM stocks would all move up, I would short the one, whose rise is smallest on a percentage basis. Without using any derivatives it seems that PM stocks would be the best choice due to their short-term volatility.
Let me emphasize that I'm not advocating shorting the market at this moment, and the above is just a theoretical discussion about the possibility of profiting on the very-short-term price swings. Naturally, the main trend remains up.
Summary
Gold is currently in the area that I've marked as the level that is likely to contain the end of the current decline. The area is relatively big, which makes this signal not very useful for day-traders, but if you were waiting on the sidelines with your long-term capital in order to get back on the long side of the gold market - it seems that this is a good moment to do so. If you prefer to enter the market over a few days instead of making one single big purchase (I'm not advocating dollar-cost-averaging over several weeks / months), it might be a good idea to start now/soon.
The general stock market once again appears to be topping, and it seems that we may see a move lower after Holidays, however based on the recent numbers from the correlation matrix, it seems that the general stock market may have a limited impact on the precious metals market.
On the other hand, the situation in the USD Index seems to influence PM prices to a great extent, and since it doesn't appear to have topped, I think that the PMs will move lower once again, but not necessarily right away.
Other Information
As indicated last week, the next Premium Update is scheduled on December 30th.
I would like to take this opportunity to wish a happy and wonderful Holiday Season to you and your families.
This completes this week's Premium Update. Thank you for reading.
Sincerely,
Przemyslaw Radomski

