Last month we wrote that in 2011 we are likely to see social unrest, demonstrations and riots as rising food prices will send thousands to the streets. Despite our prediction, along with almost everyone else, we have been taken off guard by the tumultuous and historic events unfolding in Egypt. We are worried about the geopolitical implications of the moderate, pro-west Arab governments falling like a bunch of dominoes. There are large black swans paddling in the Middle East pond that could have a significant effect on precious metals, oil and stock markets.
Speaking of black swans, Nassim Taleb, author of the 2007 bestselling book “Black Swan,” said this week that Saudi Arabia is "perfectly unstable," like Egypt. The metaphor of the black swan encapsulates the concept that history is littered with rare events that have come out of left field and had a major impact on history. After the fact, the event is rationalized by hindsight.
“History and societies do not crawl. They make jumps,” he writes in his book.
Almost 40 percent of the population in Saudi Arabia, which is the world's largest oil exporter, is under 15. The country is ruled by the Al Saud family, which relies on support from the Sunni Muslim clerical establishment under a 1744 pact.
With high proportion of young people, countries in the region suffer from unemployment and dissatisfaction with corruption and long-entrenched leaders. We don't need to tell you about the severe impact on the world's economy of troubles in Saudi Arabia.
Egypt has been an ally of the United States for more than 30 years but the new leadership that will emerge is a big unknown. Egypt's Islamic extremists are probably not getting much sleep lately because they plotting how they can take advantage of the situation to acquire more power. We wrote in our Premium Update of January 21st that Tunis may go down in history as the Arab equivalent of the Polish Solidarity movement in 1980 that sparked wider protests that ultimately led to the collapse of the Soviet Union and its empire. That may yet prove to be prophetic.
Already this week in an effort to stay ahead of the street, Jordan's King Abdullah II, bowed to public pressure and fired his government. The new prime minister is supposed to quickly boosting economic opportunities and give Jordanians a greater say in politics.
In an effort to avert “Days of Rage” Yemen President Ali Abdullah Saleh said this week that he won't run for re-election when his term ends in 2013, and that he won't attempt to pass on the presidency to his son, abruptly ending his bid to change the constitution to erase all term limits on the post.
In Israel, which has peace treaties with only Jordan and Egypt in the Arab world, Prime Minister Benjamin Netanyahu said the situation in Egypt could affect Israel's security for years to come. Let us hope that even with changes in regime the peace treaties will be worth more than the paper on which they were written.
We believe that more social unrest is in the cards, and not just in the Arab world. Keep in mind that rising food prices can cause starvation in much of the developing world where food makes up a big part of the daily budget. Prices of agricultural commodities have jumped to new highs, with sugar hitting a 30-year peak, as global weather conditions continued to adversely affect production prospects. Food commodities traders increasingly believe that the worst effects of the current spike are still ahead of us, both in terms of further price rises and the potential for civil unrest.
Investors are fleeing Middle Eastern paper for hard assets. There are fears that if the Suez Canal were to close oil prices would shoot up. Keep in mind that 8% of all sea traffic traverses the canal. The blocking of the Suez Canal or nearby pipelines could pose a threat to world energy supplies.
Egypt is not a major oil producer (perhaps that’s why there are some misconceptions about it?), and Western oil and gas companies have halted most drilling in the country. But it is a crucial link for oil and gas headed to Europe, Asia and the United States. More than two million barrels of oil and petroleum products go through the Suez Canal daily. If not for the Canal, the crud would have to be sent around the Horn of Africa, adding about 16 days’ time to the journey. About 4.5 percent of global oil supplies flow through the canal and a pipeline, which connects the Red Sea with the Mediterranean.
Also, about 14 percent of the global liquefied natural gas trade is shipped through the canal as well, providing critical supplies to Spain, and to a lesser extent, South Korea and the United States. Egypt also produces about 3 percent of the world’s liquefied natural gas supplies.
But let’s leave the Middle East for a moment. On the other side of the globe, the Chinese are celebrating their New Year, the Year of the Rabbit. This year China pulled a rabbit out of the hat and China’s gold imports are estimated to have more than doubled from a year ago in the run-up to Chinese New Year. This means that China is on track to overtake India as the world’s largest consumer of the yellow metal. China consumes about 527 tons of gold a year, according to the World Gold Council, an industry body representing gold miners. Traders say China will overtake India as the largest consumer of gold this year. The Indian festival of Diwali was once the key driver of seasonal demand patterns because of the large number of weddings taking place during the holidays. But Now Chinese new year is starting to have a bigger impact.
The growth in demand is being attributed in part to Chinese families giving each other gifts of gold instead of traditional red envelopes filled with cash. Fears of inflation have also driven demand for gold.
Precious metals traders in London and Hong Kong said this week in a Financial Times article that they were stunned by the strength of Chinese buying in the past month. “The demand is unbelievable. The size of the orders is enormous,” said one senior banker, who estimated that China had imported about 200 tons in three months. (Just to keep things in perspective, it made headline news around the world when India bought 200 tons of gold from the IMF in November 2009.)
There is so much demand that prices for physical gold in Shanghai have been at a premium of about $20 per troy ounce over those in London.
So if you have a (very good) friend in China you might consider buying them a gift of a small 100 ounce bar elaborately engraved with auspicious rabbit idioms or scenes of rabbits at play, or perhaps a 20-ounce carved rabbit bar.
To see if we can pull a rabbit out of a hat and tell you how gold will perform in the near future let's begin this week's technical part with the analysis of the Euro Index. We will start with the short-term chart (charts courtesy by http://stockcharts.com)
Euro - USD Indices
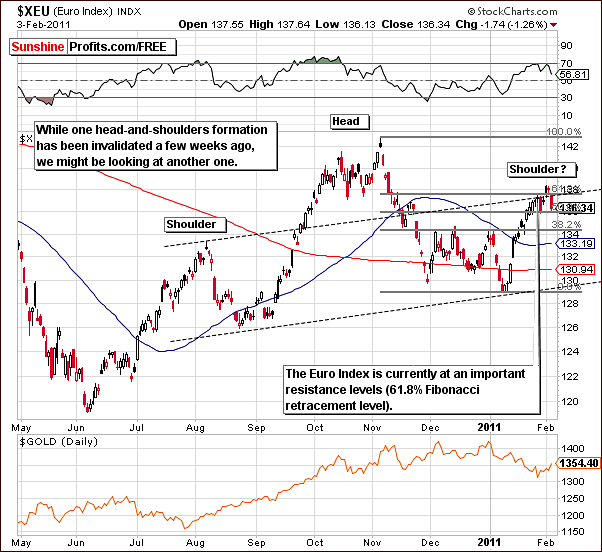
In the short-term Euro Index chart this week, we see a number of bearish signals, which will likely lead to a bullish sentiment for the USD Index as will be seen on the following chart. Here, we have originally seen that perhaps the right shoulder of the bearish head-and-shoulders formation has been invalidated at the beginning of this week. However, the price moved quickly below the rising dashed line, thus invalidating the insignificant breakout. Consequently, the head-and-shoulders formation is still forming.
This is of course a bearish signal going forward for the euro and of course will lead to a bullish sentiment for the USD Index as well as possibly for gold, silver and mining stocks. Of course the general stock market may also influence the precious metals sector to a great extent.
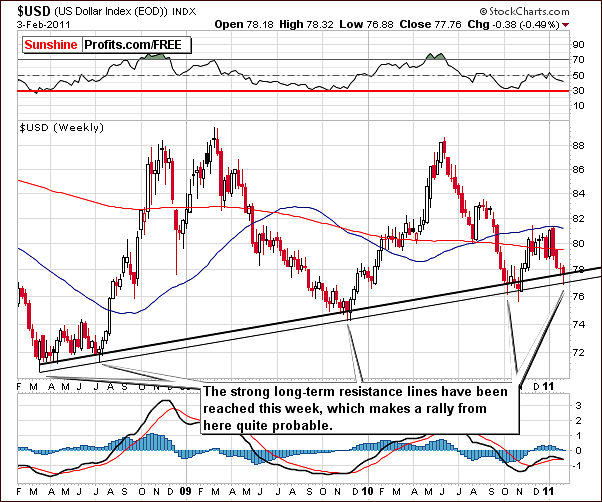
Our first USD Index chart shows the close proximity at present to the long-term support level. This level has actually been touched and the index has once again begun to move higher. Based on this factor alone, a bounce would be likely, and we have another strong factor in favor of higher USD values - the cyclical turning points.
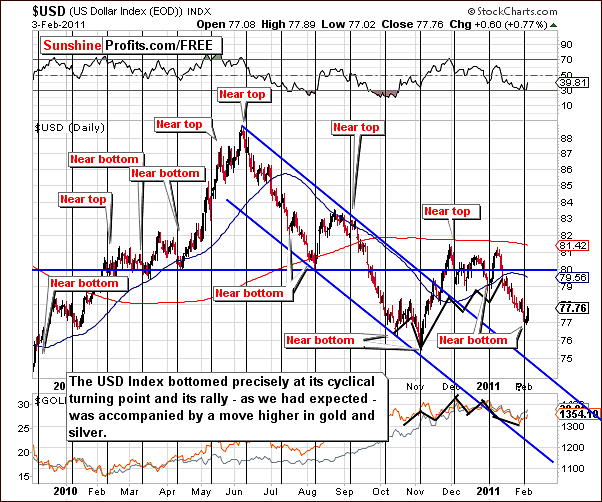
A closer look at the above chart shows that at least a local bottom has been reached precisely as indicated earlier – at the cyclical turning point. Please note that the RSI indicator is also suggesting higher values of the index in the short run, as it reached the 30 level, which we view as a buy signal.
As mentioned in Thursday’s Market Alert, this is not likely to have any negative impact on gold, silver and mining stocks; there could, in fact, be a positive impact.
Although it is often believed that rising dollar is bearish news for gold, silver, and mining stocks, that was not the case during the past several months. The USD Index was leading precious metals, and now appears to be trending in tune with them.
On Thursday – after the abovementioned alert has been sent out - higher values in the USD Index were seen and a rally took place in the precious metals sector as well.
Summing up, the outlook is bullish for the USD Index and also for gold, silver and mining stocks. The precious metals have been led by the price action of the dollar in recent weeks but now appear to be moving in tune with the trends seen in the USD Index. Of course, all this bullish sentiment is paired with just the opposite, a strong bearish outlook for the euro.
The technical situation in these two currency indices is particularly interesting, as the USD Index is likely to rally (based on i.a. strong support levels being reached and the cyclical turning point along), which would cause the head-and-shoulders formation in the Euro to be completed. That would likely cause a decline in the Euro and further upswings in the USD Index.
General Stock Market
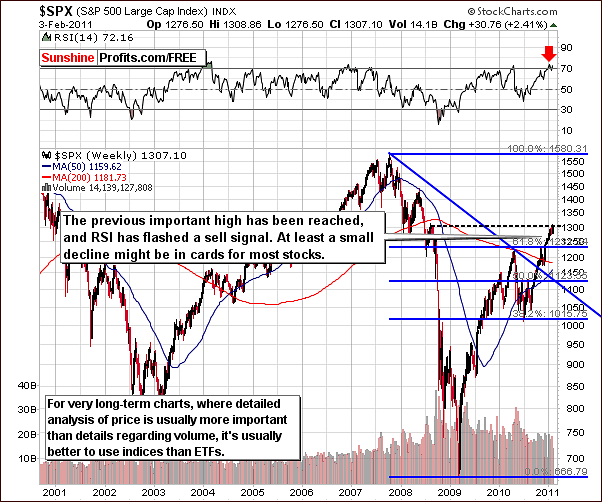
Although there has been a great deal of volatility in the general stock market recently and multiple back and forth movements in closing price levels were seen on daily basis, there is no change seen from the long-term perspective. The overbought situation as indicated by RSI levels continues to be prevalent.
Additionally, the general stock market is close to the level of a previous important high seen in 2008. This is as a result of a big and significant rally, which began in mid-2010. Since that time, the rally paused only one time, and the pause itself was rather insignificant from the long-term point of view.
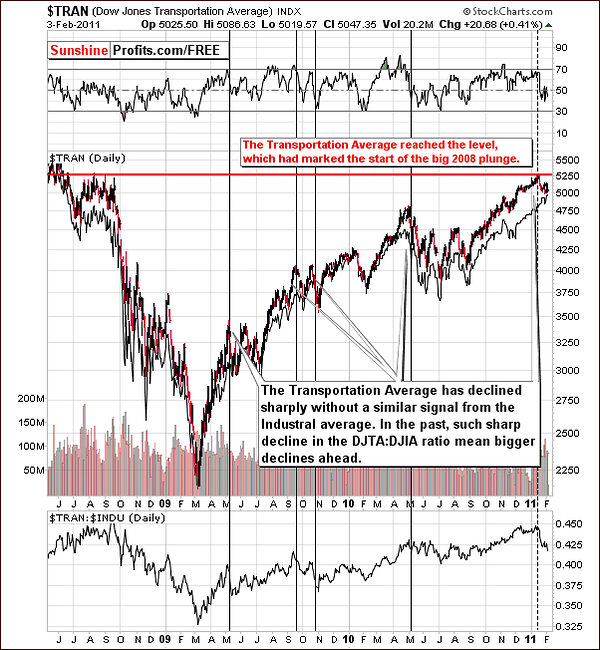
The Dow Jones Transportation Average Index this week reveals some important developments. There has been a great divergence between the transportation sector and the industrials and the transportation:industrial ratio has therefore declined significantly. It has moved down about 5% since the first day of the year and is now below 0.425. Declines of this type are normally followed by significant declines in the industrials and in the general stock market overall. Consequently, the situation is still bearish from the medium-term point of view.
It is likely that declines back to the highs seen in 2010 will be seen eventually though it may take several weeks to get there. This development could have a negative impact on the precious metals and especially on silver in the medium-term. We are still bullish on silver in the short-term, however, and long speculative positions are still justified.
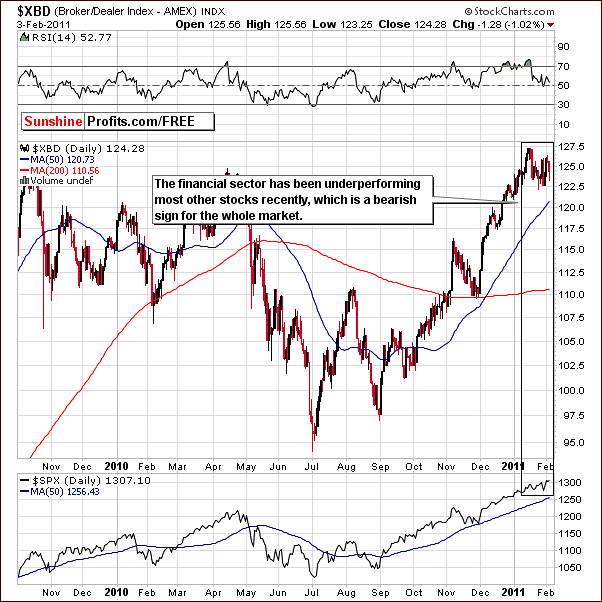
The financial sector also provides some signals this week with bearish implications. This group of stocks has been underperforming the general stock market and frequently what happens here is followed by similar trends for stocks overall.
Summing up, the sentiment for stocks continues to be bearish for the medium-term and a move to the 2010 high is still probable. In the short-term, although severe declines may not be seen, there are more bearish signals than bullish at this point.
Correlation Matrix
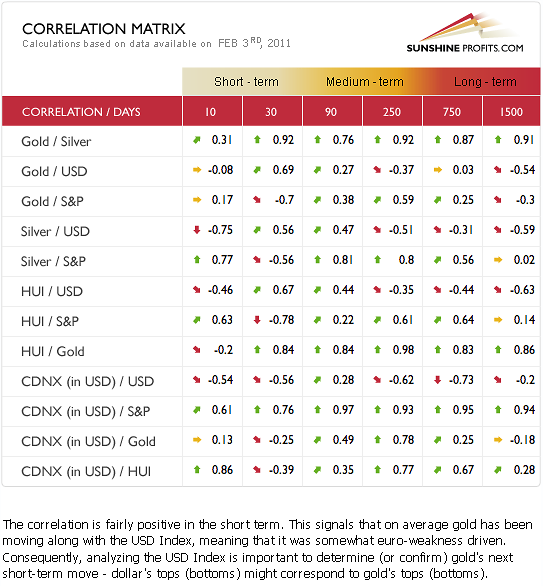
In this week’s Correlation Matrix, we see a relatively strong positive relationship between the precious metals sector and the dollar in the short term (30-day column). In other words, we have a numerical representation of what we mentioned earlier – the USD Index currently moves along with metals.
There is a quite interesting phenomenon in the 90-day column, as all assets appear to be positively correlated with each other. Still, there are only a few cases where the strength of the correlation is significant, and that is silver vs. stocks, gold stocks vs. gold, and juniors vs. stocks. While the gold stocks and gold virtually have to be highly correlated (gold mining companies’ profits depend on the price of gold), the other two pairs provide us with important insight.
The implication is that a correction in the general stock market will likely have a greater impact on juniors and silver. Still, juniors normally perform well in the final part of a rally and we have therefore not issued a sell or switch-to-seniors signal at this time. More on juniors on the following part of this update.
Gold
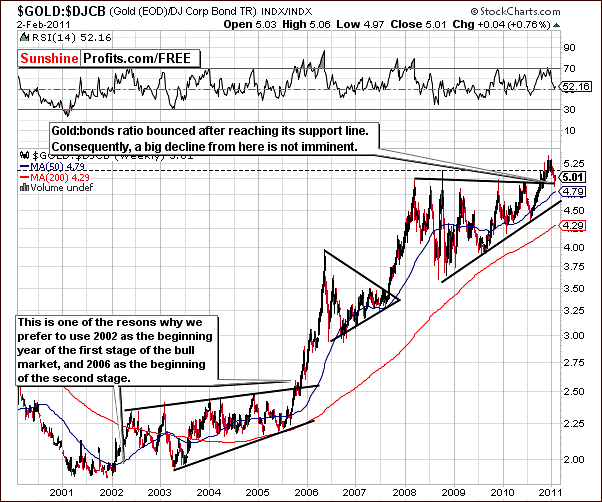
Once again, we begin our gold section this week with a look at the ratio between the price of gold and corporate bonds. Last week, we stated that gold was at a crossroads when viewed from this perspective as it had indeed reached an important support level at slightly below the value of 5 for this ratio.
Since that time, we have seen a bounce after the support level was briefly touched. That is to say, the support level held. This is an important development from a technical point of view, and currently provides us with bullish implications, as a big drop from here does not appear imminent.
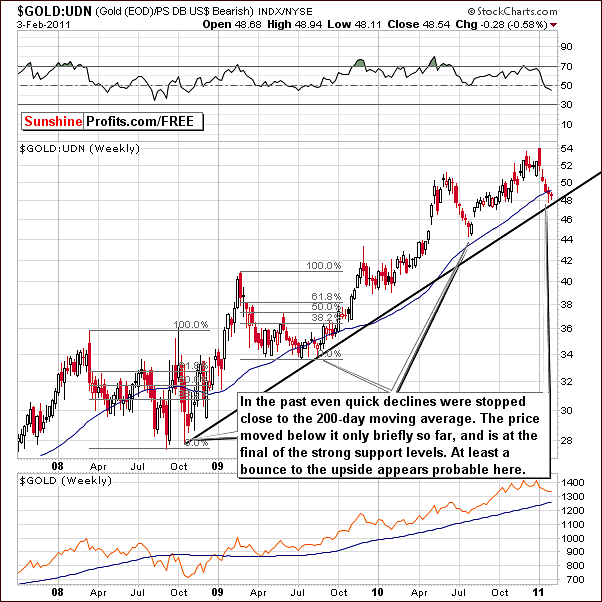
From a non-USD perspective, the situation has changed little since last week. Index levels remain slightly below the 200-day moving average. It is probable that the index is close to or at a local bottom as it has declined recently to a point quite close to its long-term support line. A turnaround from here is likely – especially given the bullish situation in both: gold and the USD Index.
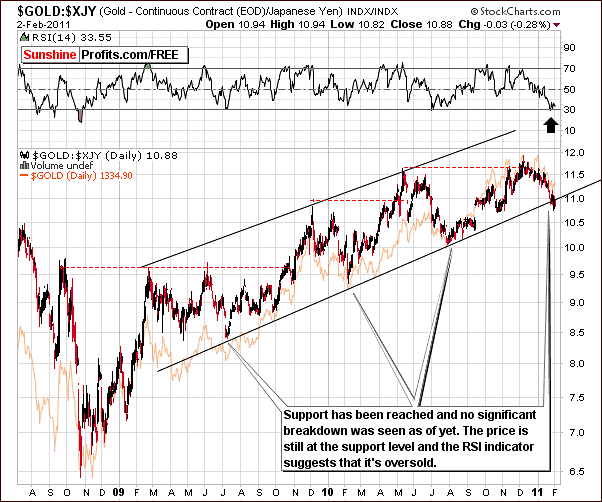
Looking at gold’s price action once again in terms of the Japanese yen, we see that the situation is still oversold. A further bounce from here is therefore likely. In recent days, prices have moved back and forth around the support level. No breakdown has been seen as of yet and there are no significant bearish implications here at this time.
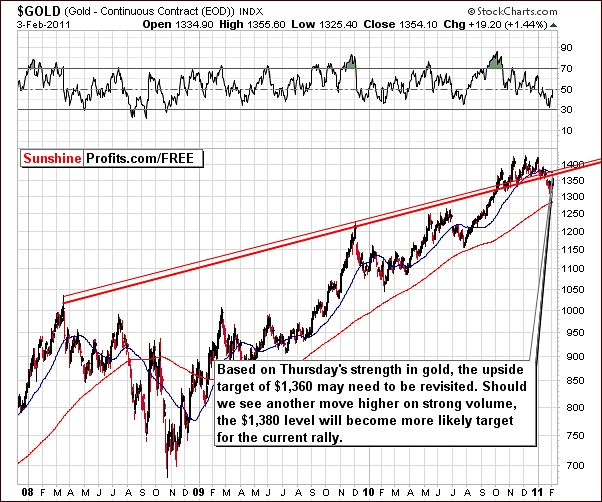
In the long-term chart for gold this week, we see movement towards the previously defined target level of $1,360. The price-volume action seen on Thursday however leads us to believe that $1,380 is a more likely target. This would coincide with the upper red line in the long-term chart. This line is based upon intra-day highs of 2008 and 2009.
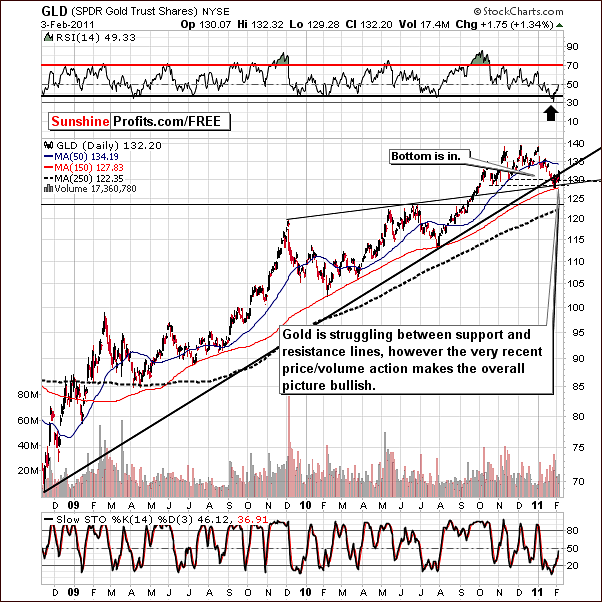
In the medium-term chart, we can see gold’s price attempting to move above the long-term support line. It appears to have bottomed recently close to two support levels (October 2010 lows and the rising thin black support line). The move higher however may be short lived and we will continue to monitor this situation closely in the week ahead.
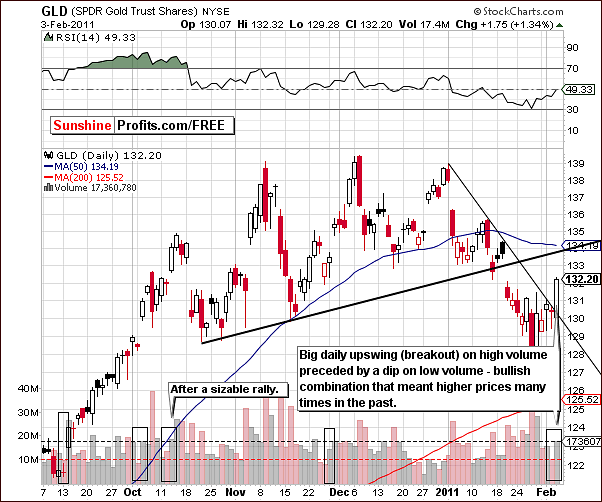
Our final gold chart is the short-term view, in which volume and price action can be best analyzed. Wednesday’s slight decline in price was on relatively low volume. When volume is reviewed over the past few months, it is clear that this week’s daily volume levels have been quite low. Remember that end of year daily volume historically declines due to the holiday season. Looking back a bit further in 2010, this week’s volume closely resembles what was seen in late November. At that time, second part of gold’s big rally materialized (the first was in late-October). This, and other comparable periods are illustrated with vertical, rectangular boxes in the volume section of the chart.
Therefore, it appears that higher gold prices are likely to be seen soon. In the past, similar price increases on sizable volume have usually been followed by the onset of a rally. The only time this was not seen recently was when it occurred just after a sizable rally (in mid-October 2010) had been seen. With the declines of the past several weeks, it’s obvious that no rally is preceding this point in time. It appears therefore that, as in the majority of recent similar price volume actions, higher prices are likely to be seen soon.
Summing up, the situation appears bullish for gold at this time. The analysis of our charts here confirms the points made in Thursday’s Market Alert. Speculative long positions appear to be justified at this time.
Silver
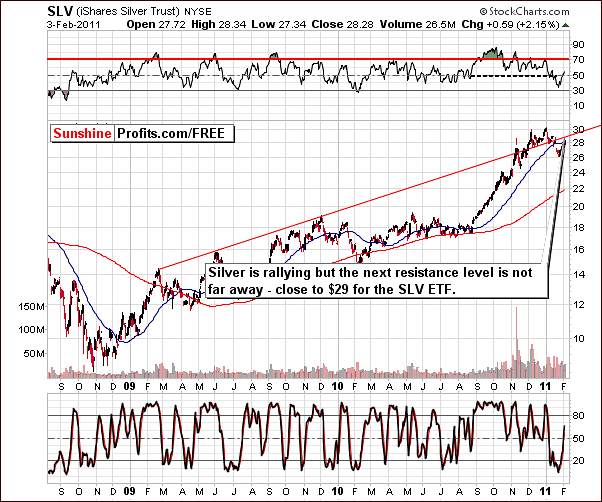
This week’s long-term chart for silver shows its recent rally since reaching a local bottom. The SLV ETF is slightly above the $28 level at this time and still has room to grow with the next resistance level in the $29 range ($29.6 in spot silver).
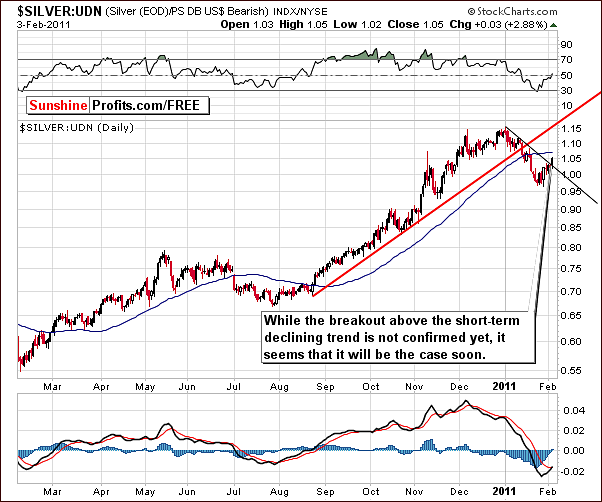
In this week’s non-USD perspective on silver, we see somewhat of a breakout on Thursday suggesting that perhaps higher prices are likely. It seems that this holds true especially for the short-term and this further confirms that a bet on higher prices for the short-term may be justified at this time.
Some of the recent price action is worth noting specifically here. After moving above the short-term resistance line, there was a small decline and a slight verification on an intra-day basis of the breakdown before the support level was once again verified. Higher prices followed these quick moves and this is a very bullish indication for the following days.
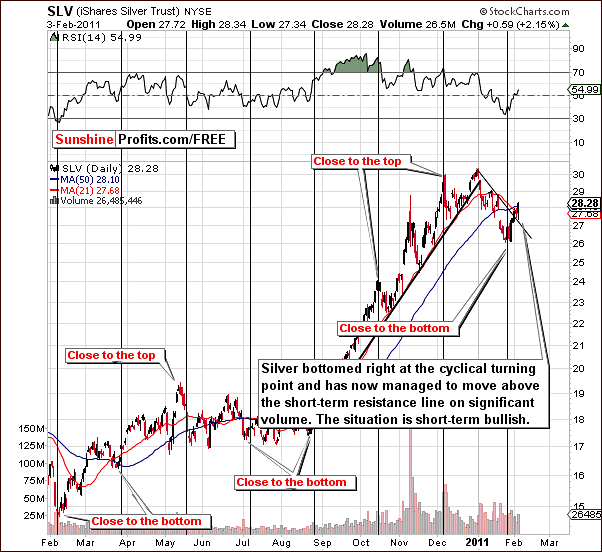
In this week’s short-term chart, we see silver’s recent breakout from the USD perspective as well. The resistance line formed from previous intra-day highs has been broken and this followed a local bottom which took place right at the cyclical turning point, as we indicated in last week’s Premium Update. The silver’s price action since has very bullish implications for the following days.
Beyond the short-term, however, the picture is not so rosy for the white metal. The risk of a large correction in the general stock market makes medium-term silver investments much riskier than those in gold since silver is historically more correlated with stocks than is gold. Speculative capital in silver is fine but moving a portion of long-term silver holdings to gold is probably still a good move at this time, if you haven’t already done so. The risk-reward ratio for gold medium-term is simply better than that for silver right now.
Summing up, the outlook is bullish short-term for the white metal as was the case for gold. Higher prices in the short-term appear quite probable at this time and betting on this with one’s speculative capital seems to be justified today. Long-term holdings in gold, however, are preferred over the same in silver.
Mining Stocks
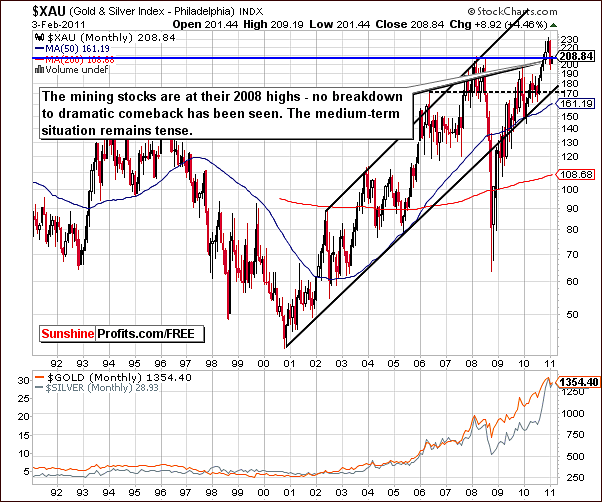
The XAU Index of gold and silver mining stocks this week shows price levels to be in the area equal to the highs of 2010. No breakout has been seen above these levels nor have any prolonged declines below this range been seen. In short, the situation is truly quite tense at this time. No clear medium-term direction can be developed today. We will continue to monitor this situation and provide addition details to you as the situation unfolds.
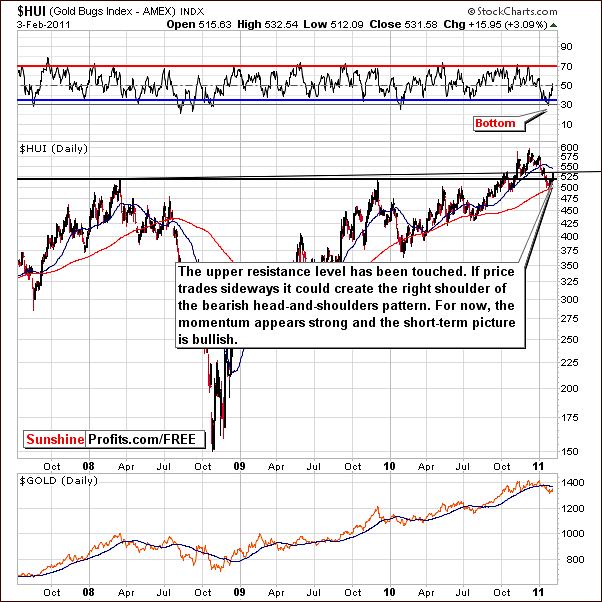
This week’s HUI Index chart has a slightly different shape than the one seen previously, but the implications are similar. It is possible that we are seeing the development of the right shoulder of a possible head-and-shoulders pattern. In the days ahead, if higher prices are seen and at the same time buying power appears to weaken (volume declines significantly), and finally the rally will stall, this will likely confirm the formation of this bearish pattern.
It is not certain at this time that such developments will be seen. In order for this pattern formation to be invalidated, higher prices on strong volume would be required. The uncertainty in this area should be much clearer next week.
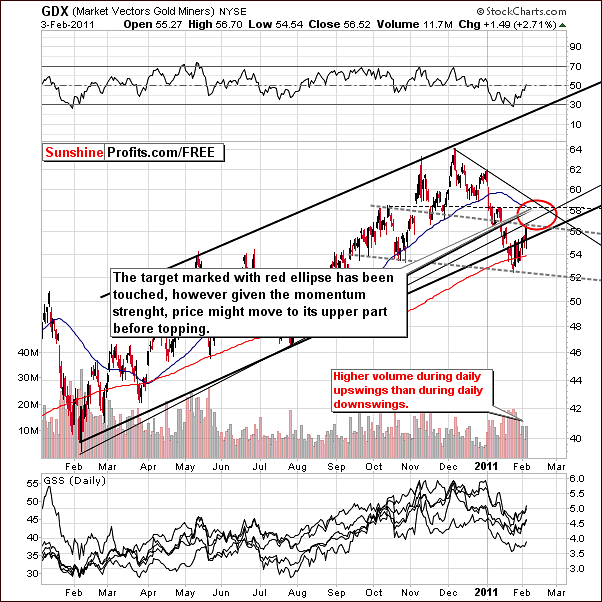
On the short-term GDX ETF chart above, we also see a possible beginning to a head-and-shoulders pattern. It is much too early to make a bearish call today but we will continue to monitor this situation closely and report to you accordingly.
For now, the strong momentum of mining stocks has been confirmed by volume levels recently. Namely, higher volume levels during daily upswings were seen as compared to daily declines, which is a bullish indicator for the short-term. Speculative long positions appear justified at this time, also by the fact that Thursday’s upswing took mining stocks above their first medium-term support line (black thick line on the chart).
Meanwhile, the red ellipse is still likely to include the next local top. It has just been touched, however it might be the case that mining stocks move further up – especially given recent price/volume action, and points made in gold and silver sections earlier in this update.
Summing up, on Jan 25th, 2010, we wrote that we think that speculative capital should be used to bet on higher prices of precious metals in the short run, and we did not change our bullish outlook since that time - the short-term bias for the mining stocks appears bullish at this time. Several key situations must be followed in order to comment beyond the next few weeks. The XAU Index will likely move outside of its narrow recent trend channel and this will provide important evidence in developing long-term projection for the mining stocks. Similarly, the possible head and shoulder’s pattern seen in the medium- and short-term chart could either further develop or be invalidated in the week ahead.
Sunshine Profits Indicator
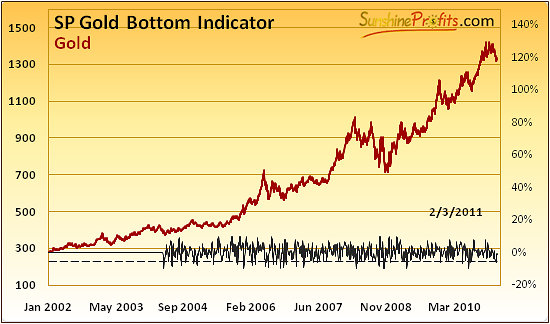
We featured the SP Gold Bottom Indicator over a week ago, when we wrote the following:
Finally, we have just seen a long-term buy signal from our SP Gold Bottom Indicator.
Previously we have seen it at the end of July 2010, right before the over-$200 rally, and before that we have seen it on May 21st, 2010 (another local bottom) Dec 9th, 2009 (insignificant bottom, however prices still moved briefly above it before the decline was over), and April 9th, 2009 (almost precisely at the bottom).
As you may see, we don’t get this signal very often, but when we do, it’s worth taking it into account. The implications here are – of course – bullish.
The reason we mention this indicator once again is that this signal means gain not only in the short run. In fact, it’s likely to be followed by over 5% rally in the following 2 months. Please take a look below for details (the blue line in the middle of the chart):
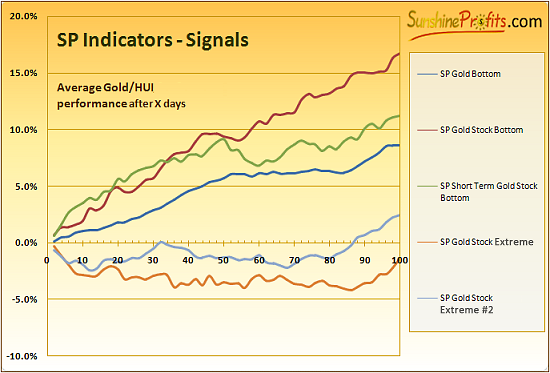
Taking other factors into account it is doubtful that the rally will be a straight line up, but the point is that this signal surely supports a rally toward $1,380 or even higher.
The sentiment for gold here is clearly bullish for the short-term.
Juniors
As stated in the Key Principles section, the list of top juniors will be updated approximately every 4 weeks, so this is the Update that should contain the revised version of the list. However, before providing you with details, we would like to comment on this sector's performance in general.
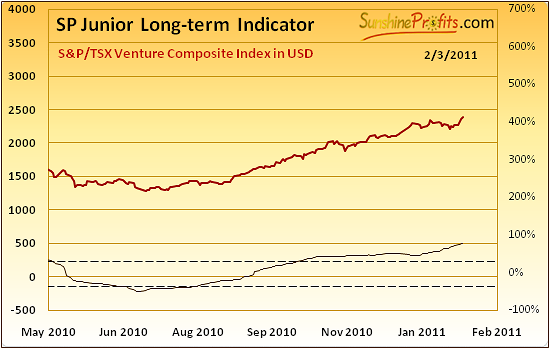
The value of the SP Junior Long-term Indicator has been generally moving higher, with only a small dip at the beginning of the year. Therefore, we do not consider the sell signal for juniors to be in, although technically we have seen a slight decline in it (as a reminder, sell signal for juniors is given, when indicator is above higher dashed line and starts to fall). Consequently the situation remains bullish for the junior sector. It might change along with a plunge in the main stock indices, but it is not the case yet.
Let's take a look at this month's junior lists. We can see only minor changes in top 3 gold and silver miners. Namely the International Tower Hills Mines Ltd., and Gold Resources Corp. have switched places, but are still on the top of our gold juniors list.
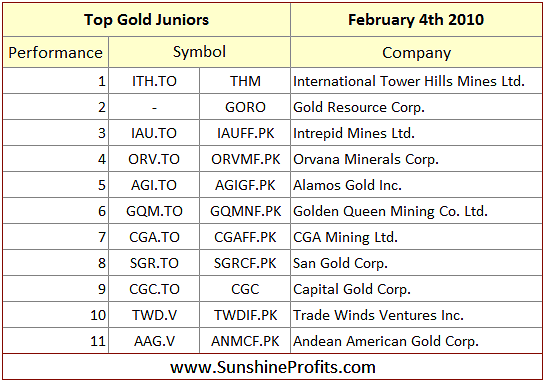
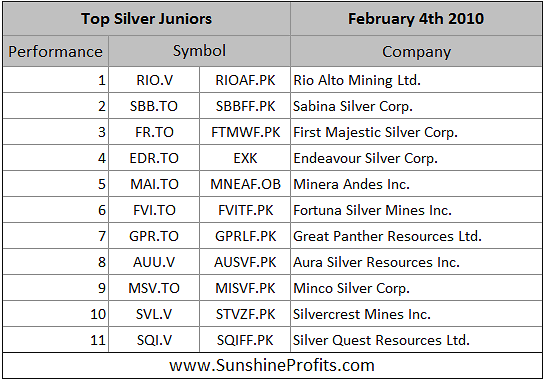
We have decided to remove Centamin Egypt Ltd. (CEE.TO / CELTF.PK) from our list, because of the current situation in Egypt. We believe that Investor’s capital should be invested in a more stable environment. We also decided to replace Aurizon Mines Ltd. with Andean American Gold Corp. Analogous change has been made in silver stocks: Minco Silver Corp. substituted Minera Andes Inc.
Letters from Subscribers
This week we received a question about the Commodity Futures Trading Commission’s plan to set position limits on silver trading.
I understand that this is happening in March, in order to stop big players manipulating the market. I wonder if this will actually end up being a token gesture that does not affect the markets much at all. I would be most interested to know your perspective on this issue and its possible bearing on silver prices going forward.
Fundamentally, not much has changed since we posted our previous comments regarding silver and the CFTC. Please read the Additional Information section in the April 2nd, 2010 Premium Update for details. In short, we would like to see evidence that the manipulation is being taken care of instead of suggestions that it may or may not happen this time. The situation is still bullish for silver, but too often to take it seriously we have read things like: "manipulation is going to end just any day now, buy all the silver you can and then some more." Nonetheless, we've suggested moving ADDITIONAL 10% of one's long-term capital into silver (silver was trading close to $18 back then). We will have more to say on the topic once serious steps are indeed taken in silver's favor. Meanwhile, since the information about CFTC / silver is now publicly known, its development is reflected in silver's price. Therefore, if there's is a good chance of silver moving up very high, we will most likely be able to infer that based on the price/volume action in the main – technical – part of our analysis. In case we're wrong - we always have long-term holdings (including physical bullion) that will appreciate either way.
Summary
The points made in Thursday’s Market Alert remain up-to-date and have been validated by charts and analysis provided above. The USD Index has begun to rally once again and could move much higher in the days and weeks to come especially if the bearish head and shoulder’s pattern fully develops in the Euro Index chart.
The sentiment in the general stock market at this time is bearish for the medium-term (the decline doesn’t have to happen in the following days) and this could carry over to the precious metals beginning in a week or two. A rally will likely be seen in gold, silver and mining stocks prior to this negative impact expected from the general stock market.
Caution is advised for the medium-term especially for silver investors. This also applies for those holding juniors but the suggestion at this time is to hold at least for the short-term as juniors often outperform seniors in the final part of the move up.
For now, speculative long positions in gold, silver and mining stocks appear justified. At the same time, no changes are required in the long-term capital at this point, as silver might still suffer from a bigger drop in the main stock indices.
Our next Premium Update is scheduled for Friday, February 11th, 2011.
This completes this week's Premium Update.
Thank you for using the Premium Service. Have a great weekend and profitable week!
Sincerely,
Przemyslaw Radomski


