
The recent tumble in the price of gold came as no surprise to experienced technical traders and to readers of Premium Update. We gave you a heads up to close out your speculative gold positions before the beginning of the correction. Keep in mind that even the strongest bull markets need to pause and correct before moving higher. I'm not even sure that the decline we have seen so far should be labeled a correction.
Sometimes to see the future it helps to look at the past. I like history and today I want to take two items from the history pile, shake off the dust and see what we can learn.
The first is an obituary for gold that ran in the Financial Times 12 years ago. The title couldn't have been more dramatic - "Death of Gold."
I read it with astonishment pondering how in the fast-paced world, economic reality can change profoundly in a mere blink of the eye.
The article begins by saying that whereas the Three Wise Men deemed gold to be a gift fit for a king, a better gift today (meaning 12 years ago when this article was written) would be US Treasury bonds.
I can almost hear some of you laughing. Who today would prefer a U.S. Treasury bill to gold?
The article goes on to say that "a new breed of central banker is not dazzled by gold and sees little point in having an asset that just takes up storage space."
And therefore, in 1997, the year in which this article was written, the Netherlands sold 300 tons of gold, Australia had reduced its gold reserves by two-thirds and Argentina had sold its entire gold reserves, all 124 tons, and invested the proceeds in US Treasury bonds. Two years later the UK dumped most of its bullion reserves at prices below $300 an ounce.
Contrast that with today's scenario. Central Banks around the world are frantically trying to get way from their U.S. Treasury bonds and purchase gold. After India's central bank bought 200 tons of gold from the International Monetary Fund (IMF) last month, more central banks are joining the stamped to step up their gold reserves. Just a few days after the India announcement, the Central Bank of Sri Lanka announced that it had increased its gold reserves by an undisclosed amount.
Russia's central bank has purchased 180 tons of the precious metal on the open market since June 2006 and just recently, media reports from Moscow indicated that Russia's state repository will sell 30 tons of gold to Russia's central bank. China's central bank said in April that it had built up its gold reserves by 454 tons since 2003 to 1,054 tons, making it the world's sixth largest holder of the precious metal.
Things are 180 degrees different than when the article was written 12 years ago.
The Financial Times article concludes with the following paragraph:
"When it comes to bullion as an investment, and as a measure of national wealth, gold is a goner. The reverse alchemy is almost complete. Eddie George, governor of the Bank of England, like Fort Knox, one of the great citadels of gold, recently told a European parliamentary committee: "Whereas gold used to be seen as a good asset, it is now seen as the bottom of the pile."
If you look up the definition of "sound money" the Wikipedia describes it as "a globally traded currency that can serve as a reliable and stable store of value."
It seems that twelve years after the obituary for gold was written the new definition for "sound money" should be the kind of money that makes a metallic sound when you throw it on the table - gold.
The other item I want to take out from the history bin is the televised speech President Richard Nixon gave in1971, when he announced the ending of the Bretton Woods International Monetary system. You can watch on Youtube by clicking here.
The chief feature of the Bretton Woods agreement, signed towards the end of World War II, was an obligation for each country to adopt a monetary policy that maintained the exchange rate of its currency within a fixed value in terms of gold. The gold standard limited a government, both legally and practically, as to how much paper money it can print. Governments that would print too much paper money would risk runs on their gold reserves.
In his televised speech Nixon assured the American people that their U.S dollars would not lose their value.
"We must protect the position of the American dollar as a pillar of monetary stability around the world," he said.
Blaming "international currency speculators" for attacks on the dollar, Nixon said he instructed the Secretary of the Treasury to "temporarily" suspend the convertibility of the dollar into gold. He called it a mere "technical" action and reassured his fellow Americans that as long as they buy American products their dollar will go just as far as it did before.
Since the early 1970s, when official dollar convertibility into gold ended, the number of dollars in circulation has grown by well over 1400%. In 1971 there were about 776 billion US dollars in circulation, today there are well over 12 trillion. Around the world the supply of paper money is growing at a stunning pace. Because central banks can create money at virtually no cost, the supply of fiat currency tends to grow without any constraint.
So what are the lessons to be learned here? There are several. We already know not to believe everything politicians tell us and everything we read in the newspapers. We know that sometimes when we see a headline like "Death of Gold" it's a good contrarian signal to go the other way.
So the question to ask is have we now reached the top for gold now that there are so many newspaper headlines about the glitter of gold?
In a television interview last week legendary investor Jim Rogers was asked that question. He answered by saying that he had just given a talk in Prague to a room of 300 investment types and asked them how many of them have ever owned gold. Only a handful raised their arms.
It may be that everyone is talking about gold but not too many own it yet, and there is an enormous difference between backing your position with words and backing it with your life's savings.
In one of the previous Premium Updates I analyzed the price of gold in many currencies to ensure that the big picture is clear. Since that was relatively long ago, and there are visible changes from the long-term perspective I would like to take this opportunity to get back to this topic this week. Let's begin with gold priced in Canadian Dollars (charts courtesy of http://stockcharts.com).
Gold in Canadian Dollars
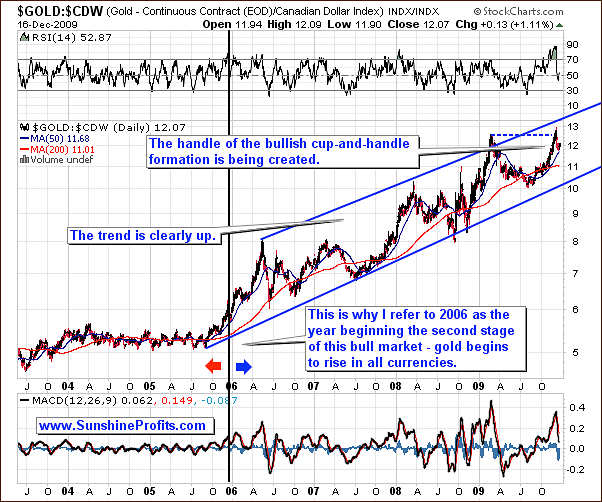
I really like to feature the above chart, because every now and then I still receive messages that gold is rising only in the USD terms, which makes it unattractive for non-U.S. Investors. Usually, these e-mails hit my mailbox when there are several days/weeks of declines in gold, which are visible particularly strong in currencies other than the U.S. Dollar. Naturally, Investors who send me such messages are correct in a way - gold can and does move down in all currencies from time to time, but the point is not to extrapolate the short-term tendencies to the long-term. In other words, commenting on the long-term tendencies (is gold rising only in terms of USD?) requires analysis of long-term-charts, which help to filter out the short-term noise. This "noise" can be useful for timing short-term tops/bottoms, but this is not something that should make you change your overall perception of the market situation.
The breakout above the previous top failed to hold, and price is once again declining. In the Nov 27th update I wrote the following:
Gold in Canadian Dollars is also moving higher, but has now reached its previous high and is likely to consolidate before moving higher. However, please note that the trend is very clear and consequently Investors holding gold for the long run don't need to worry about the health of the bull market in this particular currency.
By the way, please note that the bull market in the Canadian Dollar was barely visible until the beginning of 2006. This is one of the reasons that we use data from the 2006-today time frame in several of our tools.
Gold (in CAD) moved lower - as expected - but I don't think this is a serious breakdown that would invalidate the long-term bullish implications of the chart. What happens next depends to a large extent on the CAD:USD currency exchange rate, but it doesn't seem that gold would move below the 200-day moving average (red line on the chart) - currently around 11. A drop this big would somewhat invalidate the cup-and-handle pattern, but the technical picture would remain bullish even despite this fact.
Gold in Euro
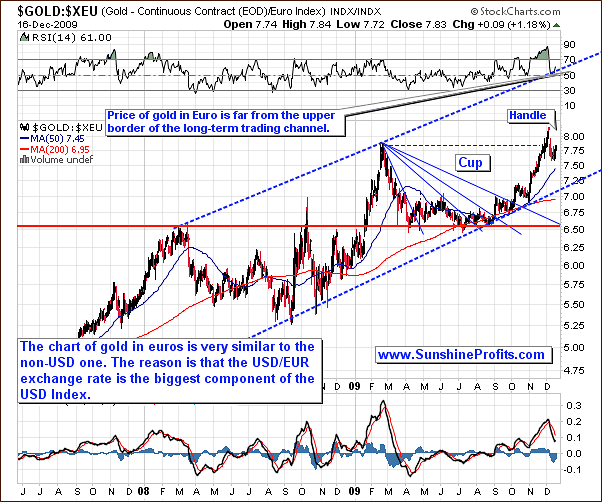
Things look similar from the European perspective - gold is in a long-term uptrend, and it has just failed to move above its previous high. The cup of the cup-and-handle pattern has been completed, and gold has not moved to the "handle" phase. Ratios are often more volatile than the underlying markets, and more difficult to analyze using technical analysis, but should the "handle" be completed without moving down significantly, the implications would be very bullish.
Gold in Yen
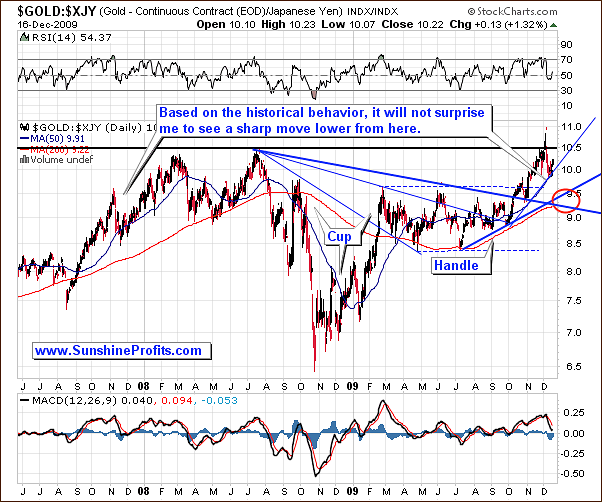
The price of gold in Yen rarely shapes in a similar way to its counterparts in other currencies. However, this is good news for us, since it allows me to analyze two different (technically speaking) charts and check for divergences / similarities. Consequently, it helps to estimate odds that a particular move will indeed take place or not.
This time, the above chart suggests that gold may need to go lower in the next several days / weeks before it is able to climb once again. In other words, gold is likely to hit the area marked with red ellipse and then make another (I'd estimate that the there is a 60-70% chance of breaking out to new highs during this attempt) shot to new highs. For now, the upper part of the ellipse (the rising blue support line) seems to be more probable to stop the decline.
Gold in British Pound
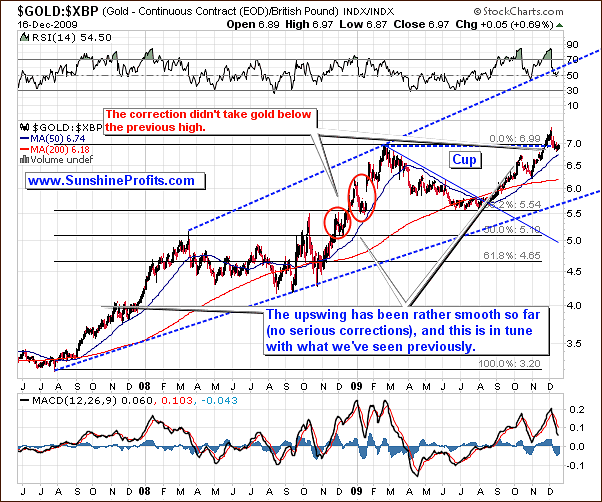
As far as price of gold in British Pound is concerned, we once again see the cup-and-handle pattern. This chart, however, contains one more interesting characteristic. Please note that at the end of 2008 and the beginning of 2009 price of gold corrected the breakout above the previous highs, but it didn't take gold below these levels. I have marked two price/time combinations, because it is difficult to say which of these levels (5.5 or 5) should be used as top.
The October 2008 top was very rapid, and was more of a sharp semi-random upswing than a gradual rise (which is much more likely to mark a beginning of a bigger move), so I would still prefer to use the lower area marked with red ellipse as an analogy to the recent events. The difference is that by extrapolating this area, we see that the rally is far from being over - at least from the long-term perspective. This could mean that the $1,500 area mentioned in the previous updates (and in the following part of this report) as one of the future targets is indeed likely to be reached, but most likely not immediately.
The support levels created by previous tops used to provide strong support, so the price of gold in British Pounds, may also stop declining sooner than it will be in other currencies.
Gold in Australian Dollar
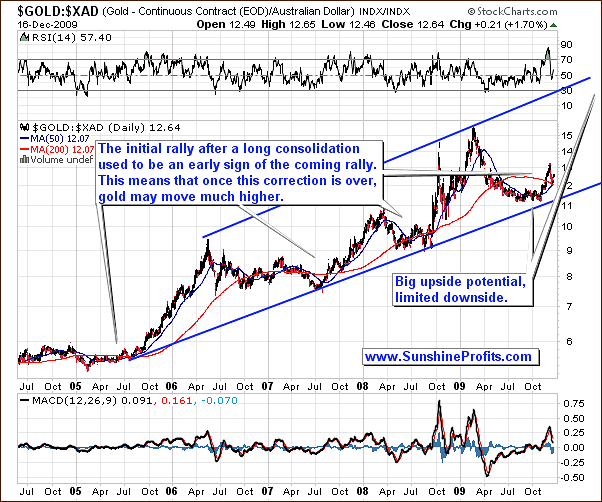
In one of the previous Premium Updates I wrote the following:
The bullish fact is that we have just seen the initial rally after the consolidation. In the past, this action suggested that a big move is coming, but it won't necessarily take place right away. This is in perfect tune with what I mentioned based on the analysis of other charts. Gold is likely to rally massively, but not immediately.
After posting the above essay, I've received a message from a Subscriber (Hi Brad), in which he mentioned that the new carry trade (caused by differentials in the interest rates in USD and AUD) would cause a rise in the value of the Australian Dollar, which will consequently make gold rise at the slower pace in this particular currency. An additional factor pointing to this outcome is the fact that AUD is also a commodity currency with huge resources, so it is supposed to be well supported with huge inflows.
These are very good points and are indeed factors positively influencing the value of the Australian Dollar, but it still doesn't mean that during the next move up, the price of gold in AUD would not rally sharply.
Please note that the fact that AUD is a commodity currency is not a new development. This fact is commonly known, and it is already discounted in the price, so the analysis of the long-term chart includes it. Moreover, the interest rates were low in the U.S. and relatively high in Australia at the end of 2008 and at the beginning of 2009, and gold in AUD still managed to ignite a strong rally. Therefore, we have one more conformation that the fundamentals are important and drive markets in the long run, but this is not necessarily an appropriate tool to time the market.
Gold in The non-USD Perspective
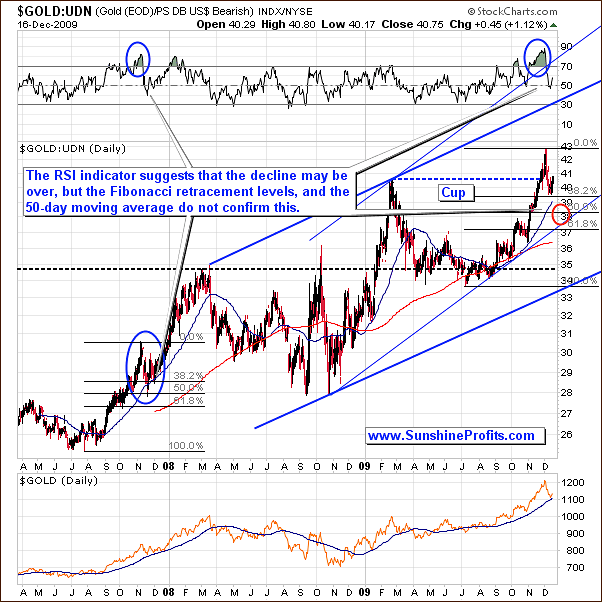
The final non-USD gold chart that I would like to feature this time is the gold: UDN ratio. UDN is the symbol for PowerShares DB US Dollar Index Bearish Fund, which moves in the exact opposite direction to the USD Index. Since the USD Index is a weighted average of dollar's currency exchange rates with world's most important currencies, the gold: UDN ratio means the value of gold priced in "other currencies".
From the average non-USD perspective, gold appears to be forming the "handle" of the cup-and-handle pattern. This is a bullish formation, meaning that the following move could take gold to new highs. The trend remains up, but the correction may not be over yet.
In 2007, gold had needed to correct 50% of the first stage of the substantial rally, before the move was resumed. It also moved below the 50-day moving average, which corresponded to the 38.2% Fibonacci retracement level. We have a very similar situation today - also confirmed by the Relative Strength Index. Consequently, gold may need to move lower - below the 38.2% Fibonacci retracement level, 50-day moving average, and stop at the blue rising trend line / 50% retracement level. I have marked the latter with the red ellipse.
Having covered the international situation on the gold market, let's move to the analysis of the yellow metal in U.S. Dollars.
Gold
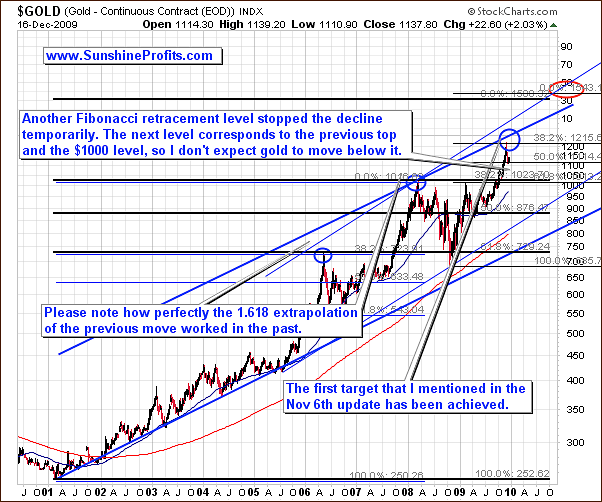
The very-long-term chart of gold reveals that the price at which gold was stopped temporarily was a 50% of the move that I believe is likely to take place in the future, and that will take gold to $1,500 or so. This fact alone is some kind of confirmation that this projection is likely to become reality.
The next serious support level is at $1,000, and I currently don't expect gold to move below this level. It is possible that gold would bottom earlier, but should that be the case, I will send a Market Alert.
Let's zoom in for more detailed view.
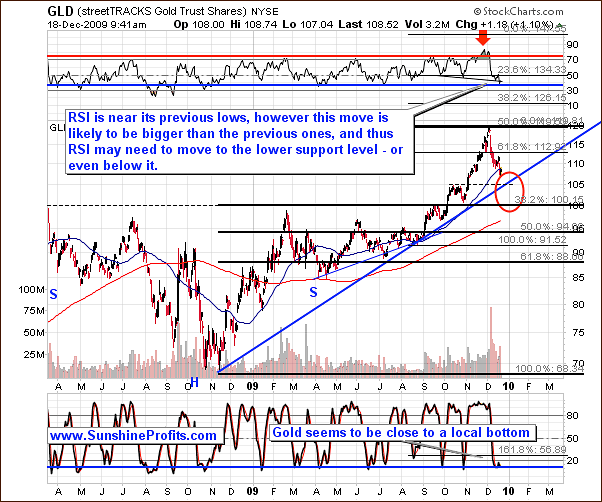
Taking a closer look results in one more support level that was previously rather invisible - the $105 level in the GLD ETF. This is the price that stopped the initial post-$1,000-breakout rally, and it currently corresponds also to the medium term support line. This may stop the decline for a while (and both indicators on the above chart: RSI and Stochastic confirm this), but will it be able to form a major bottom there? It depends to a large extent on the situation on other markets, but it currently doesn't appear to be the likely outcome.
The analysis of the short-term situation provides additional confirmations.
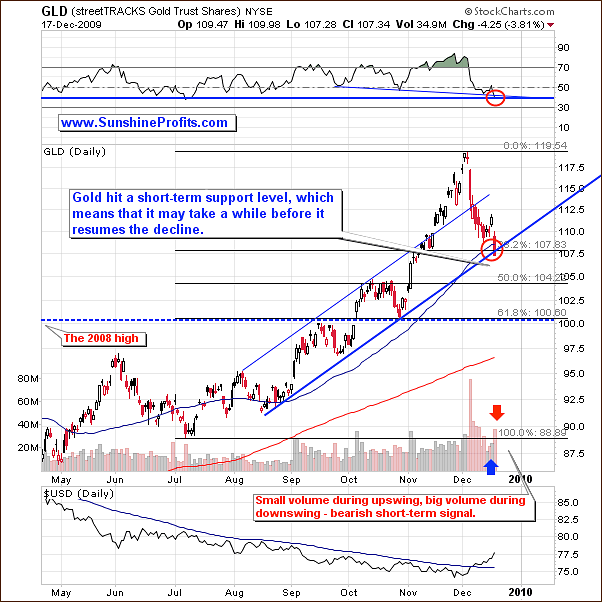
The price levels that were mentioned in the above part of this update are almost perfectly corresponding to the Fibonacci retracement levels on the short-term chart. The first (38.2%) level retracement level was just achieved, and the two following ones (50%, 61.8%) more or less correspond to the above mentioned $105 and $100 level.
This means that reaching any of them may cause the price to reverse, but it doesn't seem that it will be the first level that stops the plunge. Once of the reason that I'm skeptical about an immediate turnaround is the volume situation. Please note that the volume was low on Wednesday, when price of gold moved higher, and it was high yesterday, when gold declined. This is not a positive signal, and it suggests that the decline is not over yet. It is currently difficult to say if it will be $105 or $100 that would stop this plunge, but this should become clearer once we move closer to these levels.
Silver
Let's start the analysis of the silver market from the non-USD side, just like I did with gold this week.
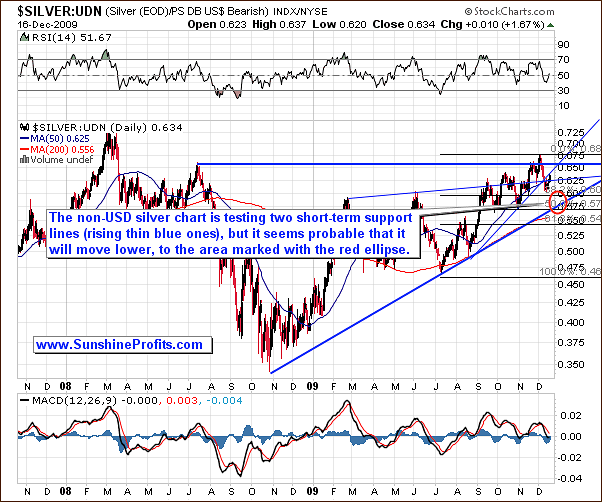
The value of silver moved above its July 2008 high at the beginning of December only to decline a few days later. For now, the decline is clearly visible also from the long-term perspective, but it doesn't necessarily mean that the bottom is in. Silver moved below the rising thin blue lines, and is now verifying them as resistance. Once this is completed, the white metal is likely to resume its decline, probably to the area marked with red-ellipse.
This area is created by applying the Fibonacci retracement levels to the July 2009 - December 2009 rally (38.2% and 50% levels are in the ellipse), and the rising medium-term trend line.
The analysis of silver from the USD perspective provides us with similar signals.
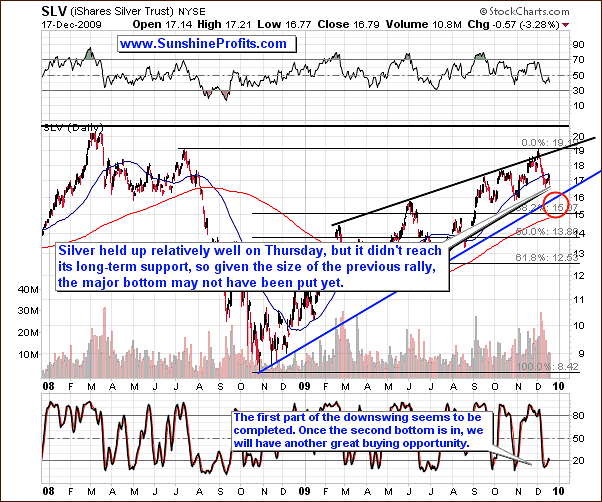
The white metal moved much higher at the beginning of this week, but this small rally (as mentioned in the previous Premium Update) was just a pause in a bigger decline. Consequently, it seems rational to expect silver's price to move even lower before forming a bottom. Based on the above chart, the most probable bottoming area is between $15 and $16 in the SLV ETF. These prices are based on the 38.2% Fibonacci retracement level, 200-day moving average, and the rising medium-term trend line.
Please note that the Stochastic indicator is already signaling the bottom may be in. However, based on its historical performance, it seems that we would need to see a double-bottom pattern in this indicator to say that the major buying opportunity is in fact in.
Let's take a look at the short-term chart for more details.
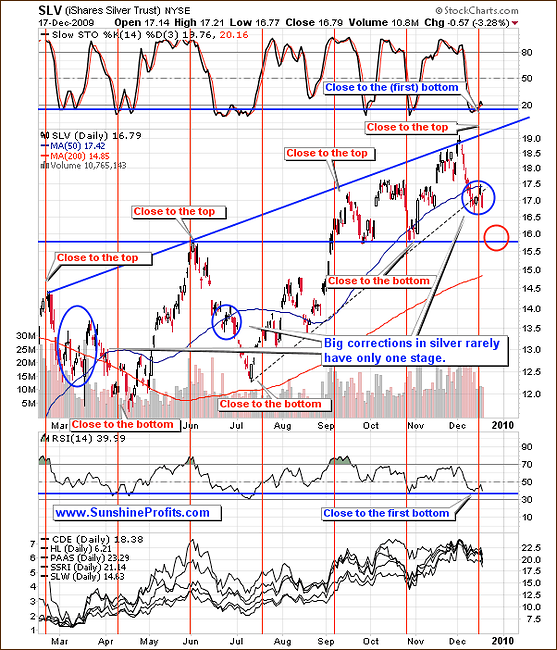
The short-term chart confirms the assumptions made above. The $15.7 level proved to be a strong support/resistance 3 times, so it may be able to stop the current rally. Again, this is based on the information/charts available today. Should the situation change significantly, I will send out a Market Alert.
Moving on to the precious metals stocks, let's begin with the long-term HUI Index chart.
Precious Metals Stocks
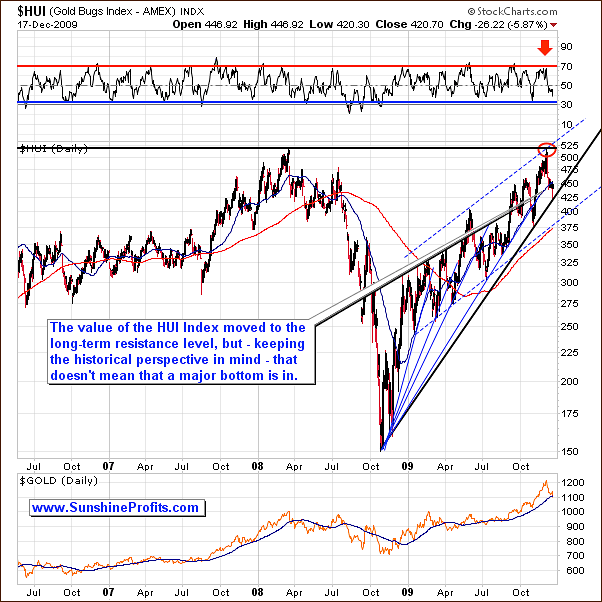
After looking at the above chart for the first time, one can come to the conclusion that gold stocks have bottomed, because they reached their medium-term rising support line drawn from the October 2008 low. However, once you take a closer look, the enthusiasm is likely to fade away, as similar support has never marked a major bottom.
Please take a look at the thin blue lines coming from the same price/time combination. Each of them was pierced, before the final bottom was put in, and this is what I expect to take place this time.
Let's take a look at the short-term chart for additional information.
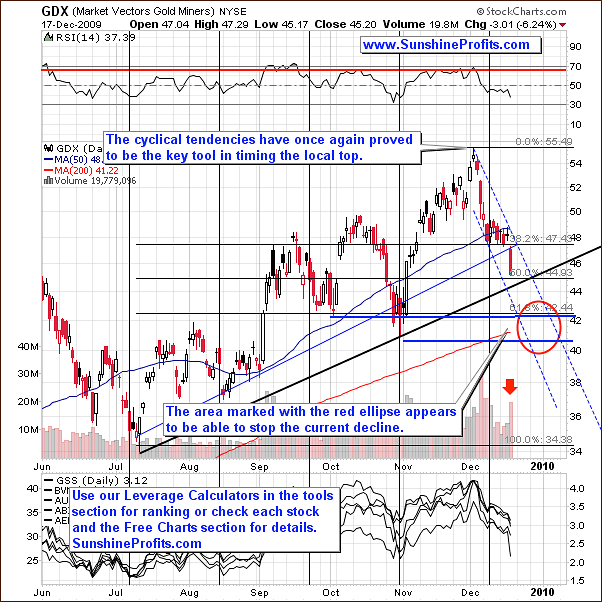
Based on the analysis of the short-term chart, the $40 - $42 area seems to be capable of stopping the current decline. These levels were bottoms in October, so they may prove to be a support once again. Both of these prices are in tune with the present shape of the decline (dashed trend channel). Moreover, the 42 level is very close to the 61.8% Fibonacci retracement level, and this technique of projecting crucial resistance/support levels has been working remarkably well on the precious metals market.
Moreover, please note that high volume characterized the last big decline has been big - signal that the decline was not over yet, especially when it was combined with relatively low volume on the previous day, when GDX rose.
Having covered the situation on the precious metals market, let's take a look at the markets that have the biggest impact on the short-term direction of the precious metal markets, namely the general stock market and the USD Index. Let's begin with the former.
General Stock Market
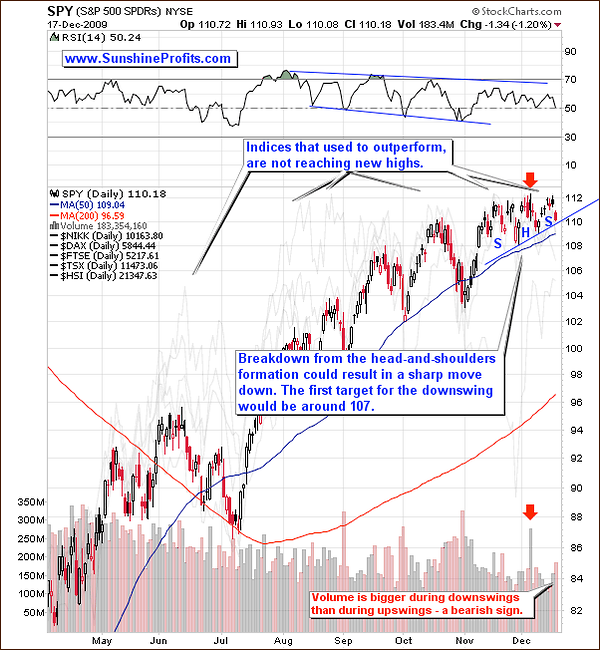
The previous bearish situation in the main stock indices did not change this week. We've seen the general stock market rally once again, but the upswing has once again failed to move above the previous highs, which is another bearish signal. Moreover, this created a head-and-shoulders pattern, which means that once we move below $110 in the SPY ETF, the following decline is likely to stop no sooner than at $107.
The bearish implications of this chart are strengthened by the corresponding volume - which is higher during downswings than during upswings.
Additional conformation comes from the analysis of the financial sector.
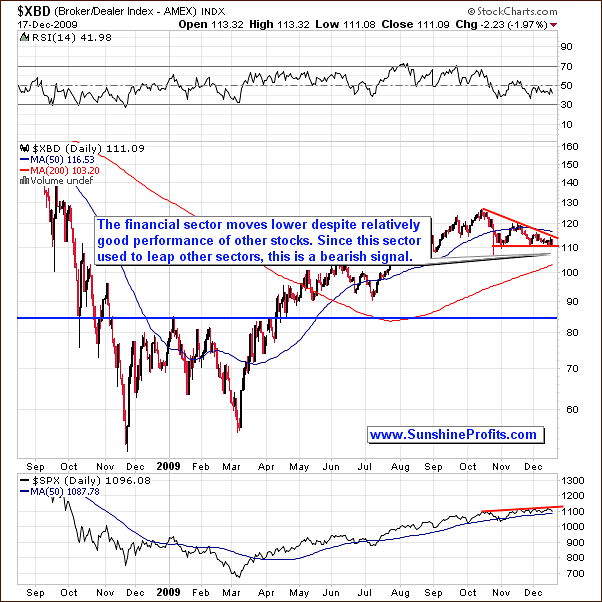
The situation on the Broker / Dealer Index creates a bearish divergence with the general stock market. The financial sector used to lead the whole market in the past, so the fact that each new top is lower than the previous one, signals that the whole market may plunge sooner rather than later. This is a negative factor for the PM market, because precious metals are still positively correlated with main stock indices. However, this may change in the future, and such change may mark the end of the current correction in PMs.
The other important market that influences the prices of gold, silver and corresponding equities, is the USD Index.
USD Index
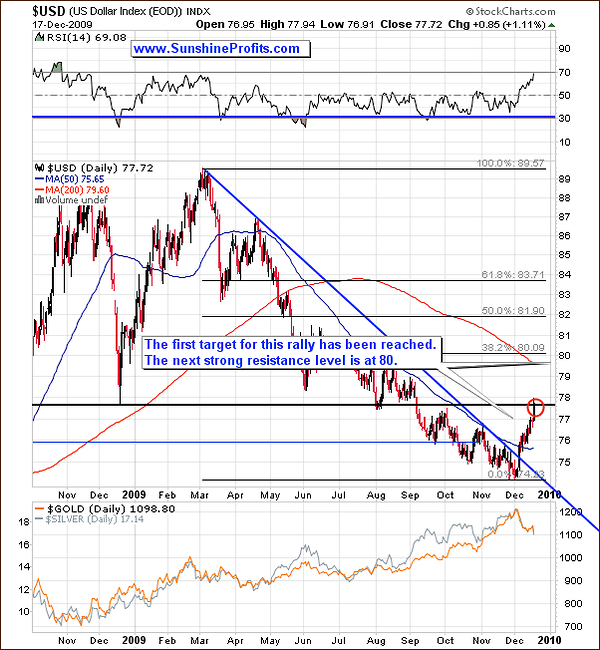
The USD Index has reached the initial target for this rally and paused. The next strong resistance level is currently at 80. This is the price level that provided very strong support for many years, and now has turned into heavy resistance. Additional factors increasing the strength of this are: the 200-day moving average (red line on the chart) and the fact that this level corresponds to the 38.2% Fibonacci retracement of the whole decline.
A rally to 80 would perfectly correspond to the second part of the downleg in PMs that I've mentioned in the earlier part of this update.
Before summarizing, let's check the short-term chart.
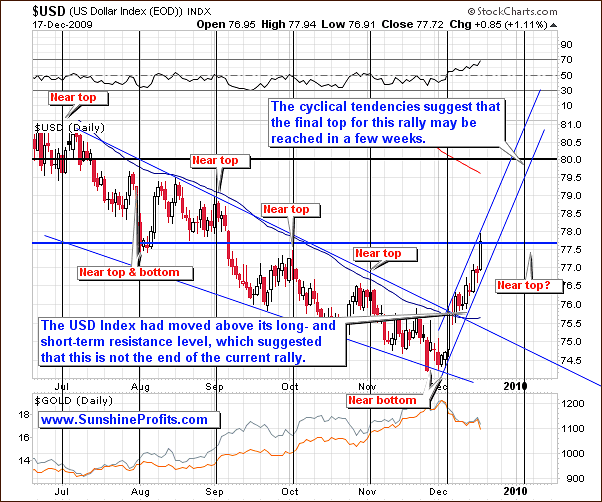
The short-term chart provides two additional details that were not visible on the long-term chart. The first one is the short-term trend channel, which suggests that the 80 level could be reached at the beginning of 2010. The second one are the cyclical tendencies, which marked tops/bottoms with relatively good precision. The next turning point is "scheduled" in the early part of January 2010, which confirms the above assumption.
Summary
Although gold is a quite popular topic in the media these days, the vast majority of investors are still out of the market. They talk about it - become increasingly more interested in the PM sector - but they are not convinced enough to buy silver and gold. This is why there is still much room to go for this bull market, and for you to multiply the profits that you have achieved so far.
From the short-term perspective, however, it seems that the correction is not over yet, and that its second part has just begun. This outcome has been indicated by several markets, so its reliability is rather high. Additionally, the analysis of the cyclical tendencies in the USD Index suggests that the top in the U.S. Dollar (and bottom in PMs) may take place at the beginning of January.
Naturally, I'm not advocating betting your every dollar on this outcome, as these tendencies work on a "near", not "exact" basis. However, based on the historical performance, it seems that a top in the USD Index / major bottom in the precious metals sector is a few weeks away.
Other Information
The next two Premium Updates will be posted earlier (on Wednesdays: 23rd, and 30th of December), because of the holidays following these dates and my travel schedule. Thank you for understanding.
This completes this week's Premium Update.
Thank you for using the Premium Service. Have a great weekend and a profitable week!
Sincerely,
Przemyslaw Radomski

