
Gold fell almost 5% last Friday to below $1,160 an ounce on the latest "positive" jobs data. Tuesday, gold futures fell for a third straight session as worries about credit problems in Greece and Dubai helped the U.S. dollar extend gains. This clearly is the beginning of the gold correction that I have been predicting for weeks.
Is there any reason to be worried about the long-term bullish trend for gold?
If you are not a regular reader of the China Youth Daily (in Chinese), it's possible that you may have missed the following item: http://www.chinamining.org/News/2009-11-30/1259561418d31756.html
The paper reported a high-ranking government official saying that China should increase the amount of gold it holds in reserves to reduce potential losses from a depreciating dollar.
We recommend China increase its gold reserves to 6,000 metric tons within three-to-five years and possibly to 10,000 tons in eight to 10 years," said the paper, citing Ji Xiaonan, chairman of the supervisory committee overseeing large state-owned enterprises under the State Council.
In previous Premium Updates we told you that China is undergoing major changes in the way it handles gold. Private gold ownership had been outlawed in China for generations until 2002, which is when the Shanghai Gold Exchange opened and began free trade in gold for the first time in the nation's history. Even more recently, China legalized gold investment by private citizens and even advertises its benefits in television infomercials. The Chinese government is telling its citizens that gold and silver are good investments that will safeguard their wealth. People in China are lining up outside of banks, post offices, and the new official mint stores to buy gold and silver.
Considering the high savings rate in China (mostly in the 30% - 40% area in the previous years), gold is a logical investment for the Chinese and it's possible that billions of dollars in Chinese private investment could move into gold in coming years. Already there is talk of China overtaking India as the world's largest consumer of gold.
It was only in April of this year that the world found out that China had increased its gold reserves by a whopping 76 percent to 1054 tons since 2003, moving from 10th place to 7th in terms of global central bank rankings. The Chinese government now owns 30 times the gold it held in 1990. And China is believed to be a leading candidate to buy some or all of the gold the International Monetary Fund still has to sell, after India bought the other 200 a few months ago.
Keep in mind that as China's reserves continue to grow, it will have to purchase gold just to maintain the small gold-to-reserves ratio of 2 % that it currently has, let alone increase it. Therefore, the country must continue buying gold.
Even with the increase in its gold holdings, as a percent of China's total reserves, (about 2%), gold is still a pittance, mere pocket change. Compare that with the international average of 10.2 percent held by central banks worldwide and you can understand why China is so eager to catch up. Last year China overtook South Africa as the world's leading producer of gold and apparently a good portion of this gold is finding its way into its central bank vault.
If the newspaper reports in the China Youth Daily are accurate then China plans to increase its gold holdings by another 5,000 tons of gold over the next three to five years. That's more than double the total annual global production. Keep in mind that the total annual global gold production is only about 2,500 tons per year, and obviously China cannot buy the whole lot. With current prices, buying 5,000 tons over the next three to five years would cost about $180 billion - still a small portion of China's dollar reserves.
This is just speculation, but let's consider what would happen to the gold price if China increased its gold reserves from 2% to just 5%.
At a bargain price of say, $1,000 gold, it would cost $55.3 billion to push China's gold holdings to 5% of reserves.
Chinese reserves are about $2.3 trillion, and of that, $1.6 trillion, or 70% are denominated in U.S. dollars. The cost to pushing its gold reserves to just 5%, which is still 5% lower than the global average, would be a pittance compared to the amount of money losing its value every day that China holds in its hands.
China's problem is that it can't buy all that gold without moving the market. I would expect China to buy on the dips, creating a solid floor for the yellow metal and eventually pushing the price of gold higher - much higher.
Consequently, the fundamental situation remains positive, which means that the bull market is still far from the ultimate top, but it doesn't have the decisive impact on the short-term price swings. In this case, to avoid brutal sell-offs (like the one that we are currently experiencing) one needs to carefully analyze the current situation i.a. by applying technical analysis. Let's begin with the very-long-term gold chart (charts courtesy of http://stockcharts.com.)
Gold
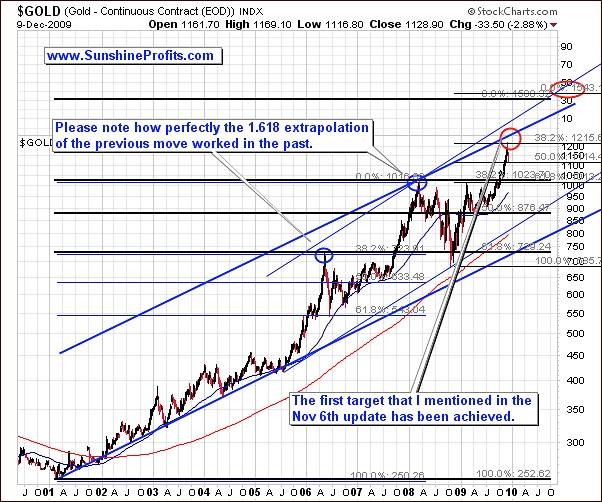
Taking a look at the big picture is usually useful before moving to the short-term analysis, as it helps to put the daily - often rapid - price swings into proper context and filter out the noise, leaving only the key moves. The chart featuring the price of gold since the beginning of the current bull market is certainly large enough to help us focus on what is important and what is merely a blip on the radar screen.
Gold has been moving up parabolically to the area marked with red ellipse (let me remind you that this chart was featured for the first time in the November 6th issue), and the spike top was typical for this type of upswing. Another thing that is much more clear on this chart than from the short-term point of view is that the current correction is barely visible - other suggesting that this correction is not likely to end today or tomorrow. If the next local top is to form around $1,500 and its several months away, then there's plenty of time for a correction and another wave up. I'm not saying here that gold and silver need to decline for a few months - I'm saying that it is unlikely that the correction will be just a few days long.
Let's zoom in for more detailed view.
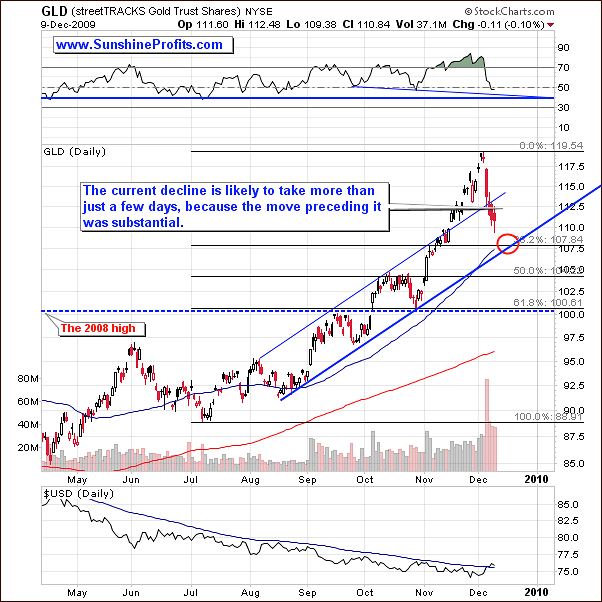
First thing that comes to mind after taking a look on the above chart is the size of the volume that accompanied the very recent sell-off. It is created by large amount of orders (mostly stop-loss orders) that are being filled when fear replaces greed after a substantial rally. Generally, the more rapid, and parabolic the upswing is, the more brutal the following correction. This goes double for the precious metal market, on which corrections tend to be sharp in almost all cases.
Even if you place a stop-loss order you may lose much more than you expected, if the price at which you placed your order is never "hit". For example, if you place your stop-loss order at $107 and price closes on Tuesday at $108 and opens at $105 on Wednesday, then your position will be closed either at $105 or - in some cases - will not be closed at all. It all depends on the system that you broker is using - if it doesn't take these situations into account and waits for the exact price (contrary to the "this price or lower" approach) to be hit in order to close the position, and you don't monitor your account on a daily basis then you might be in the market for much longer than you originally wanted.
This is why I believe it is usually a good idea to sell into strength, when signals are indicating that a correction is near.
Let me emphasize that I'm not saying that stop-loss orders are useless. I'm saying that they have their limits, which - accompanied by the very high volatility during corrections in PMs - means that the old-fashioned closing one's positions before / around the top still makes sense.
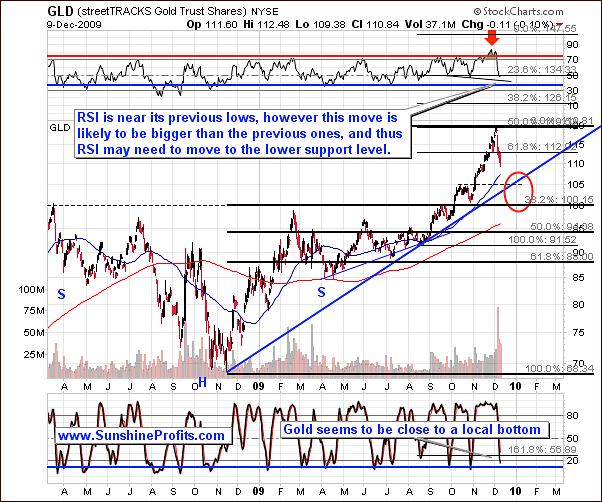
The above chart provides two targets for this downswing. The first one is visible directly on the chart (red ellipse), and the second one that can be inferred from the indicators. I realize that the red ellipse is relatively large, and does not provide one single price/time target, but we will have more details once we move lower and are able to examine the shape of the downswing. $105 in the GLD ETF seems to be capable of stopping this decline, as there are two support levels at this particular point, but even if gold is to test $1,000 once again, it would not invalidate the bullish implication of the chart.
The second target comes from the analysis of indicators. Stochastic and RSI indicators are not low enough to indicate that a major bottom is in (thick blue vertical lines), but they are at the levels that corresponded to local bottoms in the past so we might expect a small pullback from here.
The short-term chart confirms the above assumptions.
Please take a look at the June decline - the first part of the rally that took gold from $96 to $90 was visibly bigger than the second - July - part ($92.5 - $89), and it currently seems that we might expect a similar outcome also this time. The first part of the decline could take GLD to $108, while the second one might drop to $105, which means that gold would correct 50% of the previous move.
Silver
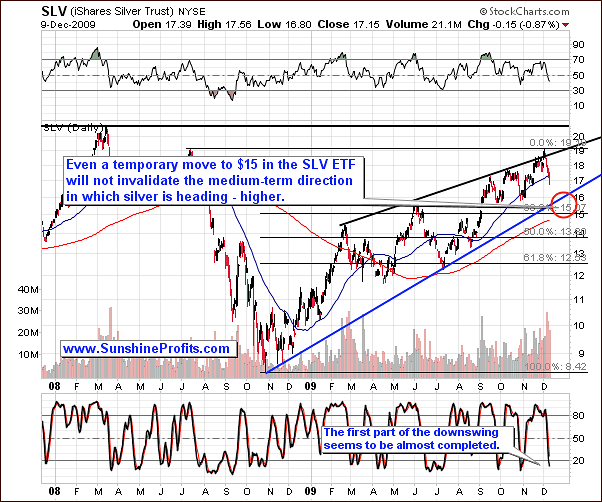
The situation on the silver market is similar to the one in gold as far as the overall implications are concerned. The decline has been sharp and took SLV from 19 to 17 in a relatively short time frame, but it did not reach a strong support level yet. The above long-term chart suggests that the next major bottom is likely to form between $15 and $16 - in the area marked with a red ellipse.
However, there are signs that there will be an intermediate bottom along the way, and this is much more visible on the short-term chart.
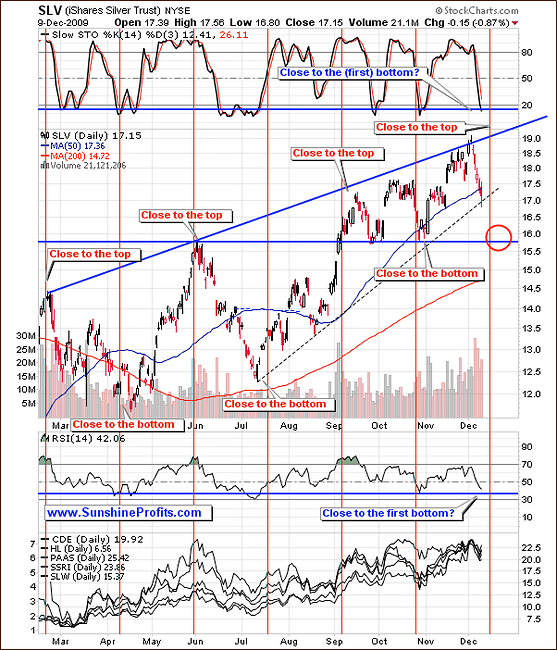
The correction to the $15-$16 area could correspond to the June top, and also to the two bottoms in September, which makes the support in this area even stronger. Still, the short-term dashed support line has not been broken, which may mean that silver will pause here for several days before declining again.
The similarity between current situation in gold and silver is even more visible when one takes a look at the RSI and Stochastic indicators. Both of them are just about to reach the blue horizontal line, which in the past meant that a local bottom is very close.
So, silver - just like gold - appears to be ending the first part of the current decline. Let's turn to PM stocks to see if we get a confirmation of these points.
Precious Metals Stocks
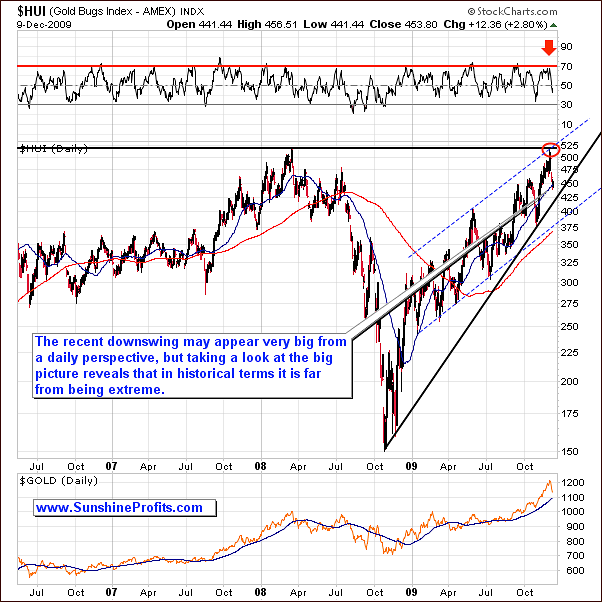
The long-term HUI chart reveals that the current correction is not that big, as one might expect it to be based on monitoring daily moves during this week. The value of the index has declined after it reached a very strong resistance level (as I suggested in the past updates), but it is still relatively far from a major support level.
This means that although HUI may appear oversold on a short-term basis, it doesn't seem that the bottom has been in just yet. After all, the history tends to repeat itself or at least it rhymes, and the previous corrections have been bigger than what we've seen so far - especially that the move preceding the top had been substantial.
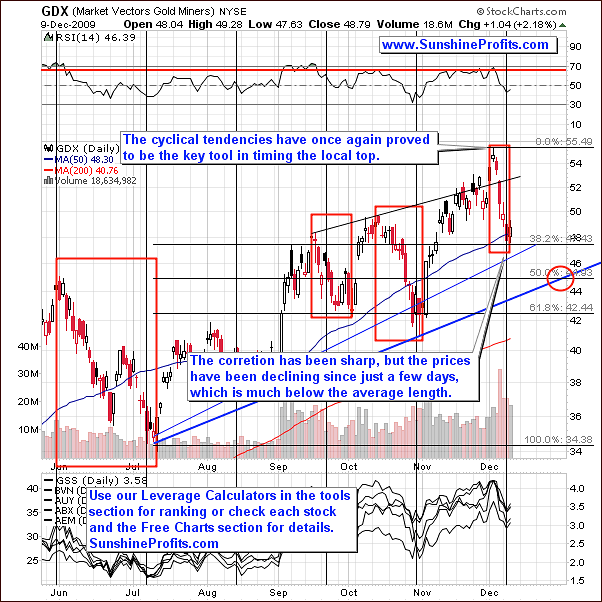
The short-term chart of another proxy for the PM sector - the GDX ETF - suggests that the intermediate bottom is very close. The price of GDX has corrected the 38.2% (Fibonacci retracement level) of the multi-month upswing, which also corresponds to the September top. Consequently, the strength of the current support is relatively strong - it seems that it may cause the current downswing to pause for several days.
Naturally, that is unless we get a very strong negative influence from one of the key drivers of PM stocks: main stocks indices and the USD Index.
The General Stock Market
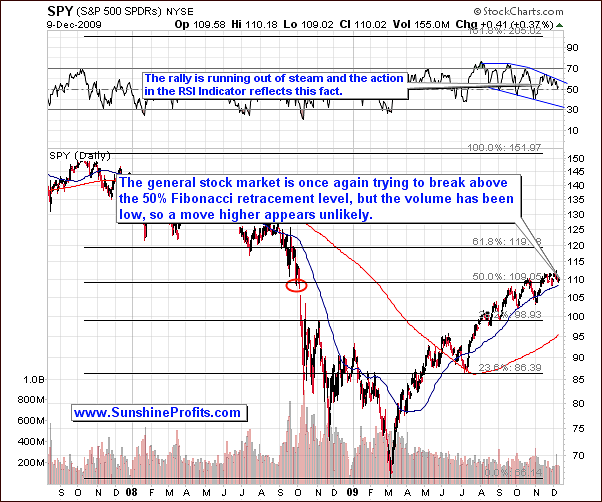
From the long-term point of view, the situation on the general stock market didn't change much since October. The SPY ETF (proxy for the general stock market) is trying to move above the 50% Fibonacci retracement level and the October 2008 price gap (strong resistance level), but each trial takes place on a lower volume, and the probability that this level will be breached soon is low.
Moreover, the RSI Indicator confirms that the rally has been running out of steam and it may be ready for a decline from this point.
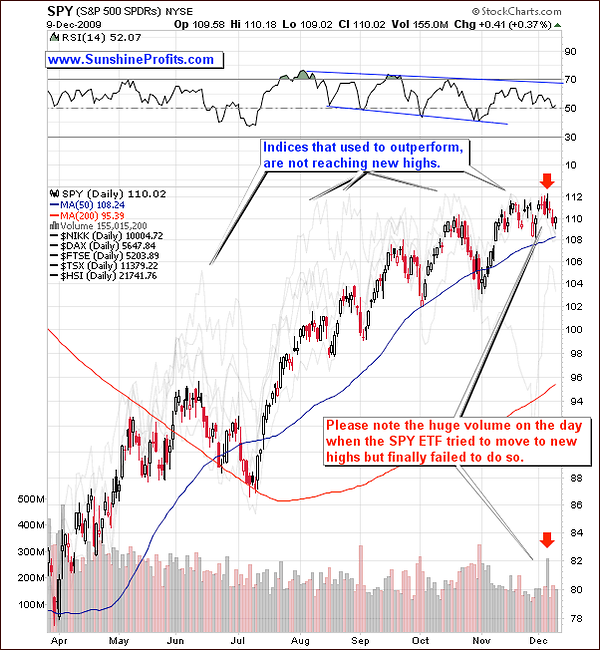
The short-term analysis of the situation in the main stock indices suggests that the top for this rally may be already a few days behind us. Please take a look at the high volume on Friday, when price tried to break to new highs but finally closed lower. The fact that it took place on a strong volume informs us about the strength of the resistance at this point - it appears that there are many sell orders at this particular price. Consequently, the top might have been reached on Friday.
Additional confirmation comes from the analysis of the performance of strong stocks. I will use the Apple Inc. as a proxy for the strong stocks.
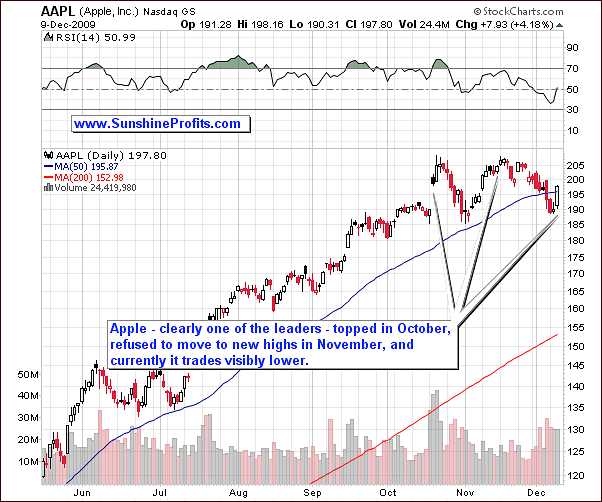
The strongest stocks appear to be lagging, which is a sign of the distribution phase. This is the period, in which professional buyers (institutional investors and savvy individuals) sell (distribute) their holdings into an overbought market
I wrote about this phenomenon in the last Update:
The point is that pros usually own the best stocks (also those from the main stock indices), enter the market early, and leave early. The general public often does the opposite - people pick lagging stocks (often with weak fundamentals) in hope that they will catch up, and do so near the end of the rally. This is why laggards often "outperform" during the final stage of a particular upswing. Consequently, best stocks are often first to top out, while the worst (given similar market capitalization of companies, because good, small companies also behave like weak, big ones) thrive near the end of a rally. The more evident this phenomenon is, the closer a particular market is to a top.
Therefore, the general stock market appears to be topping / to have already topped, which is likely to negatively influence prices of PMs in the near future, especially silver and PM stocks.
The other key driver of the PM prices - the U.S. Dollar - provides us with more details.
USD Index
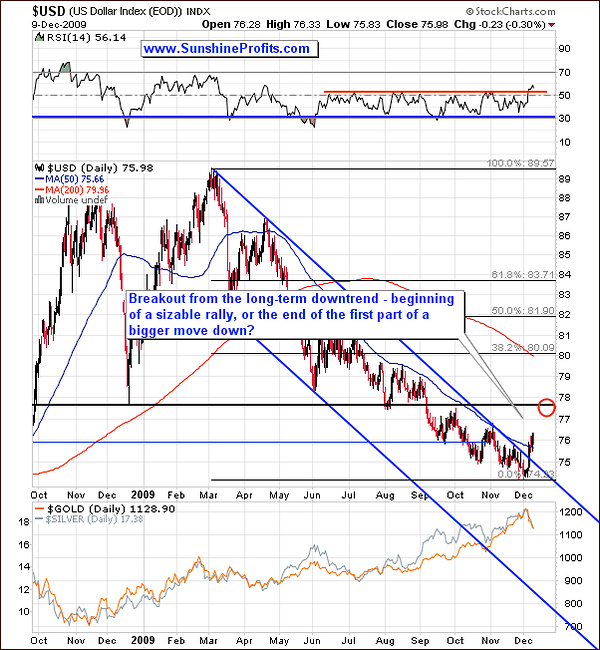
This week the value of the USD Index has moved above the declining multi-month trend channel and managed to close there for more than three consecutive trading days, and thus the breakout has been verified. We currently cannot rule out the possibility that there will be one more re-test of the upper border of the previous trading range, which would take USD Index to the 75 level.
Either way, the first serious resistance level that seems capable of stopping this rally is just below 78, which would imply that the half of the rally is already behind us. This would correspond to the point raised above - that the decline in PMs is not over yet, regardless of metals' performance in the next few days.
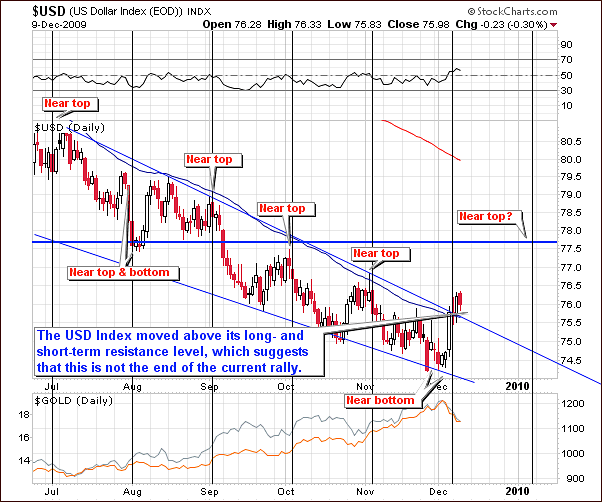
The short-term chart reveals that the USD Index moved up according to its cyclical tendencies. The next time that USD is likely to reach an extreme (most likely a top) is "scheduled" for the beginning of January. Consequently, the low values of PMs are quite possible in the following part of December.
Still, like I mentioned earlier - the correction does not have to be straight line down - the price is likely to take a breather at some point. There are several clues that this temporary turnaround is very close.
Gold Miners Bullish Percent Index
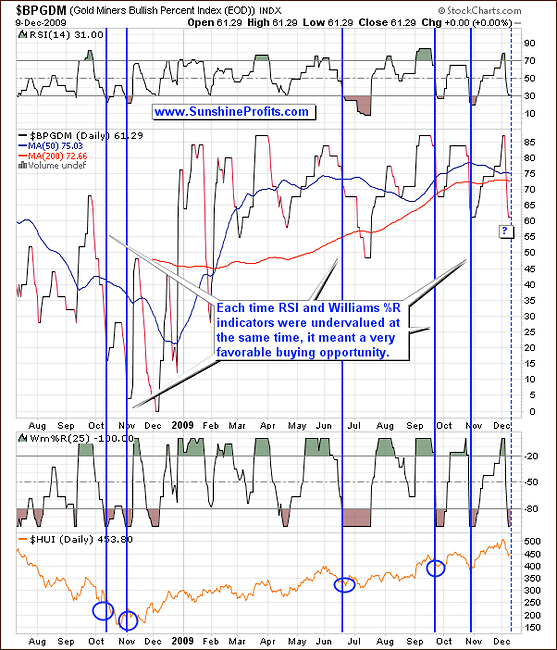
The Gold Miners Bullish Percent Index is very useful tool in timing the local tops, but we can also use it to time the favorable entry points. I used the phrase "entry points" instead of "bottoms" because these signals are often early, and not necessarily mean the final bottom.
The "buy" signal is given, when both indicators used on the chart (William's %R and Relative Strength Index) are in the oversold territory. The RSI is not yet below the 30 level, but is very close to moving below it, so we may see a temporary bottom within the next few days.
The confirmation of the above points comes from our own indicators in the Premium Charts section (you may go to this section, and click on the chart to enlarge it) - we have just seen two buy signals.
Indicators
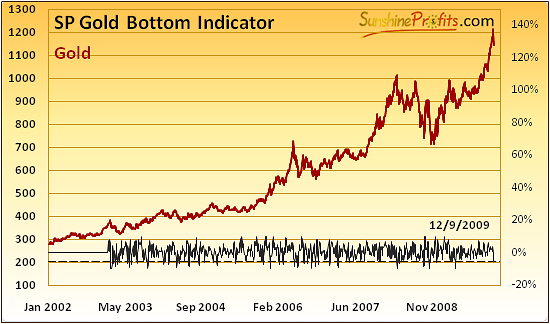
The first signal is a long-term one and it has been flashed for gold. The last time we have seen this signal was at the April bottom - the price did not move below it since that time, and it seems that it may not do so in the foreseeable future, and thus this signal should not be ignored. Still, this signal does not invalidate the points raised earlier - from the long term point of view this is not a bad entry point, because one would not be buying at the top.
The second signal came from the SP Short Term Gold Stock Bottom Indicator, which - according to its name - focuses on providing short-term entry points for PM stocks.
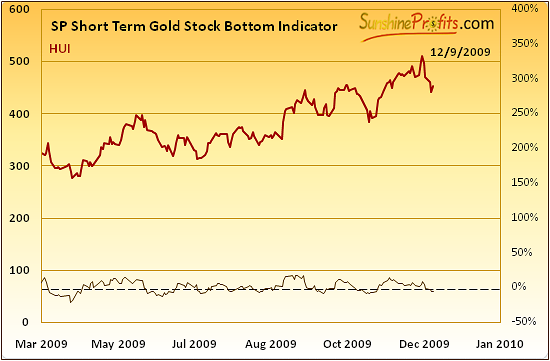
The buy signal is given, when indicator moves below the dashed line and starts to rise. This was the case recently, so we might expect a small rally in the next few days. Still, this indicator is often early in providing the entry points, so the rally may not begin today / tomorrow.
Summary
Precious metals have been correcting this week, which I believe did not catch you by surprise - in the Nov 27th Market Alert I wrote that staying out of the market for the next several days/weeks (speculative capital) seems justified, and I've repeated it in the Nov 30th Market Alert when I wrote that the top is likely to be reached regardless of the Dubai debt problems (Consequently, I believe it is justified to exit one's speculative positions in the precious metals market). Several days later PM prices plunged. Since Nov 27th, GLD moved from 115 to 110 and GDX declined from 51 to 48, which means that you would have saved about 4.5% in GLD and 6% in GDX so far, if you exited your positions in these ETFS on the Nov 27th. Consequently, if the capital that you trade (gold and PM stocks) amounts to at least $12,000, then the savings are already bigger than the yearly cost of the Premium Service. Naturally, if you waited a day or two, these amounts are even bigger.
Either way, it seems that we are in the early part of the decline, which unfortunately means that much is still unclear about the way the situation is going to develop from here. Many clues suggest that this decline is about 50% over, but I will not be able to make detailed extrapolations of the first part of the decline, until we are certain that it has been indeed completed. The fact is that we are not at the top, so if you are risk averse (and the risk in PMs is to be out of the market) and long-term oriented then you may want to get back on the long side of the market right away.
The detailed analysis of long- and short-term charts suggests that the precious metals sector might pause for several days before resuming the decline. Should the coming upswing take place on a low volume, then it would serve as a confirmation that the major bottom for this decline is not in yet. This outcome seems probable right now, especially given the rallying USD Index, and the general stock market, which appears to have topped a few days ago.
This completes this week's Premium Update.
Thank you for using the Premium Service. Have a great weekend and a profitable week!
Sincerely,
Przemyslaw Radomski

