
I'm in London this week and the city is vibrant. Rubbing elbows in Piccadilly Circus with the crowds rushing to catch the latest West End show, you hardly feel that there is a global economic crisis. Londoners seemed to have shrugged off the Dubai crises, as did the rest of the world. They seem to be happily unaware, or else they are ignoring, the fact that Britain's government debt is on the rise and is expected to be more than 80 percent of the nation's economic output next year.
It does make you wonder.
Dubai went from boomtown to doomtown in very short order. This one-time desert wonderland with palm-shaped islands, extravagant architecture and indoor ski slope, is now strapped to pay its bills.
Is this an isolated event or is it an omen of more debt bombs waiting to explode? Will governments, gorged on debts, be able to shoulder their obligations?
The New York Times reported this week that bills for an "unprecedented borrowing binge" by nations around the globe are starting to fall due. "The numbers are startling," said the New York Times. Germany's debt outstanding is expected to increase to the equivalent of 77 percent of the nation's economic output next year. Ireland and Baltic countries are in even worse shape, with Ireland's public debt expected to soar to 83 percent of gross domestic product next year.
Governments have taken on increasingly short-term debt, which will be coming due soon. They plan to "roll over" the loans extending the debt as long as there are creditors willing to buy short term paper. In the U.S., for example, treasury bills maturing within one year have risen from around 33 percent of total debt two years ago, to around 44 percent this year, according to the New York Times.
Within the next year, the U.S. Treasury will have to refinance $2 trillion in short-term debt. If you add deficit spending to that, estimated at $1.5 trillion, and pretty soon you're talking about a whole bunch of money.
Most economists don't believe that in the near future we will see nations defaulting on their government debts. They say that it's likely that rich nations and the International Monetary Fund would intervene with a bailout.
What does a country need to do in order to insure that it does not go bankrupt?
There is what economists call The Allan Greenspan and Pablo Guidotti rule, named for the former chairman of the Federal Reserve and former Argentinean deputy minister of finance. The rule, presented in 1999 in a G-33 seminar and in a speech at the World Bank, states that a country should maintain enough hard currency reserves equal to 100 percent of it s short-term (one year) foreign debt. In other words, countries should have enough reserves to resist a massive withdrawal of short-term foreign capital from their shores.
So how does America stack up? Does it have enough hard currency to back up a year's worth of foreign debt?
The U.S. is the world's largest holder of gold with 8,133.5 metric tones. At today's prices that is a little over $300 billion. That's not enough. If you throw in America's petroleum reserves and its foreign currency holdings, that still won't cover $2 trillions worth of debt that will mature in the next 12 months. Who will want to buy U.S. Treasury paper? India has already voted in favor of gold when it bought 200 tons of IMF gold last month.
Does that mean the U.S. will go bankrupt?
That's hard to believe. Don't forget that the U.S. government has its own printing press and it can always print new dollars.
All these economic travails can mean only one thing for gold. It's heading up. We saw Tuesday that gold broke above $1,200. In fact, gold ended the month of November with one of the biggest gains in 10 years.
And anyway, human nature would say, this time it will be different.
In fact, "This Time Is Different: Eight Centuries of Financial Folly" is the name of a book by economists Carmen M. Reinhart (University of Maryland) and Kenneth S. Rogoff (Harvard University) who examine the financial crises of the past 800 years. They identify the singular cause of great economic contractions.
"The essence of the this-time-is-different syndrome is simple," Profs. Reinhart and Rogoff say in the introduction to their book. "It is rooted in the firmly held belief that financial crises are things that happen to other people in other countries at other times. The old rules of evaluation no longer apply. We are doing things better. We are smarter. We have learned from past mistakes. Unfortunately, a highly leveraged economy can unwittingly be sitting with its back at the edge of a financial cliff for many years before chance or circumstance provokes a crisis of confidence that pushes it off."
These plunges happen all the time and, in erratic rotation, around the world, say the authors. It's no wonder, then, that investors' confidence in debt is fickle.
Can governments prevent economic meltdowns? Profs. Reinhart and Rogoff say it's really not all that difficult, provided that governments are "sufficiently frugal," run budget surpluses, and avoid issuing bonds with shorter than 10-year maturities. (Do we know of any countries like that?)
Professor Rogoff was interviewed for The New York Times article I mentioned earlier. He said he expects a wave of defaults by weaker economies about two years from now. The stronger countries will be too busy with their own economic problems at home and will probably not be willing to bail them out.
Meanwhile, governments everywhere are plunging even further into debt. Maybe everyone thinks that this time it will be different.
In any case, we will be glad, and even lucky, that we got into gold when we did.
Before I proceed with commenting on this week's price action in metals and other markets relevant from PM Investor's point of view, I would like to mention one top-confirmation signal that I got this week. It came in the form of a message from a Reader, who writes "you're wrong!!!" e-mails to me whenever we are near a top (thus doing us a favor) - so far this was a very reliable signal.
Moving on to the technical side of the market, let's begin with looking at the "forest" (investment environment; key market drivers), and then I will move to the "trees" (gold, silver, PM stocks). Let's start with the USD Index.
USD Index
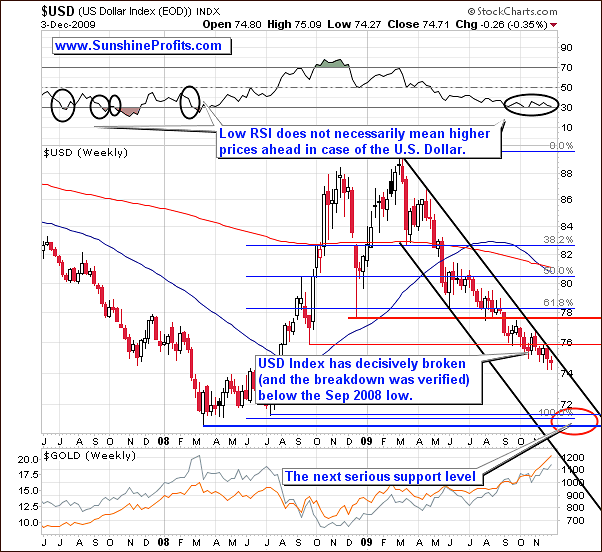
The situation on the long-term USD chart is still positive for gold and silver. The U.S. Dollar is near the top of the trading channel, and the target for the next downswing is visibly below the current levels. Naturally, it may move sideways for some time before plunging, and it seems that this would correspond to a correction in the metals. More short-term view on the same chart confirms this assumption.
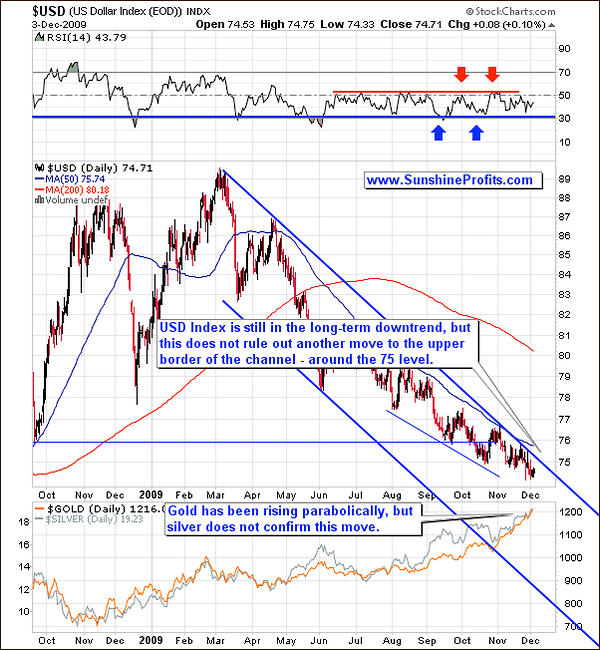
While the Dollar Index is relatively near the upper border of the trend channel, it can still move higher in the near term - the resistance level is just above 75. Moreover, the slope of the whole trend channel is low, when one takes the short-term picture into account, meaning that it will take another month or so for the resistance line move to where price is today. In other words, if the USD Index simply trades sideways, it will not invalidate the current trend. This creates "room" for a move lower in PMs.
The short-term picture provides us with additional details.
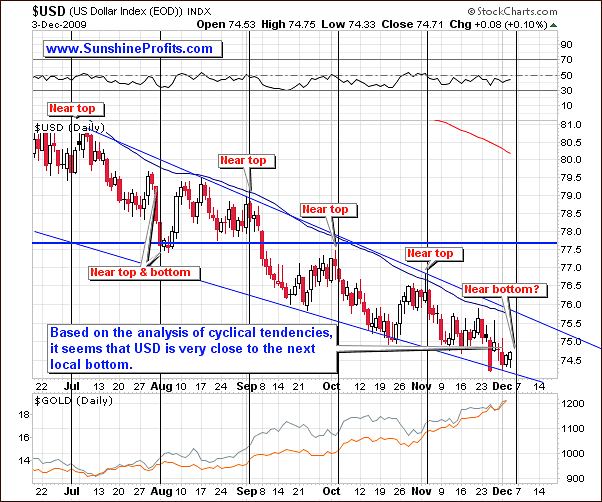
The short-term chart of the USD Index points to another resistance line as a target for the next rally - currently close to the 75.5 level. This is higher value than what I mentioned earlier, when I analyzed the long-term chart, but it does not mean that the short-term level is completely useless. Both levels could be reached in the following way: USD rises to 75.5, but fails to verify the breakout above the 75 level, and moves below it after a few days.
Combining the above with the cyclical tendencies (marked on the chart with black vertical lines) creates a high probability for a rally in a few days / next week that would take the USD to about 75.5. This could trigger the decline in PMs - especially with the huge amount of speculative capital in the market right now.
Conducting an analysis of the US dollar is essential, when trying to time PMs, but this time it seems that the big signal may also come from the general stock market.
The General Stock Market
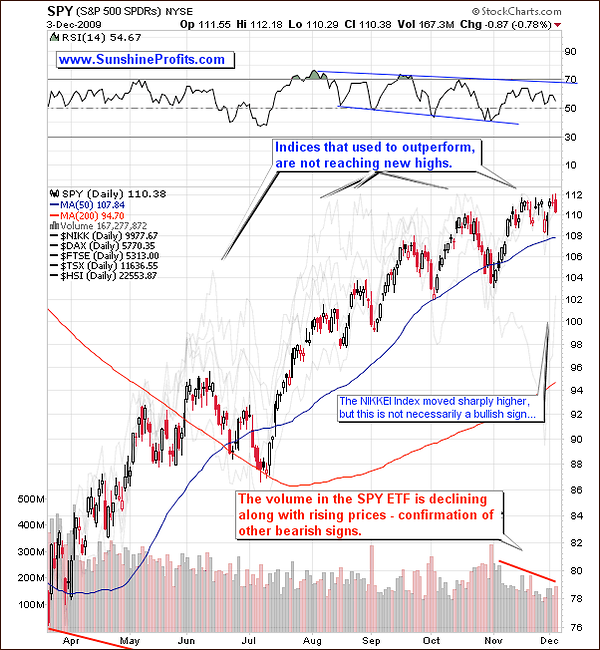
The main stock indices are mostly trading near their 2009 highs, but the way the stocks have been rising this year suggests that that the rally is running out of steam and volume confirms this. This is nothing new, as I've already mentioned this in many previous essays. However, what I did not mention yet, and what is also visible on the above chart, is that the way best/worst performing indices are behaving right now.
Assuming that the performance of the S&P 500 is average, we can speak of NIKKEI as the worst performing index, and other indices featured on the above chart as outperformers. Generally, markets have fractal nature, meaning that they are self-similar. The pattern that is visible on a daily chart may be visible also on a monthly chart, and often research done on one group of assets becomes useful on a totally different occasion, given that some similarities are preserved. This time, the relative performance of indices can be analyzed very similarly to the performance of individual stocks. I have already written about the specifics of this analysis while describing details of calculations behind one of our unique indicators, so I will just focus on the current implications without explaining the same thing all over again.
The point is that pros usually own the best stocks (also those from the main stock indices), enter the market early, and leave early. The general public often does the opposite - people pick lagging stocks (often with weak fundamentals) in hope that they will catch up, and do so near the end of the rally. This is why laggards often "outperform" during the final stage of a particular upswing. Consequently, best stocks are often first to top out, while the worst (given similar market capitalization of companies, because good, small companies also behave like weak, big ones) thrive near the end of a rally. The more evident this phenomenon is, the closer a particular market is to a top.
Now, keeping the abovementioned points in mind, please take one more look at the chart of the main stock indices. The strong indices failed to move to new highs - they are acting weak, while the laggard - NIKKEI - has just rallied. Consequently, we have another confirmation of the bearish situation on the general stock market. Before asking "so why are the prices not moving down right now?", please note that this is a long-term top that we are talking about here, not a short-term one, so it takes a considerable amount of time for the top to be formed.
The implication of the above analysis for the precious metals market is bearish in the short term, and rather neutral in the long run - I expect PMs to be much higher in a few years regardless of where the general stock market goes. This is one of the reasons why I prefer to own gold and silver instead of shorting stocks - the probability of PMs moving higher is greater than the chance that general stock market will plunge (in nominal terms).
Moving on to the metals, let's begin with gold.
Gold
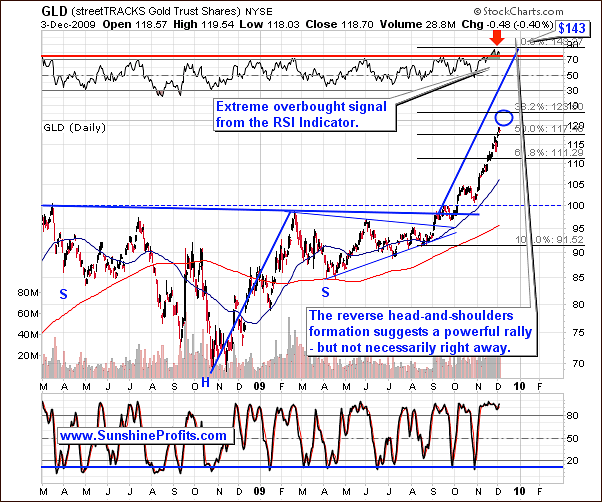
There is no doubt that gold has been moving up parabolically in the past month, which attracted a substantial amount of speculative capital. Momentum players are very likely to throw in the towel and close their positions once they see a smallest sign of weakness in the market, or even more likely, their stop-loss orders will do it for them. Consequently, the sell-off can really be a very sharp one, which means that if one has still open speculative long position, they need to monitor markets virtually at all times, to place their sell orders on time. Generally, this is why I prefer to sell into strength.
The situation in gold is very tense, and the top may be reached any day now, possibly next week. Naturally, we can't rule out that today's $20 downswing is a beginning of the bigger move.
Silver
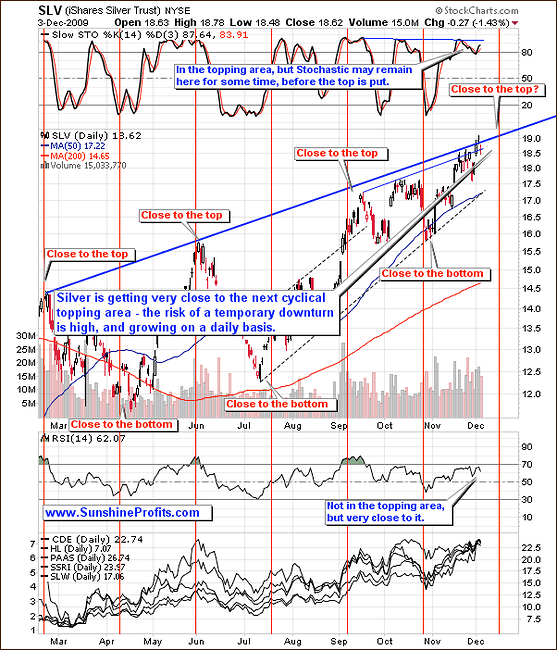
The chart of silver is much clearer than the one featuring gold, as there has lately been no parabolic upswing in the white metal. Instead, we see that silver is getting very close to the next cyclical topping area (marked with red vertical lines). This, accompanied by the fact that silver is very reluctant to move above the thick blue resistance line creates a very high probability that silver will not move above its March 2008 high before the correction, and possibly not even above the July 2008 high.
Precious Metals Stocks
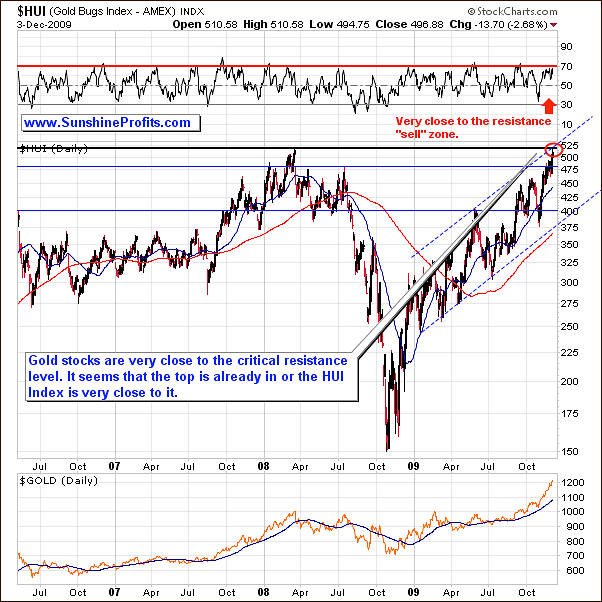
The precious metals stocks have been moving higher very rapidly in the past weeks, but they are now reaching a super-strong resistance level - their 2008 high. The strength of the resistance level is even bigger because the HUI Index is also reaching the upper border of the trading channel, and the RSI indicator is very close to the "sell" zone.
Based on the historical performance, technical analysis, and my own experience, it is likely that this rally will be stopped at least very temporarily, before gold- and silver stocks are ready to move significantly higher. Let's take a look at the short-term chart for more details.
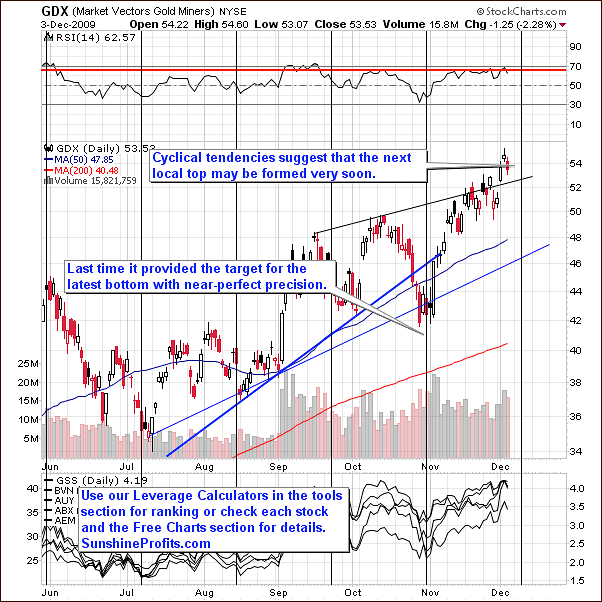
The useful detail that was not visible on the long-term chart of the precious metals stocks is the cyclical tendency that I've marked with black vertical lines. They are less precise here than it is the case with silver, but I believe they still create additional value for us.
The next topping area is "scheduled" on the early part of December, which means that the top is likely just around the corner or it has been reached on Tuesday. Based on today's price action the latter seems quite possible, but that is not certain yet.
More clues come from the analysis of two important ratios. The first one is the GDX:SPY ratio, which features the way PM stocks have been outperforming the general stocks market.
Precious Metals Stocks' Performance Relative to Other Stocks
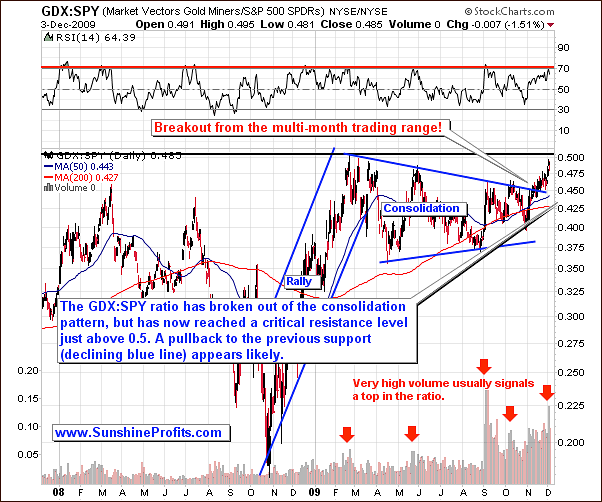
The ratio has finally broken out of the consolidation pattern, but has now reached a critical resistance level just above 0.5. Therefore, we might expect some kind of consolidation. Since the breakout has been verified in a rather insignificant way, the ratio may once again move to the 0.45 level before heading north once again.
The analysis of volume confirms this. In the past the GDX:SPY ratio topped on a relatively high volume, and this is also what we have just seen. Moreover, the RSI indicator is at the level that marked a top in the past, so the odds of a sell-off from here are even higher.
The top in the above ratio is very likely to correspond to top in the PM stocks, and also to the top in the metals. Speaking of ratios, let's take a look at the most popular one (from the PM Investor's point of view) - the silver-to-gold ratio.
Silver to Gold Ratio
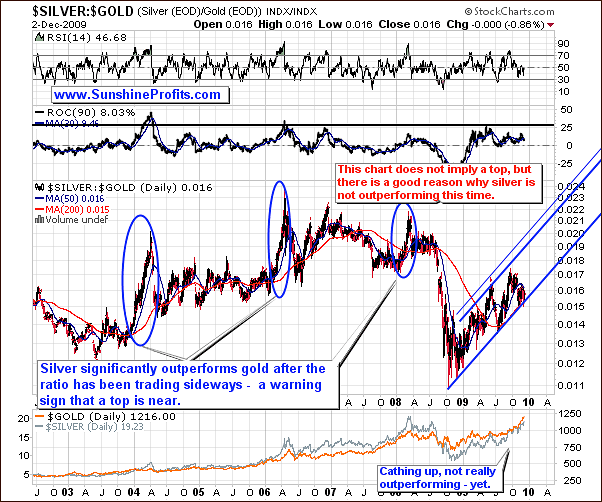
This ratio could normally make one worried if one is currently out of the PM market, as silver tends to outperform gold near major tops, and this wasn't the case lately. Still, I don't think that is currently a huge concern, as the lack of excitement in silver may be to a great extent explained by the situation on the general stock market. After all, silver has many industrial uses, which makes it more correlated to the main stock indices than it is the case with gold. Please take a look at the following table for details:
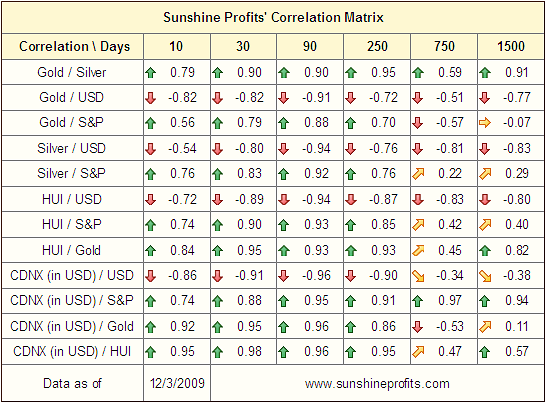
The values of correlation coefficients with the S&P 500 Index are higher for silver than they are for gold no matter which of the above time frames (columns) you take a look at. Although these numbers are not high in the long- and very-long-term (750- and 1500-trading-day columns), they are above 0, which is not the case with gold. Consequently, the bearish implications of the current situation regarding the general stock market are more negative to silver than they are to gold. This means that the weakness in the silver-to-gold ratio is rather to be expected in the short run, and the fact that it does not soar right now does not make the coming top unlikely.
The final confirmation that the local top is very close comes from the analysis of the Gold Miners Bullish Percent Index (the relative amount of the gold stocks on the buy signal according to point and figure charts to all gold stocks taken into account).
Gold Miners Percent Bullish Index
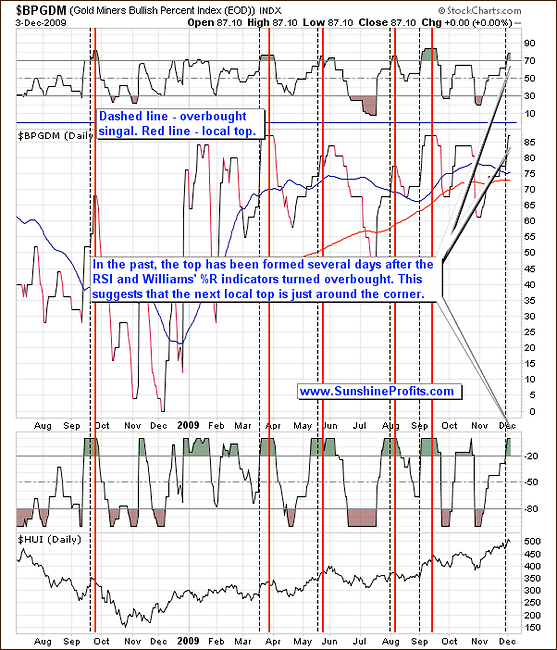
The high-probability sell signal is given if this index moves higher, and both indicators (RSI and William's %R) used on the above chart become, and then stay overvalued for some time. The initial overbought signal is marked with the vertical dashed black lines, and the top signal is marked with red lines. The overbought signal was given several days ago, so the probability that the top is already in, is relatively high.
Juniors
As stated in the Key Principles section, the list of top juniors will be updated approximately every 4 weeks, so this is the Update that should contain the revised version of the list.
The tables below feature our favorite junior stocks at the moment of writing these words. For more information on how you can use these lists please refer to the Key Principles section, especially to the part dedicated to juniors.
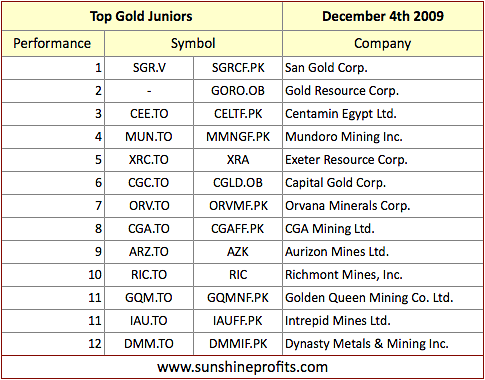
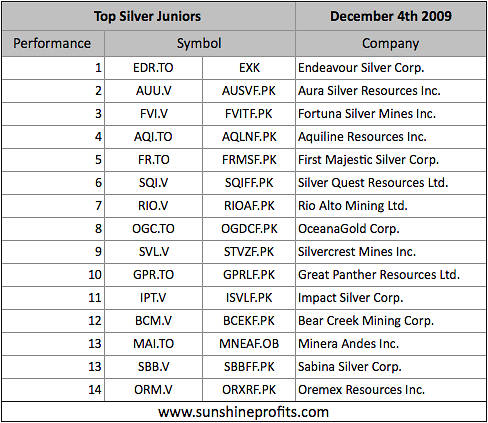
Once again, there are not many changes this month, and almost all companies featured last month are still in our top lists, meaning that if you purchased these companies a month ago, you still own stocks with the best (in my opinion, of course) profit potential.
However, there is one company that I would like to comment on in more detail. Mundoro Mining (MUN.TO) was on the last place on our list last month but it has rallied very significantly in the past weeks, so I believe you might be wondering if you should sell this stock or buy more.
I usually don't conduct a technical analysis on the junior mining companies, because of their small capitalization, which makes them very vulnerable to short-term manipulation, however signals coming from the chart of MUN.TO are so strong that I believe it would be useful to make an exception this time.
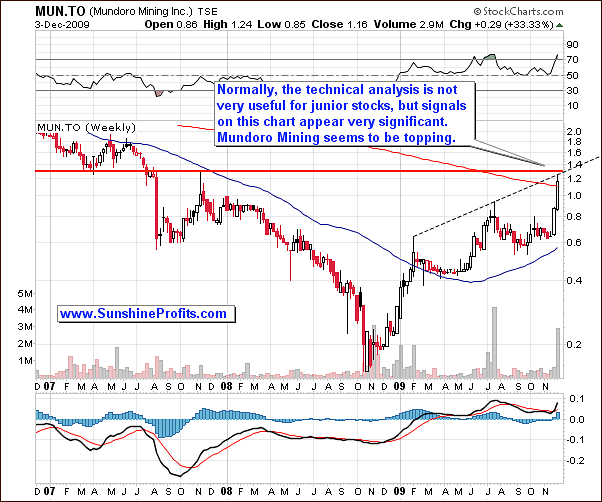
MUN.TO is currently reaching a critical resistance level at 1.3 CAD, which has been created by combining two very important resistance levels - the rising medium-term line, and the horizontal line that has already stopped a rally in MUN.TO in 2007. Consequently, it seems that rebalancing your long-term junior portfolio now would be a good idea. By that I mean selling a part of your MUN.TO holdings and use the proceeds to purchase other stocks from the list.
Other Information
This week I received enormous amount of messages, and I regret that it's impossible to reply to each of them. Most of them contained the "is the top in?" or "how low will gold go?" questions, so I would like to take this opportunity to provide you with the answer. Based on today's price action it seems that the top may (!) be in, but that is not certain yet. I believe that it is profitable to be currently out of the PM market with one's speculative capital (or even short it, but it is generally not recommended), but it is not certain that the top is in today, and consequently I can't provide you with targets for the coming decline just yet. I will do so - in the form of a Market Alert, or Premium Update - once I am certain that the top has been reached.
In other news, the next Premium Update will be posted on Thursday, December 10th, a day earlier than the regular schedule.
Summary
The fundamental outlook remains positive for the precious metals market, and consequently, their prices are likely to rise on the long run. However, there are many factors pointing to a correction in the short term. The gold market is currently very hard to analyze because of the parabolic shape of the rise, but virtually all other markets suggest that a correction is either possible, or even very likely.
The exception is the price of silver, which normally outperforms gold during major tops, and that hasn't been the case this time. Still, at least a part of explanation comes from the general stock market, which is positively correlated with the silver market, also in the long term. Consequently, the top may (have been) be reached even without silver's outperformance. This outcome is confirmed by the GDX:SPY ratio, Gold Miners Bullish Percent Index, USD Index, and the main stock indices.
This completes this week's Premium Update.
Thank you for using the Premium Service. Have a great weekend and a profitable week!
Sincerely,
Przemyslaw Radomski

