
In a world of paper currencies and paper promises I can think of ten reasons right off the top of my head why the price of gold will continue to go up in the long term. While it may feel like a bubble to some, I believe we are just warming up.
Last week I mentioned a few of such reasons, but I would like to expand this topic this week. Below I have featured ten of the many points that currently point to higher value of the gold price in the long run.
1. The smart money has already piled into gold. Some of the world's savviest money managers have taken large positions in gold. I mentioned John Paulson, David Einhorn, Paul Tudor Jones and Jim Rogers I forgot to mention George Soros, who increased his holding in gold in the third quarter with gold mining stocks and with the SPDR Gold Trust ETF. This week the Wall Street Journal reported that John Paulson, who I did mention last week, is launching a new gold fund, which will include $250 million of his own personal funds.
Other well-known fund managers publicly piling into gold include Bill Gross, Kyle Bass (Hayman Capital), Paolo Pellegrini (PSQR), John Burbank (Passport Capital), Evy Hambro (Blackrock), Donald Coxe (Coxe Advisors), and David Tice (Prudent Bear Fund). I would expect other major mutual funds, hedge funds and pension funds to follow their lead.
2. Central banks are net buyers of gold for the first time in 22 years. This is a major secular change. According to a report by precious-metals research firm GFMS, for the first time since 1987, central banks around the world bought more gold in the second quarter than they sold. India recently bought 200 tons of gold from the IMF and China is expected to purchase the other 200 tons offered for sale.
3. In June there was an item in Bloomberg about Northwestern Mutual Life Insurance Co., the third-largest U.S. life insurer, having bought gold for the first time in the company's 152-year history. According to the report, the insurance company has accumulated about $400 million in gold. I would expect that other insurance companies might follow suit.
4. As long as interest rates remain at zero, the carry trade in the US dollar will continue to flush liquidity into the markets and into gold. Since that involves shorting the dollar, the dollar will continue to slump, further fortifying gold. I expect the US dollar to remain the carry trade currency of choice in the near term for many investors. A currency carry trade is an investment strategy in which an investor sells a currency with a relatively low interest rate and uses the funds to purchase a different currency or assets either yielding a higher interest rate one in which he believes will go up in value. Fiat currencies, such as the dollar and the Euro, are being deliberately devalued by governments as a way to get out from under the massive debt burdens that were run up during the "credit bubble" and later by the "stimulus" plans. The US wants and needs a weaker dollar and low interest rates. I believe that fiat currencies will continue to be aggressively devalued over the next decade. Long-term readers of Sunshine Profits know that gold moves inversely to the dollar. The U.S. dollar index, a six-currency yardstick of the greenback's value, has dropped 7.1% so far this year, while gold is up 34% year-to-date. In short, for every 1% drop in the dollar index, gold has risen 4.7%.
5. China holds $2 Trillion in Foreign Currency reserves and only 2% in gold, vs. a 10% worldwide average. The Chinese are seeing the value of their foreign currency reserves turning to dust every day. If China makes the logical move to increase its gold reserves and reduce its fiat currency exposure to even just the worldwide average, gold prices could move substantially higher.
6. Gold is scarce. The gold industry has not replaced gold reserves mined in over a decade meaning near term shortages. We might get to a situation where there is simply not enough physical gold available to cover the massive quantities of gold that has been pledged. This situation could push the price of gold to the stratosphere. Hong Kong has recently pulled all its gold holdings and deposits from London and brought them home. While investors chase gold to get into something more stable than the dollar, producers aren't keeping up. Gold production was down 3% last year, and it was flat in the most recent quarter. Although mining companies are spending more on new production, especially in China and Russia, that is not enough to offset dwindling output from mature mines. Central banks hold a lot of gold. But they are not interested to sell and in any case, they are bound by an agreement that imposes limits on sales.
7. It is estimated that throughout history only about 160,000 tons of gold have ever been mined. At today's prices that equates to about $4.9 trillion dollars. Compare that number to the $60 trillion in outstanding fiat currency.
8. Sovereign wealth funds, China, Qatar, and Saudi Arabia, have begun to invest heavily in commodities to diversify out of Fiat Currency.
9. Traditional Gold hedgers, the gold producers and miners, are eliminating their hedge positions. In the past, gold producers have sold gold for delivery at some point in the future, to offset the risk that prices may decline between now and then. But not anymore. As gold supplies dry up, producers are no longer locking in prices by selling massive quantities of futures contracts. This takes selling pressure off and indicates the producers themselves believe prices will be going much higher.
10. The last reason for gold to go up is one I mentioned last week. It's clear to me that the real fireworks will start when Main Street catches gold fever. The gold market is small. The market cap of all the gold stocks in the world is less than that of Microsoft or Walmart. So when the public finally rushes into gold... Well, that's when we'll be very glad that we got in early.
However, the road to the top will not be a straight line, and since that is the case it makes sense to take advantage of the inevitable corrections. Let's examine the chart (charts courtesy of http://stockcharts.com) of gold to check if we are close to another buying or selling opportunity.
Gold
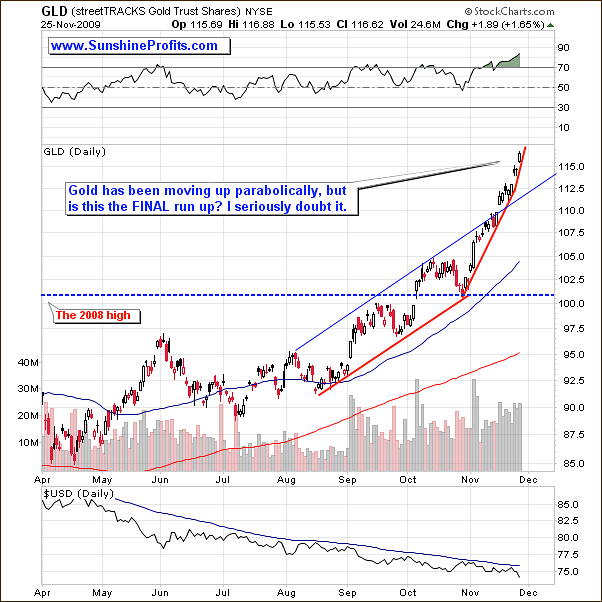
Once gold broke out of its resistance line, gold moved much higher (as suggested several days ago) and it has been moving in a parabolic fashion. This type of upswing is usually very profitable for those holding the metal, but confusing for those trying to time the top. This time is no different, as the short-term chart doesn't provide us with any reliable targets for this rally. However, the long-term chart is much more informative.
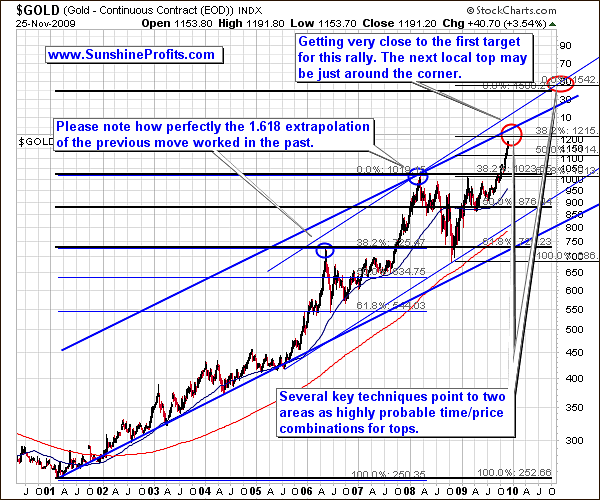
The long-term chart (covered deeply in the November 6th Premium Update) suggests that the top is just around the corner, as the price of gold reaches the target area marked with the red ellipse. The rally has been steep, so it is vulnerable to a sell-off caused by momentum-players closing their positions. The $1,200 level has not been breached yet, so it may rally just a few more days/weeks before finally declining.
Generally, I realize that I'm not the only one calling - a soon to be - top, so... It makes the top less likely to be reached immediately. Naturally, I respect my colleagues and their work, but after all analysts are also emotional human beings. The point here is that the top is likely to be reached, when everyone is bullish on a given asset (for how long has everyone and their brother been bearish on the general stock market and meanwhile it still keeps rising?), not bearish. So, if analysts are bearish, then it more or less means that a lot of investors reading their analyses are also bearish. And since that is the case, it means that there are many investors waiting on the sidelines to buy gold. Of course, this is not a decisive signal, but it means that the overnight downswing may not be the beginning of the plunge yet. Still, the move higher from here is not likely to be very big until we see more significant correction.
However, if you are still long gold/silver/PM stocks with your speculative capital (I don't mean the long-term investments that you want to hold for at least a year), it may make sense to exit your positions now. As mentioned above, there is a chance that the PM sector would get higher on a short-term basis, but the overnight weakness in metals (especially compared to the relatively small move in the USD Index) is a strong bearish signal, so staying out of the market for the next several days/weeks (speculative capital) seems justified. There is an old saying that goes "when in doubt, stay out", and the amount of bearish signals certainly makes me doubt if we get much (!) higher in the short-term.
Before summarizing the situation in gold, I would like to comment on its price in various currencies, especially that in the past few weeks many new Subscribers from all over the world have joined us (welcome aboard!). I have successfully conducted a similar analysis in the October 16th Premium Update, but the situation has changed since that time, so I believe that you will find the following update useful. I will begin with featuring the price of gold in the non-USD perspective in general, and then go through the price of the yellow metal in world's key currencies (components of the USD Index).
I will use the gold:UDN ratio as a proxy for the non-USD price of gold. UDN is the symbol for PowerShares DB US Dollar Index Bearish Fund, which moves in the exact opposite direction to the USD Index. Since the USD Index is a weighted average of dollar's currency exchange rates with world's most important currencies, the gold: UDN ratio means the value of gold priced in "other currencies".
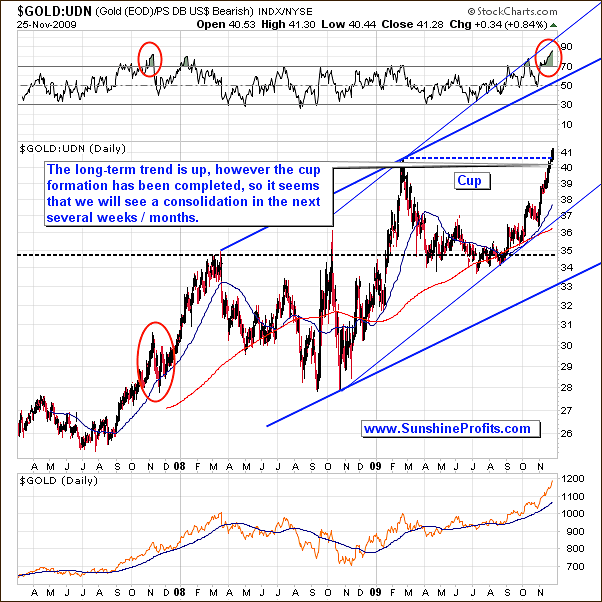
The striking fact is that although performance of gold is often perceived as weak in currencies other than the U.S. Dollar, it has just moved above its previous highs! The breakout is not very visible, as it moved just a little above the dashed resistance level, but the fact is that on average, gold's excellent performance is visible also in many other currencies. The breakout has not been confirmed, and I doubt that gold will manage to make a strong move up from where it is today based on its recent performance, without at least a small correction. This correction would create the "handle" in the cup-and-handle pattern. Once completed, it could mean a substantial rally, however it seems that we are at least several weeks from that point.
Please take a look at the areas marked with red ellipses. About 2 years ago, the gold:UDN ratio has also moved too far too quickly, but it didn't mark the end of the rally. A correction followed, but in the end it turned out that it was the middle of a bigger move, not the end of one. This may be the case also today, especially given the fact that the performance of the RSI Indicator is very similar to what we've seen recently.
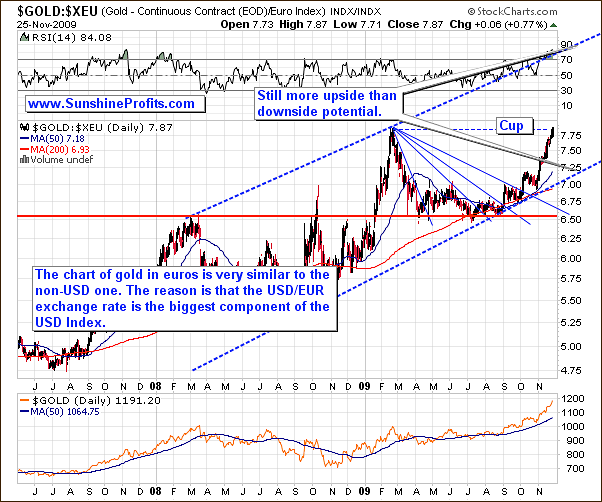
Two above charts are very similar and it is not without a reason. Since the biggest component of the USD Index is the USD/EUR exchange rate, the USD Index trades in a similar fashion to the USD/EUR exchange rate. Consequently UDN fund trades in the opposite direction to this currency rate, which causes the gold: UDN (non-USD gold) to trade in a very similar way to gold priced in Euros.
Since that is the case, the points made while commenting on the previous chart apply also to this chart. In short - it's bullish for gold in the long run, while suggesting a breather in the short-term.
The second biggest component of the USD Index is dollar's exchange rate with yen, so let's take a look at price of gold in this currency.
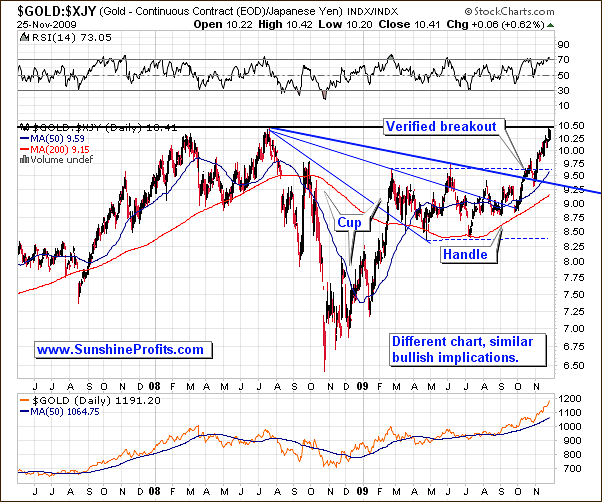
The performance of gold in Yen isn't very similar to what I featured on the previous charts, but it doesn't mean that the implications of this chart are different. In fact, this is why I prefer to take a look at the precious metals market from many different perspectives. If I come to the same conclusion after analyzing many charts, then the reliability of this analysis is much higher than if it was based on just one single market - for instance that was the case over a month ago.
The cup-and-handle pattern is already behind us from the Yen perspective, and gold has just reached its old highs. The implications are very similar to what I've just mentioned above - the rally has been steep and strong resistance has been reached, so a correction is likely.
Still, the above chart is bullish from the long-term perspective. The price of a given asset is likely to move higher by the same amount percentagewise after it breaks out of a horizontal trading range, as it did before it entered this consolidation. In this case, gold in Yen has been it has been trading sideways from March to November, and the move preceding the formation took the ratio about 30% higher. This suggests a move about 30% higher after the breakout from the trading range, so a move to 12.5 in the gold:Yen ratio is likely in the long term. It seems that this could be the target for the rally once the old high is taken out.
The third biggest component of the USD Index is the pound.
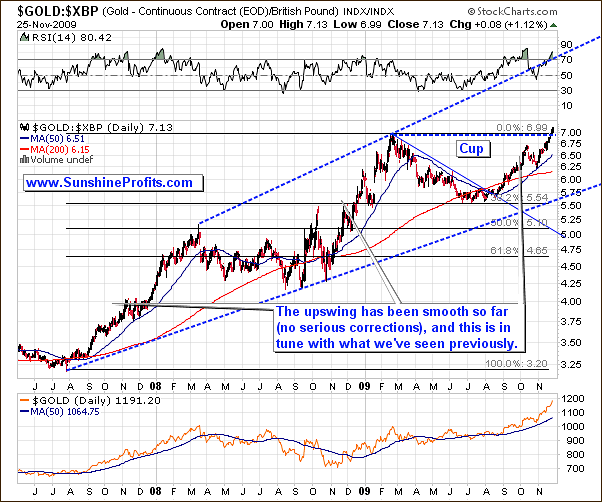
The overall implications of the analysis of gold in Pounds are similar to what I've written earlier, but the shape of the bull market is different from the non-USD point of view. As you may see on the above chart, the previous rallies were not really volatile, so this is what I expect also this time. Please note that the correction that took place two years ago has been very calm relative to what we've seen in the gold:UDN ratio. Consequently, if gold corrects significantly, the correction may not be as volatile in Pounds, as it will be in other currencies.
Moving on to the Canadian Dollar, we see another beautiful rising trend channel with the perfectly shaped "cup".
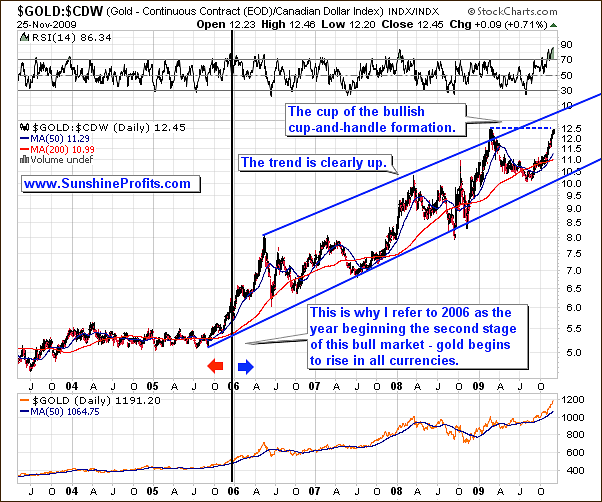
Gold in Canadian Dollars is also moving higher, but has now reached its previous high and is likely to consolidate before moving higher. However, please note that the trend is very clear and consequently Investors holding gold for the long run don't need to worry about the healthiness of the bull market in this particular currency.
By the way, please note that the bull market in the Canadian Dollar was barely visible until the beginning of 2006. This is one of the reasons that we use data from the 2006-today time frame in several of our tools.
One more currency that I would like to feature this week is the Australian Dollar.
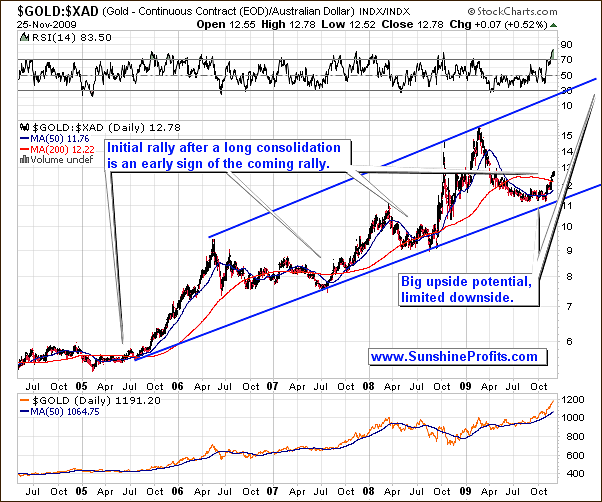
There are no big changes in the price of gold from the Australian perspective since I wrote about it over a month ago. The situation in gold priced in AUD is still similar to the one in gold priced in GBP as far as volatility is concerned. The trend is clearly up, however in case of the Australian Dollar, the price of gold has even more upside potential, as it is still far from the upper border of the trend channel.
In the previous update I wrote that the following:
The current consolidation is stable, even to the point that it seems that the price of gold in AUD has been going nowhere in the past several months, but putting things into perspective sheds light of encouragement. The analysis of the previous consolidations and subsequent rallies reveals that once gold in AUD finally moves, the move can be really rapid, thus more than making up for previous apathy. For details please consider the action that took place a year ago, when gold soared very quickly.
The bullish fact is that we have just seen the initial rally after the consolidation. In the past, this action suggested that a big move is coming, but it won't necessarily take place right away. This is in perfect tune with what I mentioned based on the analysis of other charts. Gold is likely to rally massively, but not immediately.
Summing up, today's price action was quite volatile, but it was too small and much too quick to correct the recent huge rally. In other words, I doubt that we would go to $1,500 from here without a serious correction.
Having covered the situation in gold, let's turn to silver and check what is the white metal likely to do next.
Silver
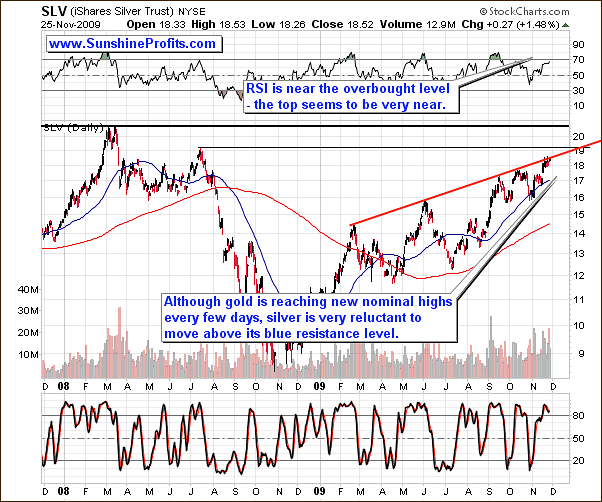
The white metal has more than doubled in the past year, and it is finally very close to its 2008 highs. However, before these resistance levels are reached, silver much first breach through the rising red line that has proven strong resistance many times in the past. The Stochastic Indicator is currently above the 80 level, which means that a top might be put here (it is a necessary condition, but not a sufficient one). The RSI is not in "extreme overbought" territory yet, but it is now very close to it.
While it may make sense for super-aggressive speculators to wait for the final signal, from my point of view it seems that most Investors would be better off closing their positions a little earlier. The sell-offs in silver are usually very volatile and take the metal much lower in a short time frame, so unless you can monitor the market almost constantly and sell during the early part of the plunge (its hard to get your orders filled during that time). Let's take a look at silver from the short-term perspective to see if we it confirms the above analysis.
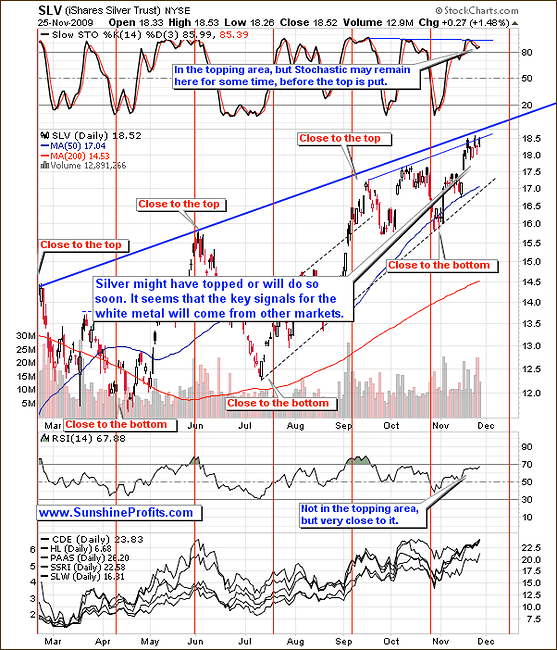
The short-term silver chart confirms the points raised above. Apart from the fact that silver is now near the short-term resistance level (thin blue line), the additional signal comes from volume. Please note that the volume was much higher on Tuesday, when silver declined than it was the case on Wednesday, when it moved higher.
The seasonal tendencies provide us with additional details. This time silver is already closer to the "top" area than it is to the "bottom" one. While the next vertical red line (topping area) is "scheduled" for the second week of December, it is certainly possible for silver to top sooner. Please keep in mind that these tendencies have been very reliable, but often on a "top/bottom in near" instead of exact dates. So, if the top is to be reached soon (or it has just been reached), it would not invalidate the whole pattern.
Since this week's update included the analysis of gold in currencies other than the U.S. Dollar, I believe it is a good idea to feature also similar analysis of the silver market.
The chart of silver is not that bullish, as is the case with gold, because there is no visible rising trend channel - the situation is somewhat similar to the one on the gold in yen chart.
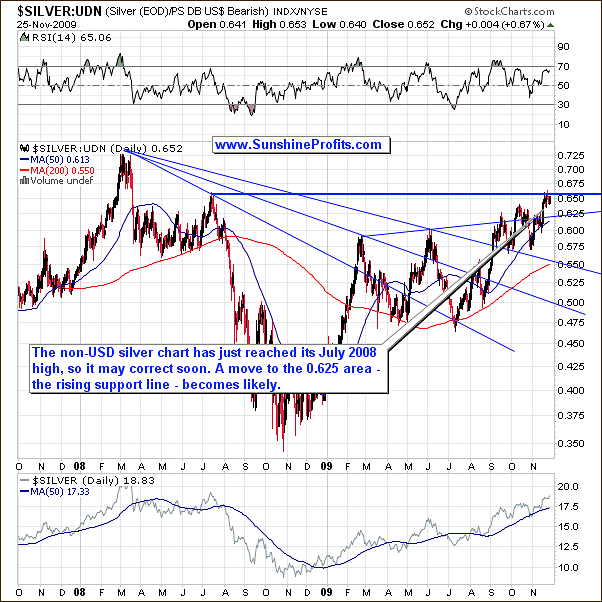
This is not the only similarity between silver and gold in Yen. The late-February - today consolidation may be seen as flag pattern, which means that the rally following the breakout is likely to take the ratio much higher - taking into account the size of the October-2008 - February-2009 move preceding the consolidation. In this case the target would be above 0.75 - above the 2008 high. Naturally, I expect this to mean higher silver prices in USD as well.
However, this is not likely to take place immediately, as the ratio has just reached one of the important resistance levels - the July 2008 high. This means that we may need to see silver trade sideways before a more significant move. Today's price action seems to confirm this.
Platinum
I mentioned platinum last week, when I wrote the following:
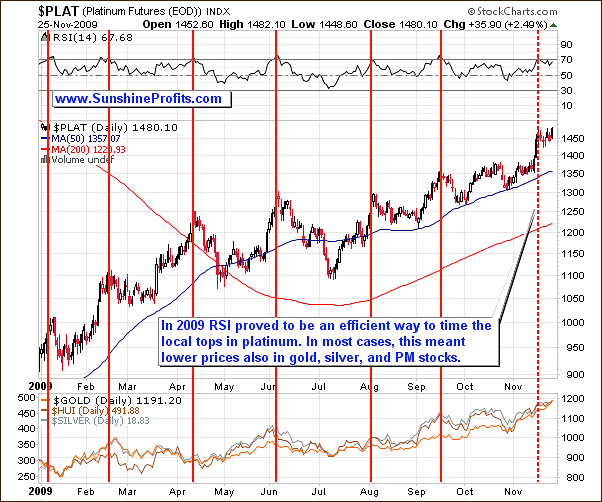
The reason that I mention platinum this time is that the RSI indicator has once again signalled lower prices ahead. Please note that this does not mean that the top will be reached immediately, but it means that is relatively close to it, which confirms points raised earlier in this update.
Consequently, the top might have just been reached, as it is about a week after the RSI signaled the top on the platinum market. We have already seen this type of action in February.
Moving on to the situation on the Dollar market, let's begin with the long-term chart.
USD Index
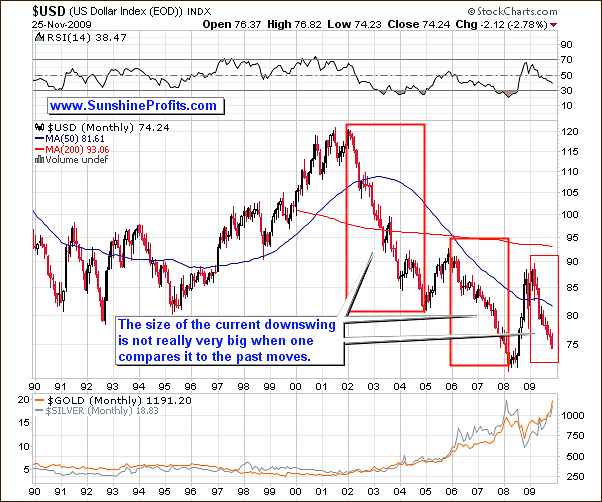
There are no big changes on the above chart since I featured it in the October 30th Premium Update, but I decided to provide you with this chart anyway, as it helps to put things into proper perspective. The size of the current downswing is still not very big when one analyzes it from the very-long-term perspective, so I don't think that a rally from here is imminent. Consequently, gold and silver may rally in the long run despite their short- or even medium-term weakness.
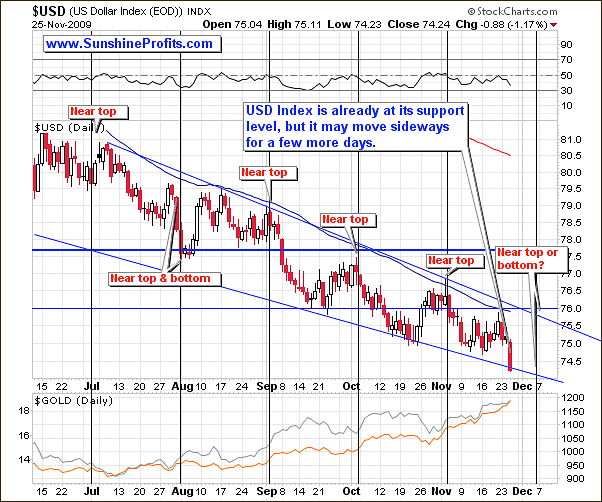
The situation on the USD Index evolves in a predictable fashion. So far, the USD Index has been trading lower between two blue borders of the trading channel. The seasonal tendencies suggest that the U.S. Dollar is likely to put a top (more likely) or a bottom in the first half of December. This could mark the end of the correction in the precious metals, or at least the end of the first part of the correction. I will let you know, once we get more information.
Precious Metals Stocks
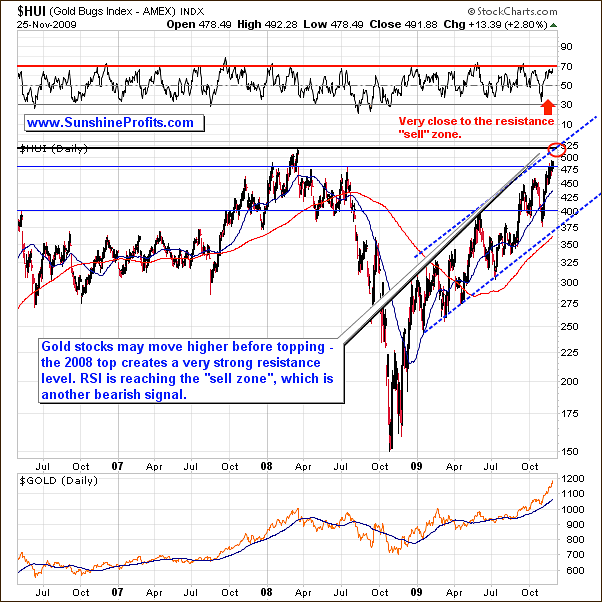
The precious metals stocks are also very close to their key resistance levels created by the March 2008 and July 2008 highs. While the HUI Index moved above the latter resistance, it is still relatively close to this particular level. The 500 - 525 level is still a possible target for this rally, but the risk of a sell-off has increased significantly after today's overnight price action.
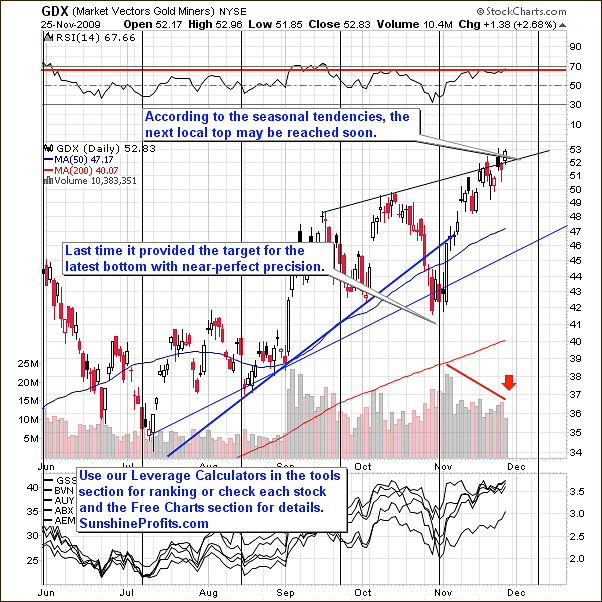
Once again, the seasonal tendencies suggest an important extreme in the first part of December. Based on today's price action it is not certain whether it would be a top or a bottom, however if that is to be a top then the upside is rather limited. On the other hand, the risk of a sell-off would increase with each day of rising prices. Still, based on what we've seen today, it seems that one should prepare for lower prices in the coming weeks, even if the local top has not materialized yet.
The volume confirms this - it was relatively high on Tuesday when the value of the GDX ETF decreased, but low on the following day, when GDX rallied - which is a bearish signal.
Additional confirmations come from the main stock indices.
General Stock Market
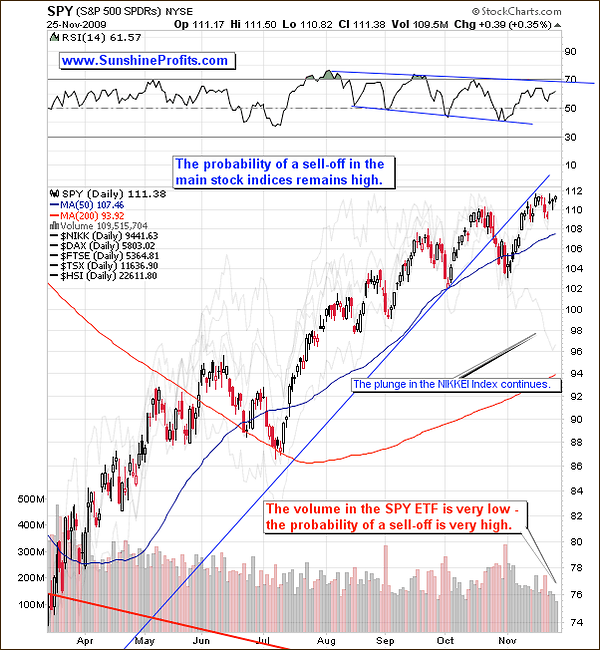
Much has been written about how overvalued the general stock market is, and how likely it is that it will plunge immediately, after which stocks moved lower for a few days, but in the end rallied again and again.
However, the strength of the bearish signals has increased even further in the past few days. The divergence created by the NIKKEI Index moving visibly lower has become even bigger, but the most important bearish signal comes from the analysis of volume. The volume has been declining in the past several weeks along with rising stock prices, and the scale of this phenomenon has been remarkable.
Additional bearish signals come from the financial sector.
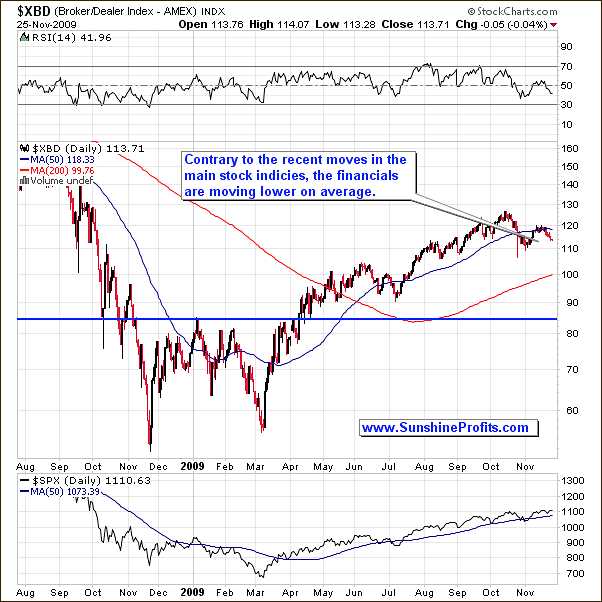
In 2007 the Broker/Dealer Index topped and began to slide before the rest of stocks, and it also put bottom earlier than the general stock market (as seen on the above chart), so it is often leading the main stock indices.
Please note that this time, this index didn't move above the October high in November - contrary to the SPY ETF. Could this mean that the main stocks indices are likely to follow and move lower in the not-too-distant future? Historical performance of the financial sector relative to other stocks confirms this.
For now, PMs remain positively correlated with the general stock market.
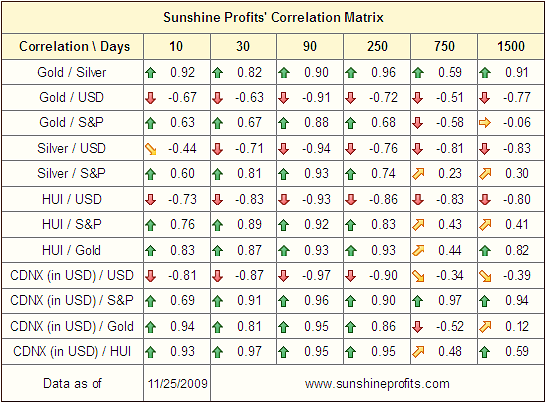
The values of the correlation coefficient are low in the long- (750 trading days) and very-long-term (1500 trading days) columns, but the analogous values in the short- (30 trading days) and medium-term (90 trading days) are positive. In other words, a plunge in the general stock market may have a negative impact on the precious metals market in the short term, but it will not be the key driver of the PM prices in the long run.
Summary
The analysis of the bull market in many currencies points to a similar conclusion - the bull market in the precious metals is healthy, but it seems that the most probable scenario in the short term is a consolidation. The same can be said about silver and PM stocks.
The analysis of the cyclical tendencies in PMs and USD Index suggests that the first half of the December will include an important extreme for these markets. Should that be a top, it doesn't seem that PMs would move much higher, but if that is to be a bottom, it implies that a volatile plunge may materialize soon. This is why I believe it is justified to exit one's speculative positions in the precious metals market.
At this point, it is much too early to say how low gold/silver would go, as there is no proof that this has indeed been a top. Since the price level, at which the top is formed is usually important in determining the size of the correction, it is imperative to be sure that the top is in fact in, before making detailed projections.
This completes this week's Premium Update.
Thank you for using the Premium Service. Have a happy Thanksgiving holiday weekend and a profitable week!
Sincerely,
Przemyslaw Radomski

