
At Sunshine Profits we're holding gold and we find ourselves in very good company with some of the world's biggest players. The smart money is definitely in.
Central banks are net buyers of gold for the first time in 22 years.
According to a report by precious-metals research firm GFMS, for the first time since 1987, central banks around the world bought more gold in the second quarter than they sold. India recently bought 200 tons of gold from the IMF and it won't surprise anyone if China steps in to purchase the other 200 tons offered for sale.
Some of the world's most successful traders are in gold.
John Paulson's hedge fund holds a massive gold position in the SPDR Gold Trust (GLD) and large positions in gold miners.
Star hedge fund manager, David Einhorn, who predicted the fall of Lehman Brothers, used to stay away from gold for personal reasons. His grandfather was a gold bug who held on to his gold position for 30 years waiting for the U.S. greenback to collapse and for inflation to run amuck. Apparently Einhorn now thinks that grandpa may have been right all along but just had his timing wrong. He initiated positions in gold for his fund.
"Being a patient investor is one thing. Being 'wrong' for three decades is quite another," wrote Einhorn in a letter to his investors. "To everyone's dismay, we believe that some of Grandpa Ben's predictions are playing out."
Paul Tudor Jones, whose company manages about $11.6 billion, told his investors recently that although he had never been a gold bug, the time to hold gold is now.
"It is just an asset that, like everything else in life, has its time and place. And now is that time," he said.
Jim Rogers, who has been talking about gold for longer than some of these other star investors, said a few days ago that he expects gold to go to $2,000.
"It's very clear there is huge suspicion about paper money around the world. This suspicion is gathering steam. Governments are printing huge amounts of money. This has always led to higher prices. Maybe I am wrong and it's different this time. But I doubt it.
Additionally, no new large gold mines have been opened in decades. Some of those mines are over 100-years old. They are all depleting. On the other hand, central banks have huge Gold reserves above ground -- and they are less interested in selling than in the past.
If you adjust Gold for inflation and go back to its former all-time high in 1980, Gold should be over $2,000 an ounce right now if you want to say it's reaching new inflation adjusted all-time highs. That does not mean Gold has to get back to a true all-time high. Nothing has to. However, I suspect that given all the money printing in the world, we will see much higher prices for hard assets."
So, the smart money is in, but it's clear to me that the real fireworks will start when Main Street catches gold fever. The gold market is small. The market cap of all the gold stocks in the world is less than that of Microsoft or Walmart. So when the public finally rushes into gold.... Well, that's when we'll be very glad that we got in early.
In the previous Premium Update I wrote the following:
Please remember that gold is only above its 1980 high in nominal terms. Adjusting it for inflation gives us price of gold much above $2,000, and that is by applying the official inflation statistics, which are generally not reliable in my view, as the way inflation is measured has been changing over years. In other words - It is likely that inflation is underreported.
This week, I will provide you with more comments on the numbers that one gets by adjusting old gold and silver highs for inflation. I don't want to make detailed projections here - instead, I would like to focus on the scale of the move that is yet to come, so let's use the $850 as the high for gold in 1980, and $45 for silver. Taking both numbers into account - using the CPI data from the US Bureau of Labor Statistics we can adjust these old highs to about $2,750 and $146 respectively - as of August 2009. However many investors are reluctant to use the official CPI statistics (including myself), because the way that the CPI is measured is being changed constantly, thus making its current values rather incomparable to what was reported several years ago. Why would the inflation figures be decreased artificially - by changing the way they are measured? For instance, to increase wages by smaller amounts, pay lower interest on loans (bond yields), print more money to finance war, healthcare, etc. Summing up, the idea is to take money from people and tell them that they are better off at the same time.
Therefore, in order to better measure today's value of previous gold and silver highs, it is essential to use data that has not been altered since 1980. Fortunately, www.shadowstats.com provides us with such functionality, and I've used their CPI dataset to calculate today's (actually these figures are for August 2009, so the prices should be even higher) value of previous highs.
Without changing the way the inflation is measured, the inflation-adjusted values of previous gold and silver highs are (take a deep breath) about $7,150 and $380. Keep these numbers in mind, so that you will react properly when someone tells you how overvalued gold is at $1,200 or $1,500. Yes, the inflation adjusted high for silver is almost four hundred (August 2009) dollars - now that's explosive potential!
Please note that during 1970's bull market silver's parabolic rise took place after the white metal hovered around $5 for many months. Adjusting this number by ShadowStats' inflation figures gives us silver around $50. While this may seem high based on the fact that silver is still below $20, this price level is really achievable in my opinion. When silver was stuck in the trading range below $5, a breakout above $10 sounded almost irrational, but - a few years later - it happened.
Another interesting point here is that the $45-$50 area is very strong resistance level for silver, due to the fact that this is the nominal high from the previous bull market. For instance, there are still investors, who bought silver right at the top in 1980, and were waiting ever since just to "get even". Consequently, they will sell as price touches its previous high, and I thus expect silver's rally to slow down significantly or stop temporarily once these price levels are achieved. Let me speculate a little more on what might happen then - naturally, this is just that - a speculation, not a sure bet, but it seems probable from today's point of view.
The implication would be that silver would be trading sideways (much too early to say for how long) around its previous high, but at the same time it would more or less replicate its 1974 - 1978 performance. Here's the really interesting part - this could very well mark the end of the second phase of the bull market in the precious metals, and beginning of the third one. The final, third stage of the bull market is the most volatile, and profitable one. This is the part of the bull market, when juniors truly thrive, silver outperforms gold to a great extent, and precious metals seem to be on the tip of everyone's tongue.
While we're at it, there's one more thing that I'd like to add before analyzing charts. In the latest Market Alert, I wrote the following:
(...) if I were out of PMs with my long-term capital, I would enter now. As far as the short-term capital is concerned - for now - it seems that the top is very near, so it may be useful to wait several days/weeks before adding to your positions.
It seems that a word of additional comments here would be useful, as I get the feeling that it might be perplexing to read that it might be useful to do one thing (enter the market) with a part of one's capital and do the opposite (wait/sell) with the other part.
Generally, the action that one is supposed to take depends on their risk tolerance - and consequently their portfolio structure and attitude toward money management. Risk-averse Investors should have more capital invested in PMs also during corrections, while risk-loving Speculators might be inclined to monitor market closely on a daily basis to catch even the small moves in the price of gold and silver. Therefore, depending on your preferences, you will need to monitor prices of metals in different time frames, and you will define different moves as "small" or "big".
From the long-term point of view even $50-$100 downswing is really small - think about a chart with gold's rise from $250 to $5000 - a $50 move is barely visible. On the other hand, the geo-political situation is tense and the risk of a meltdown in the financial markets is relatively high - meaning that a single event can cause gold's price to rise $100-$1000 or so - for instance if the Chinese officials decided to dump their dollar reserves on the market. This is not likely to take place in the near term, but given the enormous effect it would have on the price, I believe it is better not to be totally out of the PM market with a large part of one's capital (long-term holdings).
Conversely, if it is the short-term speculative capital that you want to focus on, please keep in mind that trading means using rather limited amount of capital for each trade. After all, there is a certain amount of capital that you should use at most, and if you use more than that, you can lose money on average (!) even if you are mostly correct in predicting moves of PMs - I wrote about this phenomenon in the past. Therefore, if you use a small amount of your short-term capital anyway, you don't need to worry about a single big event that would drive gold's price very high (you are covered, thanks to owning bullion, and using a part of your capital for long-term investments), and focus on what is probable in the short term. Here, a $50 move is very often a difference between a winning, and losing position, so focusing on such moves and exiting positions once a correction is looming, might be profitable.
Moving on to the recent events let me begin by quoting a part of last week's Update in which I mentioned that the regular interpretation of the trend channel in gold might be misleading this time:
Still, there is a specific phenomenon in the technical analysis that I've noticed during my observations - when a pattern becomes "evident" so that everyone and their brother sees it and are able to act upon it, the price does exactly the opposite to what it is expected to do. There is a good reasoning for that to take place. Once everyone takes action on a particular signal (for instance they sell before a breakdown), there is nobody left to sell anymore, and as price fails to move decisively lower, investors buy back and fuel another rally. In most cases it is very difficult to estimate if a pattern is "commonly known" or not, but the current trend channel is rather evident, so its reliability is a little lower.
Consequently, gold has broken above the rising trend line on Monday and did not move back below it so far. Therefore, it doesn't surprise me to see many messages in my e-mail inbox from Investors, who are out of the market and they are afraid that gold will never look back from now on and that it will keep rising in the foreseeable future. However, this is a small clue that this is not the case yet, and that a correction is coming rather soon. The price of gold broken above its resistance, and the breakout was confirmed by a few consecutive closes above this level, but is this enough to suggest that another strong rally will begin even without a small breather? Let's turn to gold chart (charts courtesy of http://stockcharts.com) for details.
Gold
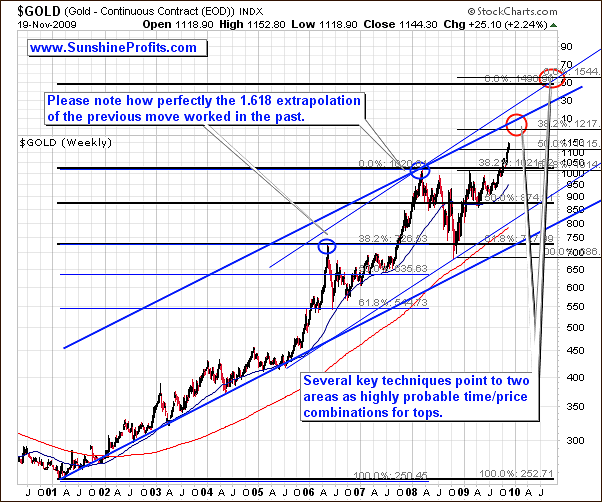
There are not big changes from the very-long-term point of view - gold is in a strong rising trend, and it is now getting close to its first target for this rally - around the $1,200 level. This chart has been analyzed deeply two weeks ago, so if you didn't have a chance to read this issue, I still recommend doing so. Additional confirmation comes from the analysis of gold price in considerably shorter time frame.
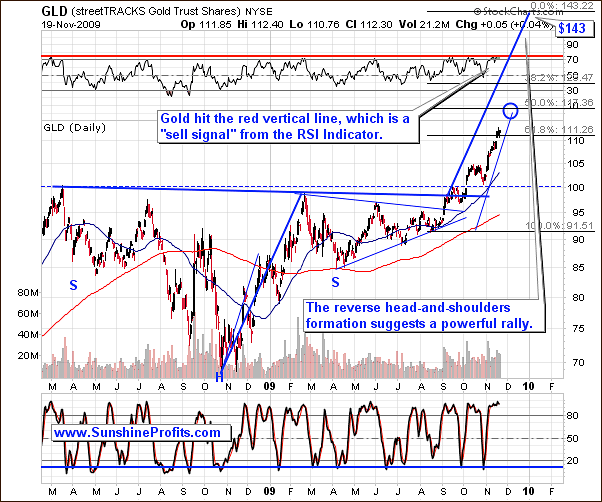
Generally, it was hard to analyze the above chart, since gold is now in new highs (nominal point of view), and there are very few techniques that it makes sense to use at this point. Still, the reverse head-and-shoulders pattern provides us with a target (the rally after the breakout is likely to equal the height of the "head") for this rally - $143 in the GLD ETF, which more or less corresponds to the $1,500 target for gold from the previous chart.
Given another confirmation of this price level, the probability that gold will indeed hit, and be stopped at this particular price, becomes higher. This price level is important also from the psychological point of view, as gold at $1,500 will gain similar attention as it did around $1,000 - and this price level stopped the 2008 rally. Assuming that $1,500 will indeed stop gold's rally, it is possible to use this price to apply other techniques that would provide us with medium- and short-term resistance levels. This is where the Fibonacci numbers are very useful (Fibonacci retracement levels are only one of their many uses). For instance, a taking a smaller rally and multiplying it by 1.5 or 1.618 one can often obtain targets also for a future rally.
I've applied this technique on the above chart, however from a different point of view - we have the start of this rally, and we assume that it will end at $1,500, so what we need is the temporary top. Taking the whole future rally into account provides us with $117 as the closest probable resistance level. The GLD ETF at $117 corresponds more or less with the $1,200 level from the previous gold chart.
Additionally, since the history tends to repeat itself more often than not, it might be useful to check what would happen if the current rally was very similar to the one from the previous year (October - December one). Extrapolating the size of that particular rally to the beginning of the current one ($91.51 in GLD ETF) provides us with the confirmation of the previously mentioned price levels - I've marked this area with a blue ellipse on the chart.
Does this mean that we need to move considerably higher right away? Not necessarily, but this seems probable at the moment. In the latest Market Alert I wrote that we would need to wait for a confirmation of the breakout in gold, to say that it is already beginning to rise parabolically. Not only has gold closed above the upper border of its trend channel for a few consecutive days, but it also moved to the previous resistance level, touched it, and bounced, which is another type of verification. This may mean that gold will indeed rise parabolically, but that doesn't mean that it won't be stopped by the previously mentioned resistance level ($1,200), nor that it is the final speculative-frenzy upleg (keep in mind the previously mentioned inflation-adjusted price levels). Please take a look at the following chart for more details.
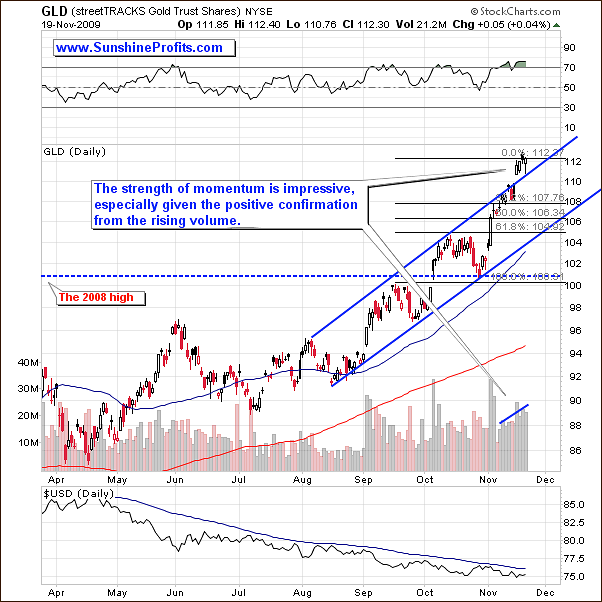
The short-term resistance level, created by multiplying the distance between two previous tops by 1.618, has been hit on Wednesday. Yet, the price did not reverse immediately. Instead, it moved to the previous resistance and verified it as a support by moving higher after touching it on an intra-day basis. Moreover, the volume has been rising during the past two weeks, which is a confirmation of the move - in other words, it suggests further gains in the short-term, not a plunge. Naturally, a sell-off might materialize even despite the lack of warning signs from volume, but this is not what is a likely outcome. Therefore, gold might move even higher (not necessarily today) before correcting in a more meaningful way.
Before moving on to the silver market, I would like to comment on the recent developments on the non-USD chart of gold (gold:UDN ratio). UDN is the symbol for PowerShares DB US Dollar Index Bearish Fund, which moves in the exact opposite direction to the USD Index. Since the USD Index is a weighted average of dollar's currency exchange rates with world's most important currencies, the gold: UDN ratio means the value of gold priced in "other currencies". It trades similarly to the USD/EUR currency exchange rate.
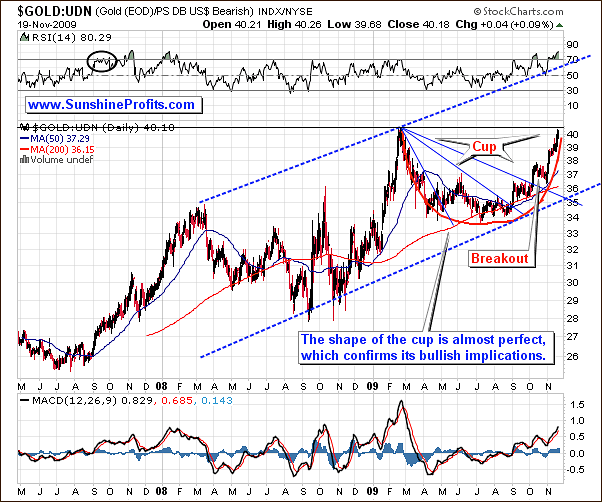
In the October 16-th Premium Update I wrote that gold didn't break above its previous high in the recent months, but that is not the same high that one looks at when viewing the price of gold in the U.S. Dollar. The March 2008 high that was the top that gold broke above in USD, but taking other currencies into account - it has already broken this level in January. Consequently, the non-USD gold chart differs from its USD counterpart but is just as bullish. After all, price broke higher almost a year earlier and has verified that breakout a few times over several months, which means that it is now set to rise higher, most likely above its 2009 high.
After breaking through three resistance levels, the non-USD price of gold finally managed to form a meaningful rally, which took it to its previous high. It may or may not move above it at this time, but that is not the most important implication here. The key observation here is that we can see a clearly visible, substantial, multi-month "cup" from the cup-and-handle formation. The exciting part is that the more U-shaped the cup is, the more bullish the formation gets, and the cup on the chart above is almost perfect. The value of the ratio may stop at its previous high, especially given the overbought RSI indicator, but once the consolidation is over (and the "handle" is formed), the non-USD price of gold is likely to soar. This may correspond to gold taking a breather and correcting after reaching $1,200, and but moving substantially higher after the consolidation is complete - perhaps to the $1,500 level.
Silver
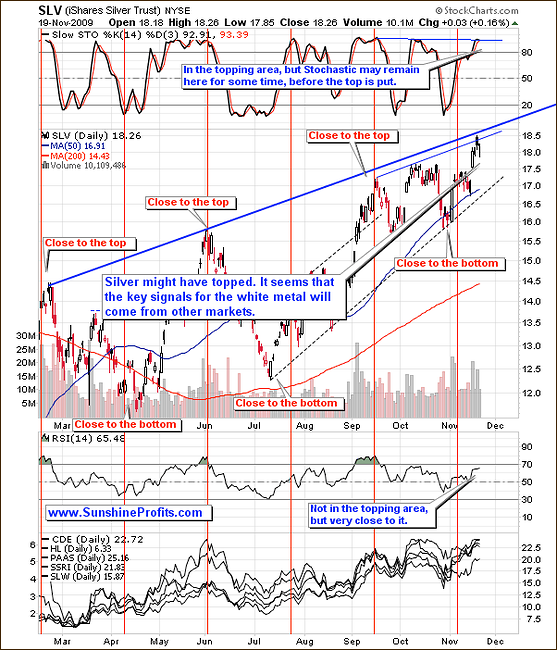
Silver reached its long-term resistance line, which means that further gains might be postponed. On the other hand, should gold rally from here - and that is the likely outcome - silver's rise may be stopped by at its previous highs of $19.55 or $21.44.
Generally, much depends on the gold market, so once we get exit signals from it, it will mean that might be a good idea to close one's silver speculative (!) positions as well.
Silver often tops in the form of a double-top pattern, so it would not surprise me to see silver decline a bit, only to re-test its recent highs and decline afterward.
While commenting on the metals market, it is always useful to feature the USD Index chart. After all - it is the currency metals are priced in. Let's begin with the long term chart.
USD Index
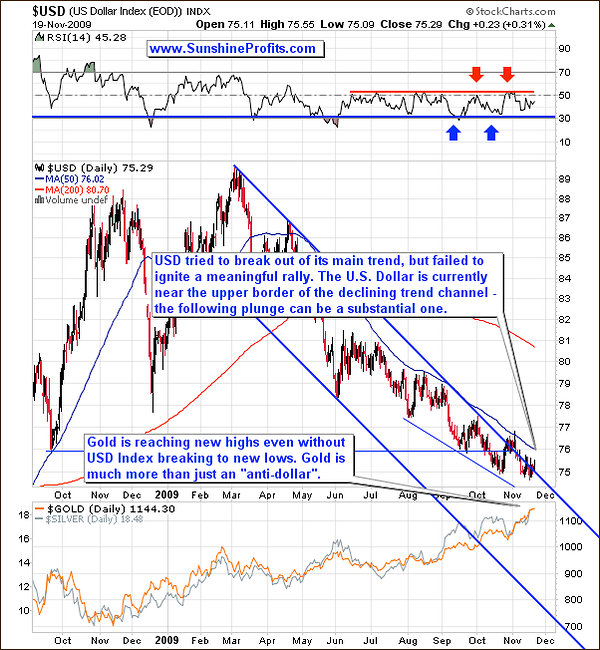
There are no big changes in the long-term USD chart, since I've covered it deeply in the October 30th Premium Update. The trend is still down. Dollar tried to ignite a rally in late October that was supposed to end the decline, but didn't manage to do anything more than just to create a fake-out bearish signal. The value of the USD Index is still trading sideways near the upper border of the trend channel, which makes a substantial plunge quite possible - a move to the lower border of the channel would mean a massive decline, much below the 70 level.
Let's zoom in for more detailed view.
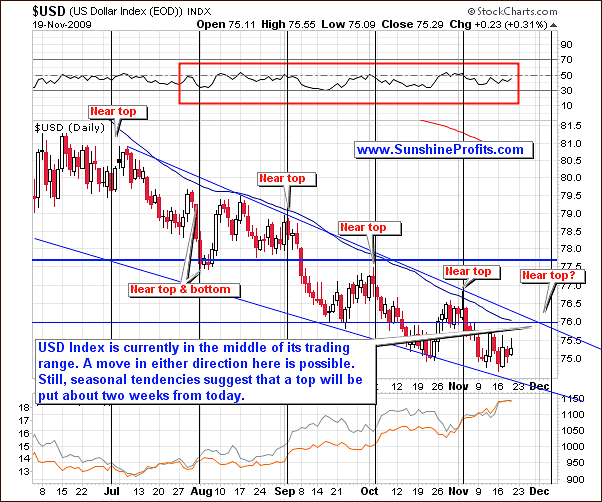
The short-term chart reveals dollar's cyclical tendencies (black vertical lines) that mark moments close to local extremes (mostly tops, though). Should this pattern repeat once again (and it is likely, given how many times it worked in the past), we might see a local extreme in the USD Index early in December, and trading sideways until that time. It's too early to say if that would be a top or bottom, but I will get back to this topic once we move closer and have more information. For now, it seems that PMs might rise/decline rather regardless of the short-term action in the U.S. Dollar. Please take a look at the correlation table below.
Correlations
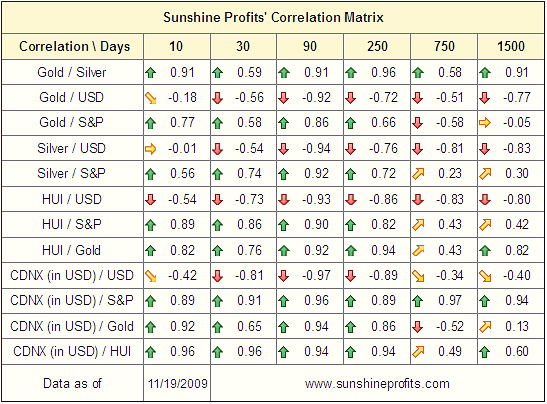
Although the 10-day column is not statistically significant, and is just a very rough estimation, it provides us insight into what tendencies might change in the very near future. In this case, the low values of correlation coefficients for gold/USD (-0.18) and silver/USD (-0.01) suggest that these markets are now more or less moving "on their own", and a catalyst from the USD Index is not needed to ignite a rally, nor plunge.
Still, the correlation coefficient between USD and gold stocks is (-0.54), so this particular part of the PM market might still reflect the moves in the USD Index in the short-term. Speaking of PM stocks, let's take a look at the long-term HUI chart.
Precious Metals Stocks
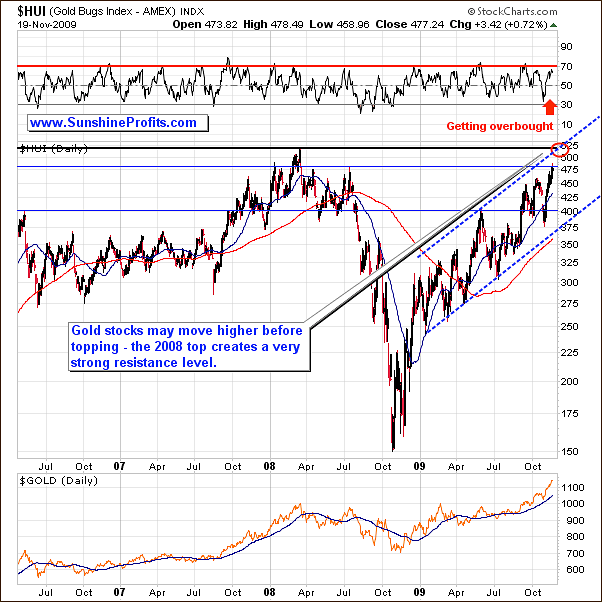
Gold stocks are very close to their old 2008 high, and given the strength of the current momentum it is possible that this level will be touched during this rally. I have used the word "touched" intentionally, as it seems the PM stocks would need to take a breather before they break into new highs.
Currently, the HUI Index is trading near a less significant high (marked with a thin vertical line on the chart), which may also stop this rally, if gold is to decline from here. However, based on the above analysis of gold charts, this is not a likely outcome so PM stocks may also move higher before topping. Based on information available today, I've marked the probable topping area with a red ellipse. Let's see if the short-term chart confirms the above analysis.
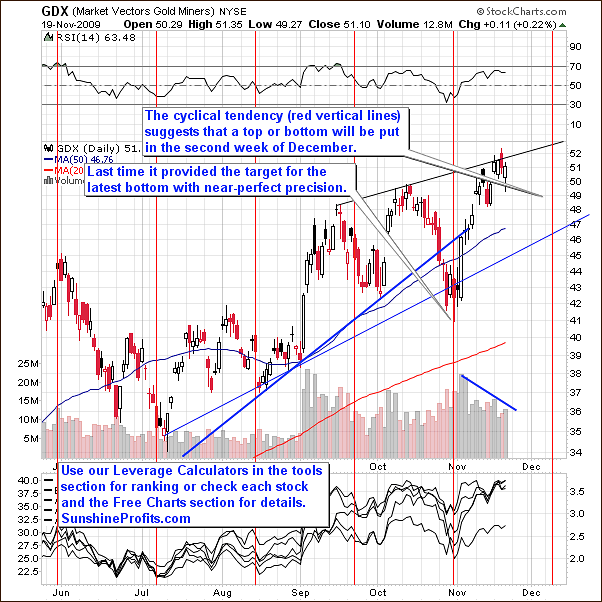
I've used the GDX ETF as a short-term proxy for PM stocks, as it allows me to analyze volume. The latter has been decreasing recently, which is an early sign that the rally is slowly running out of steam (buying power is drying up). The value of volume is not at a dramatically low level that would cause me to send you a Market Alert, but it certainly suggests that if mining equities are able to move to their previous highs, this is likely to mark a local top.
Naturally, the key question is "when?" As always, "now" is the most difficult time to invest, but once again the cyclical tendencies help us put the daily price swings into proper perspective. In the past, the red vertical lines were very close to local extremes (tops or bottoms), so it might be the case also here. This time, the next vertical line suggests top/bottom in early December, possibly in its second week. This may correspond to the top, at which the HUI Index reaches its 2008 high.
There is one more important thing that I would like to cover this week as far as PM stocks are concerned - the GDX:SPY ratio.
Precious Metals Stocks Relative to Other Stocks
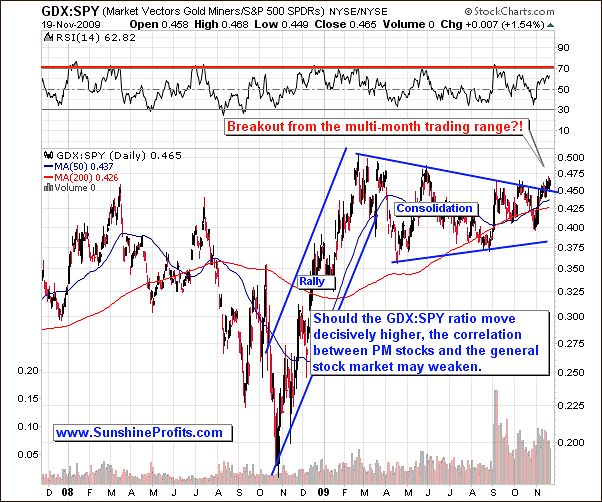
I've covered this ratio last week, when I wrote the following:
(...) currently the PM stocks are even more likely to break out of the 2009 consolidation pattern. Once they do break out, they may continue to rally strongly even despite weakness in the general stock market. This is not happening right now, but the ratio is trading very close to the resistance line, and since it is already its fifth attempt to break it, it may finally succeed.
The big news this week is that this ratio has finally managed to move above its multi-month trading range. As mentioned above, this a significant and bullish development, because it increases the odds of disconnection between PM stocks and the general stock market. This is particularly important given the bearish outlook for the main stock indices. Please note that the disconnection doesn't have to take the form of a plunge in the general stock market and a rally in PM stocks - it may mean that PM stocks would decline along with the main stock indices but to a much smaller extent.
Speaking of the general stock market, please take a look at the chart below.
General Stock Market
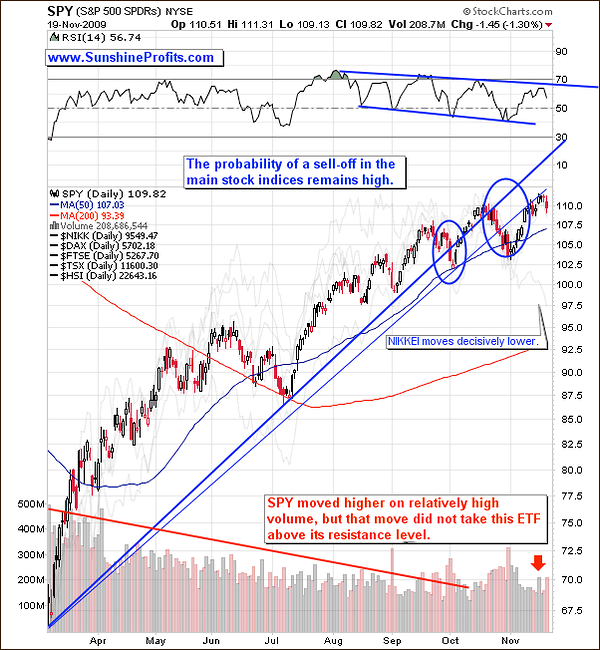
The technical situation in the main stock indices is still unfavorable, despite the November rally. The price of the SPY ETF moved higher this month, but it took place on a decreasing volume, which means that the direction of the move is likely to change in the not-too-distant future. The Nikkei 225 Index moved substantially lower in the past few days, which may be an early sign of declines also in other stock indices. Still, there were so many fake breakdowns in the S&P 500 (and thus in SPY ETF) that additional confirmations are needed before I can state that the main stock indices are heading lower. The chart (volume, failing to break above the previous rising support line) is bearish, but that is not yet a sure-bet signal that the top is already in.
Moving back to the metals market, additional confirmation of the previous analysis comes from the platinum market.
Platinum
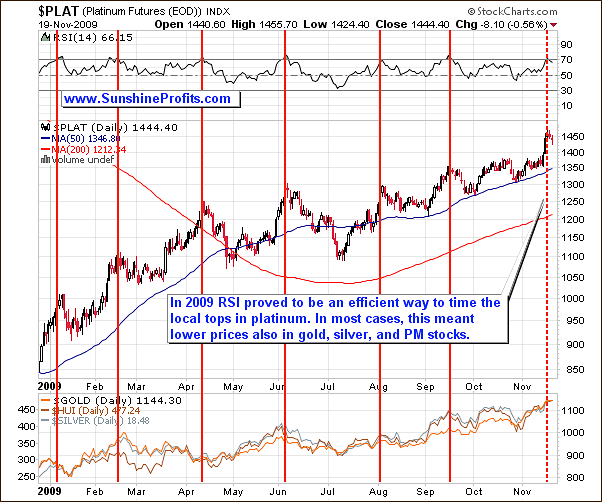
As I mentioned in the October 9th Premium Update, we see that the platinum market has been topping along with signals from the RSI indicator, and the reliability of this particular tool has been remarkable on this particular market. Moreover, the subsequent decline in platinum corresponded to a similar action also in the other parts of the precious metals market - please take a look at the lower part of the above chart for details.
The reason that I mention platinum this time is that the RSI indicator has one again signaled lower prices ahead. Please note that this does not mean that the top will be reached immediately, but it means that is relatively close to it, which confirms points raised earlier in this update.
Summary
Although the prices of gold and silver may seem high today, especially if you follow it these markets on a daily basis, they are still low in comparison to what has been achieved at the end of the previous bull market. While $7000 gold, and $400 silver may seem irrational today, and these are not my official predictions for this bull market (it's much too early to make any calls), I've provided you with these numbers to put $100 downswings and "gold is overvalued and in a speculative bubble" comments into proper perspective. I expect gold and silver to form a parabolic - bubble rally, but it's much too early for that. One of the techniques used this week points to silver around $40-$50 as the possible milestone separating the "regular rally" from a "parabolic one".
Based on this week's price action, it seems that gold may need to move higher - possibly to the $1,200 area - before correcting in a meaningful way. This would correspond to silver reaching one of its previous highs - $19.55 or $21.44, perhaps in a double-top fashion. The HUI Index is also relatively close to its 2008 high, and given the positive influence from the underlying metals, it may end the current rally right after reaching it.
The key driving markets for precious metals, USD Index and the general stock market don't provide decisive signals, and the former has been recently trading rather independently from PMs, so it may not be needed to ignite a rally or a sell-off in the metals. The implications of the analysis of the platinum market indicate that a top is close in the PM market, but it may not be put immediately.
Once the looming correction is complete, the following rally can be quite spectacular, as precious metals stocks are becoming less dependent on the main stock indices, and the non-USD gold price formed a massive cup from the very bullish cup-and-handle pattern. If the rally is to be profound even not taking U.S. Dollar's plunge into account, then the value of the yellow metal in USD can increase even more significantly from the "regular, USD perspective".
This completes this week's Premium Update.
Thank you for using the Premium Service. Have a great weekend and a profitable week!
Sincerely,
Przemyslaw Radomski

