
"Inside the Global Gold Frenzy" is the title of an article that appeared last week in The New York Times. It seems the mainstream media has finally caught on to what we've known for a long time - we are in the midst of an honest-to-goodness gold rush. The article pointed out some interesting facts.
Starting out in a part of Switzerland that is the place where about one-third of the world's gold is refined into bars and ingots, the reporter tells us that every day truckloads of gold jewelry arrive from all over the world to be melted down.
"Business is booming," he reports. Demand for bars weighing 100 ounces or less for individual investors is up 80 percent, according to a Geneva company that owns the Swiss gold refining company.
Europe and the United States are the new emerging markets for inflows of old gold jewelry and individual investor sales, whereas in the past, hoarding gold as an investment was much more popular in the Middle East and Asia.
Moving on to London, the reporter tells that Harrods, the 160-year-old London department store, last month began selling gold coins and gold bullion ranging from tiny 1-gram ingots to the hefty, 12.5-kilogram, 400-Troy-ounce bricks, the kind that are stocked in the Fort Knox vaults. The public's response has been "astounding," with bars being more popular than coins.
In the U.S., there is a new phenomenon of gold buyers setting up tables at shopping malls and people hosting gold-buying meetings at private homes, like the old-fashioned Tupperware parties.
The article suggested that recent political trends might have contributed to the global gold fever.
"With a crackdown on tax havens worldwide and Swiss bankers handing over the names of wealthy American clients to authorities, some experts say rich people now prefer an investment that can easily be hidden from the prying eyes of tax collectors."
The New York Times article reported that "even the most bullish of gold lovers were surprised last week" when the Reserve Bank of India purchased 220 tons of gold from the International Monetary Fund for $6.7 billion, a sign that other central banks might move away from dollar-denominated assets. Gold will now account for about 6 percent of India's $285.5 billion of foreign exchange reserves - up from about 4 percent.
This is a good indication of just how slow the mainstream media can be. India's huge gold purchase did not catch us by surprise, if you read last week's Premium Update. Does all this "gold frenzy" suggest a bubble? It will at some point, but were far from it. Please remember that gold is only above it's 1980 high in nominal terms. Adjusting it for the inflation gives us price of gold much above $2,000, and that is by applying the official inflation statistics, which are generally not reliable in my view, as the way inflation is measured has been changing over years. In other words - It is likely that inflation is underreported.
Generally, it was just a few months ago when gold was just a "has been" market for the mainstream media, so I wouldn't worry too much right now about this excitement. I will get back to this subject once gold moves above $1,500... And then when it moves above $3,000.
There are few more things that I would like to cover before moving on to the technical part of the update. I've been recently often asked about the correlation between the general stock market and PM stocks - can it ever be broken and what may cause this to take place, so I would like to take this opportunity to comment on that matter.
Generally, I expect the correlation with the general stock market and PMs to weaken significantly in the future (months, but how many remains unknown - 1 - 24) - I'll keep you updated through Premium Updates / Market Alerts. I expect investors to gradually wake up to the fact that PMs have MUCH more favorable fundamentals than the whole economy (thus the general stock market), and will not close their positions (yes, also hedge funds) as eagerly as they did before (during the 2008 plunge), should the main stock indices tank again. The question is, when will the people with the most cash on hand (biggest hedge funds dealing in PMs) start thinking this way. Gold above $1,000 is a big factor from this trade-o-psychological point of view. In the third - speculative-mania phase of the bull market in the precious metals, I expect "the rally to feed on itself" meaning that rising prices will attract even more buyers and so on - even without the significant influence from the dollar or the general stock market. In this way, the correlation with both of these markets would weaken.
Another thing that I believe you might want to read my comments on is the situation on the options market. It is sometimes stated that the November 23rd gold options expire week could be even more volitle than the previous week. The reasoning behind it is that there are more longs (than previously) that will need to be liquidated so deliveries won't take place, and the commercial shorts will take full advantage of this.
My take on this matter is that the week, in which options expire is often more volatile than other weeks, and that is the case not only with the precious metals market, but generally with all other markets as well. Parties holdings each side of the trade want to temporarily manipulate (I don't make any specific accusations here) the price in order to get it "to their side" just for the expiration date (please check out this link for details). Generally, after that takes place, the price goes back to where it would be if there was no options' expiration. So - the options expiration is mostly a temporary phenomenon - I really don't see much changing this month.
The last thing that I'd like to cover before moving on to the charts is the seasonality in the silver market. I've received a letter in which Subscriber mentions that "the 30 year seasonal charts for silver show Nov to be a higher drop, but the 15 year seasonal chart shows the trend to have changed". The question is which seasonal tendencies one should rely on. As always, it is useful to put things into proper context before making any calls.
In my opinion, the 15-year cycles are long enough to eliminate the "noise", so I think this signal is more important than the 30-year one. Why did this tendency change? Because fundamentals for silver have changed. There is much less silver now than it was 15 years ago, and the demand side of the market is changing - the use in photography declines but the increase in demand for industrial applications increases. Consequently, the amount of silver scrap entering the market is smaller (very large part of it comes from the use in photography), and so on. Therefore, very long-term cycles for silver could be misleading.
Speaking of silver - I received a substantial amount of positive feedback (thank you) after providing you with long-term price/time targets for this rally in gold, and I was asked to conduct a similar analysis for the silver market (charts courtesy of http://stockcharts.com). Consequently, this update will include the long-term silver chart and its detailed analysis, with the implications reaching much beyond the silver market itself. Please take a moment to study the chart below. Yes, I know that it might be perplexing and hard to read at the first sight, but I assure you there are good reasons for it - I will explain each tool used on the chart in the following part of this update.
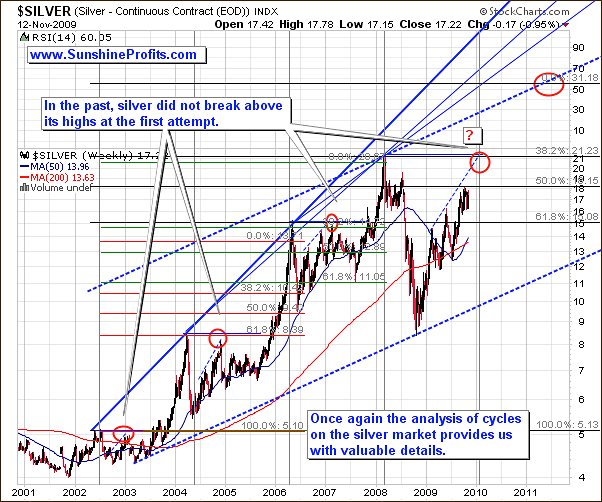
The first thing that comes to mind after looking at it is that there is certainly a bull market in the white metal. All bull markets are characterized by the fact that the price jumps and ebbs, but in the end it moves gradually higher. Although the swings are very big in both directions in case of silver, the main trend is clearly up.
I suppose you might be confused or even disturbed by the fact that silver does not share gold's gleam lately, and I realize that divergence may appear bearish. However, once you take a big step back from the day-to-day rapid movements and focus on the big - 10-year - picture, things become much more encouraging. Before making use of the technical tools it is vital to estimate the nature of a particular bull market, so that one knows what to expect, and what signals to look for.
Please note that since the very beginning of this bull market in silver in late 2001 there were four situations when the white metal achieved new highs: in the mid-2002 - silver moved above $5, at the beginning of 2004 - silver moved above $8, in May 2006 - silver moved above $15, and in early 2008, when silver broke through $21. Each time it was preceded by a sharp rally, and apart from the first - initial - rally, new highs were achieved shortly after the previous high has been taken out. I realize that this doesn't sound too bullish, given the fact that today silver is still below $21, but please bear with me before I provide you with the key points.
Each time a new high has been achieved, silver entered a boring consolidation pattern during which its volatility has been very limited. That was the case in all four abovementioned cases. Now, if history repeats itself (and analysis of past observations surely suggests so), it means that we are still in the consolidation pattern. This explains the recent weakness in the white metal - it is still in the consolidation phase, so we should not expect any fireworks here. That is - not yet, as silver is more calm during consolidations, but also more volatile during upswings/plunges. Anyway, in all past cases, the post-plunge rally did not take silver to new highs - instead, it moved relatively close to it, and corrected once again. Therefore, should this be the case once again, silver is likely to top temporarily below the $21.44 level. I've marked this area with a red ellipse.
The center of the ellipse is at the very beginning of February 2010, meaning that it is likely that a top would be put around this particular date. As I mentioned earlier, the cyclical tendencies can be a really valuable help for PM Investors, and the more I research this topic, the more I become convinced that you've made the right decision in the latest survey and instructed me to focus on this area. This time the seasonal pattern that is featured on the above chart is the nearly-2-year cycle that has always signalled extremes in the past.
There were four times that this signal was present and each time it was very close to a major top, and 3 of 4 times it marked the top almost exactly. The remaining one time it signalled the bottom just after the spectacular rally that topped in early 2004. While this doesn't necessarily mean that it will be a final top for this rally that is projected in the beginning of February 2009, it suggests that a significant top/bottom will be put. Combining this with other techniques used on the above chart, and with signals from other markets, it currently seems that a local top will be put near this particular date, after which silver will consolidate for some time.
Another tool that I've used is the multiplication of the previous moves/extremes by the 1.618 Phi number. I've described this technique in the previous essay, so I don't want to go into details here. However, please note that in case of silver, this tool has been just as remarkable in projecting the future topping prices, as it was the case with gold. For details please examine the analogous projections based on previous tops - red Fibonacci retracements and green ones on the chart.
This time, the critical points that were used are the 2002-, 2006-, and 2008 tops, and the price projection that was created thanks to this method is just above the $31 level. This is about 80% higher from here, but taking the previous rallies into account, this type of move would be quite normal for silver. However, this may not take place right away.
Naturally, this makes one wonder "how long will this consolidation take" and "how low could silver go".
Generally, it's too early to make such predictions, but I get the feeling that you'd like me to speculate on that matter anyway. So, since it is highly probable that silver's rise will be stopped at or slightly below the $21 level, I would expect it to move lower from there on a temporarily basis, possibly to where silver is today. Once silver corrects the rally and trades sideways for several weeks - months, a huge cup-and-handle formation will emerge. The cup would be created by 2008 - 2010 tops and the abovementioned consolidation would be the handle. If you've been following my analysis for some time then you know that this is one of the most bullish formations that preceds significant moves, and that the bigger the formation is, the stronger the move follows. With this kind of size of the cup-and-handle pattern it would not surprise me to see silver move quickly at least $10 higher, to the $31 level (area marked with the red ellipse on the chart).
Going back to the long-term price projections - I would like to provide you with additional relative calculations that it was not convenient to put on the chart.
- The size of the post-breakout rally compared to the previous high:
1. Silver broke $5.13 and topped at $8.50 - 65.7% higher
2. Silver broke $8.50 and topped at $15.21 - 78.9% higher
3. Silver broke $15.21 and topped at $21.44 - 41.0% higher
4. Silver breaks $21.44 at tops 41% - 78.9% higher - $30.23 - $38.36 - The latest bottom before the rally - new high
1. From $4.34 to $8.50 - 95.9% higher
2. From $6.64 to $15.21 - 129.1% higher
3. From $11.06 to $21.44 - 93.9% higher
4. From $16 - $18 silver goes 93.9% - 129.1% higher to - $31.02 - $41.24 - Post-rally bottom compared to the new high
1. From $4.28 to $8.50 - 98.6% higher
2. From $5.45 to $15.21 - 179.0% higher
3. From $9.48 to $21.44 - 126.2% higher
4. From $8.40 silver goes 98.6% - 179.0% higher to - $16.68 - $23.43
(Naturally, we don't know yet if the new gargantuan rally will begin from $16-$18, but it currently seems as the most appropriate guesstimate)
The first two calculations types provide similar outcome - $30 - $40 (which corresponds to the area marked on the chart around May 2011), while the third one suggests a top around the $20 level - substantially lower than the first two methods. This is the part of the analysis, where it is imperative to analyze numbers along with events that correspond to them. In this case, I'm referring to the $8.40 2008 October bottom that was more of a single, extrement event than a silver-cycle-only related one. What I'm saying is that generally the targets for this bottom would have been much higher if it wasn't for the massive bank-bankruptcy-driven plunge in the general stock market.
The technical analysis is very useful to tell you what's the likely outcome, but it doesn't provide an impenetrable price levels that will hold no matter what - from time to time price will go higher or lower than it is likely to, especially given a very strong influence from the exogenous factors. It is generally very difficult to say if an even is really meaningful or not, but this time, we all realize that it was the massive plunge in the general stock market that caused a liquidation of positions in virtually every market including silver - not the other way around.
Summing up, the third price projection is less meaningful than the first two. Still, it more or less corresponds to the first price target for silver - to reach, or to top temporarily slightly below the previous high of $21.44.
Does all of the above mean that silver will not move to new highs during this rally? No, it may do so, given an additional boost from the general stock market or other exogenous event, but the way I read charts doesn't suggest that this is likely. Several paragraphs above I mentioned that the above hard has "implications reaching much beyond the silver market itself". What I meant is that since silver's outperformance - "catching up" accompanies the late stage of an upswing, and we don't see it right now, it means that this rally is likely to take gold significantly higher before it tops. This would correspond to last week's price projection of $1,500. In other words, although you may here "gold is in a speculative bubble", or "gold is overvalued" etc. from various sources, our reliable techniques suggest that "we ain't seen nothing yet" and PMs have much more to go.
Taking the silver-to-gold ratio into account, $1,500 gold and $30 silver would correspond to 0.0(3), or 30 if you prefer to view this ratio in the gold-to-silver form. This is a very possible number, given its previous values, so both numbers seem to be in tune with each other. Speaking of the silver-to-gold ratio, please take a look at the following chart.
Silver to Gold Ratio
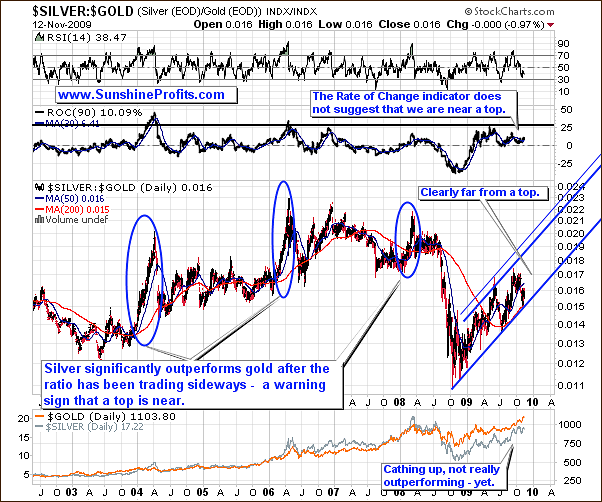
The silver-to-gold ratio has been declining in the past few weeks, which is confirms that this is not a final stage of this rally, and that it has much more to go. Naturally, this does not mean that there will not be any corrections along the way, but from the long-term point of view, this rally is still in its early stage. Let's take a look at the short-term silver chart for more details.
Silver
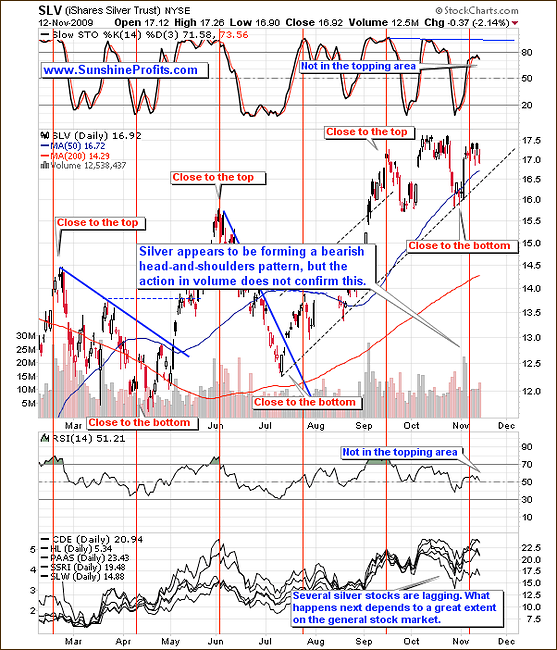
Silver appears to be forming a bearish head-and-shoulders formation, but the action in volume does not confirm this. I've discussed this matter last week when I commented on the situation in the PM stocks:
In the "head" part of the pattern the price fails to go much above the previous top, and in the final, third attempt to move to new highs, it doesn't even go above the previous (head) one. Since there is not enough buying power, the volume is lower with each upswing preceding a top (shoulder/head/shoulder). Without the confirmation in form of declining volume the whole logic behind this formation is flawed. That is precisely the case with the precious metals stocks, as this week's rally took place on a huge volume - definitely higher than the one on which the "head" was formed. Therefore, I don't think that the head-and-shoulders pattern should concern you at this point.
However, the same can be said about silver this week. Moreover, the indicators (RSI, Stochastic) that mostly corresponded to the topping areas in the silver market are now relatively far from their overbought levels. Therefore, despite its recent weakness relative to gold, silver by itself doesn't seem to be topping. Still, since it is highly correlated with gold, the yellow metal might ignite a decline in silver if it corrects itself. Speaking of gold, let's turn to a chart featuring its performance in the long term.
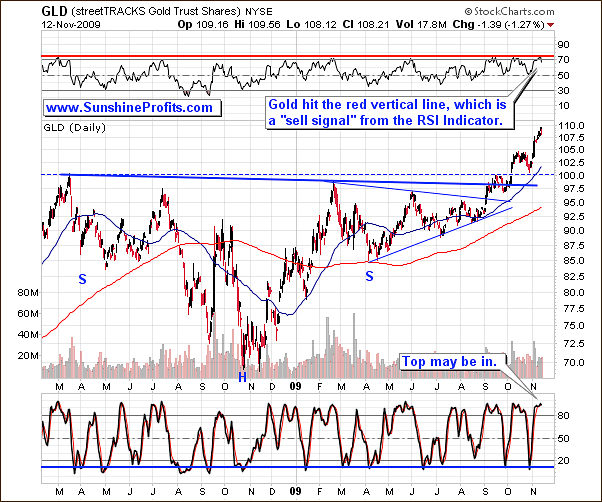
I doubt there are many Investors, who are disappointed with gold's performance in the past few weeks. However, no market moves up in a straight line and corrections from time to time are to be expected. The long-term RSI Indcator suggests that one of these temporary turning points is very near. The value of the Stochastic Indicator (on the bottom of the chart) is high enough to make a decline possible - it is not really efficient in timing the exact top, but on the other hand very few tops are put without the Stochastic being overbought. Still, we will need to zoom in for more details.
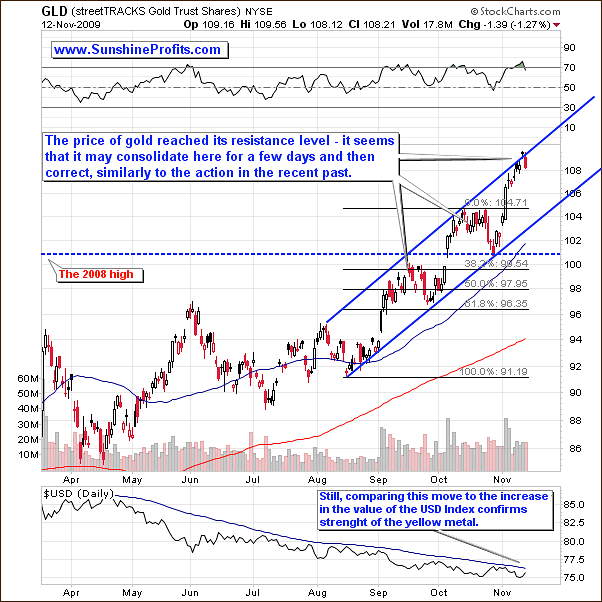
Gold moved to the upper border of its short-term trend channel, which is an indication that it may need to consolidate, or even go back to the lower border of the pattern. The RSI Indicator confirms this.
Still, there is a specific phenomenon in the technical analysis that I've noticed during my observations - when a pattern becomes "evident" so that everyone and their brother sees it and are able to act upon it, the price does exactly the opposite to what it is expected to do. There is a good reasoning for that to take place. Once everyone takes action on a particular signal (for instance they sell before a breakdown), there is noone left to sell anymore, and as price fails to move decisively lower, investors buy back and fuel another rally. In most cases it is very difficult to estimate if a pattern is "commonly known" or not, but the current trend channel is rather evident, so it's reliability is a little lower.
This does not mean that clearer patterns are always less reliable - this is not a "linear function". By that I mean that only if the pattern is VERY evident does the above analysis apply. This is very similar to the analysis of sentiment - if 60-70% of market participants think that price of a given asset will go up, it is rather bullish news, as there are still people, who are can "join the party" and push the price even higher. However, once this number rises to 95% or so, it's time to get out, as there is virtually no (5%) buying power left.
Therefore, if you are short-term oriented and were waiting for a slightest signs of weakness in gold to lock in your profits - it may be a good idea to do so now. Other Investors/Speculators may want to wait for additional confirmation that the lower prices are likely from here. In any case, I don't think that the current situation justifies entering a short position on the precious metals market.
Moving on to the precious metals stocks, it seems that this sector may provide us with a shorting opportunity, but only under specific circumstances.
Precious Metals Stocks
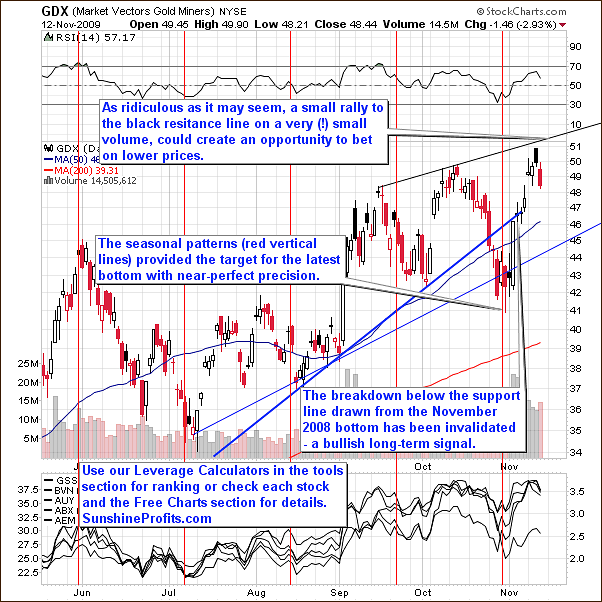
The value of the GDX ETF (proxy for the precious metals stocks) is very close the thin black resistance line, which makes probable that this rally will either take a breather at it, or correct. The analogous resistance line on the HUI Index has been touched this Wednesday, so there is a chance that the top has been put. Still, the "sell" signals are not coming from that many sources to make me send a sell alert - I will get back to this matter in the following part of this update. For now, the signals coming from the GDX ETF confirm points and signals made in the gold section. Should the PM stocks move to the black resistance line on a very high volume and we get additional bearish signals from other markets, I will consider betting on lower prices in the short term.
One of the markets that we need to look at is the general stock market.
General Stock Market
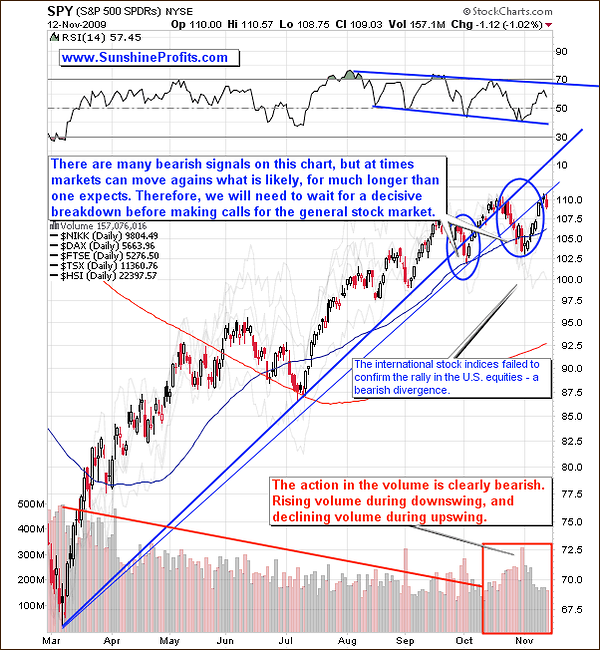
The general stock market is testing its previous highs and at the moment it is very difficult to say what the outcome will be. The technical signals and volume point to lower prices, but the main stock indices are often tricky and move against their likely trajectory for longer than one can expect. Before the 2007 top, there were many months of negative divergences, since the beginning of the year, yet the top didn't form until October. This is why it is crucial to wait for a decisive breakdown and a confirmation. Once the value of the SPY ETF fails to move above the rising resistance line and moves lower on high volume, the following influence on the precious metals market can and is likely to ignite a correction.
There is one more thing that I would like to cover this week regarding the general stock market and that is the relative performance of PM stocks to other companies.
Precious Metals Stocks Relative Valuation
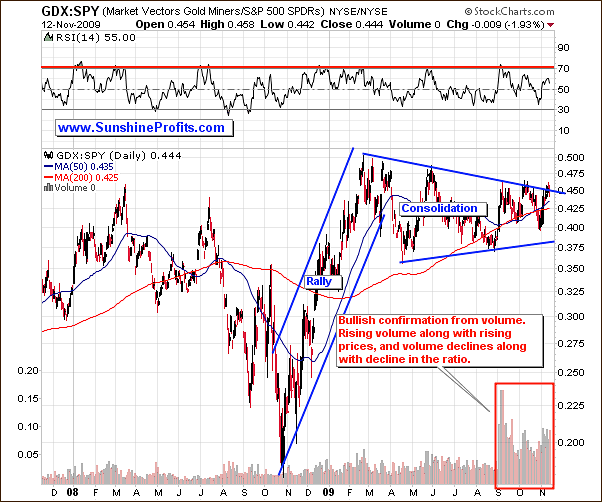
I have covered this ratio previously, when I wrote:
What we see above is a long consolidation after huge rally. This is really encouraging from the long-term point of view, as the rally that follows such a consolidation is often similar in size to the move that preceded it. If PM stocks manage to break out soon, we could see some real fireworks in the sector, for instance the GDX would equal the value of the SPY ETF. I realize that unless general stock market plunges, this means HUI above 800, but this is what the above chart suggests, and what I expect to take place sooner or later.
Today, the situation is similar, but currently the PM stocks are even more likely to break out of the 2009 consolidation pattern. Once they do break out, they may continue to rally strongly even despite weakness in the general stock market. This is not happening right now, but the ratio is trading very close to the resistance line, and since it is already it's fifth attempt to break it, it may finally succeed.
As I mentioned a few paragraphs earlier, the "sell signals" are not coming from many sources. One of them is the Gold Miners Bullish Percent Index (the relative amount of the gold stocks on the buy signal according to point and figure charts to all gold stocks taken into account).
Gold Miners Bullish Percent Index
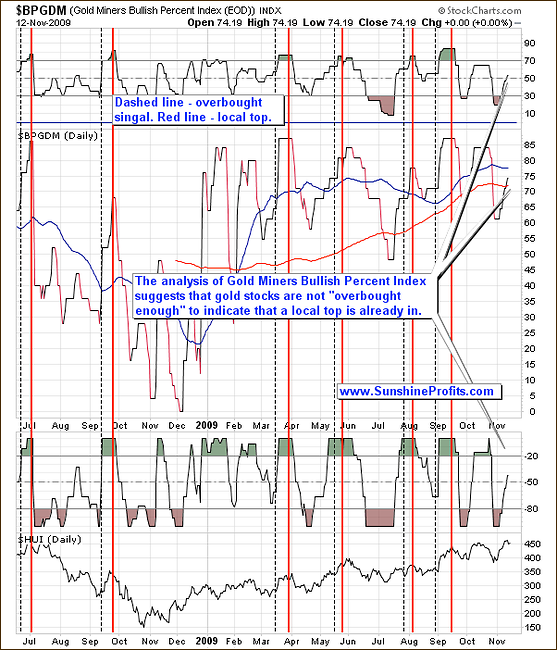
The high-probability sell signal is given if this index moves higher, and both indicators (RSI and William's %R) used on the above chart become, and then stay overvalued for some time. The initial overbought signal is marked with the vertical dashed black lines, and the top signal is marked with red lines. None of this was the case recently, so the probability that the top is in, becomes lower.
Of course the signal from this index is not "a must" for a top in the PM stocks to emerge - for instance the previous local top was not signalled in this way - this non-confirmation simply lowers the odds of an immediate downswing in the mining equities.
USD Index
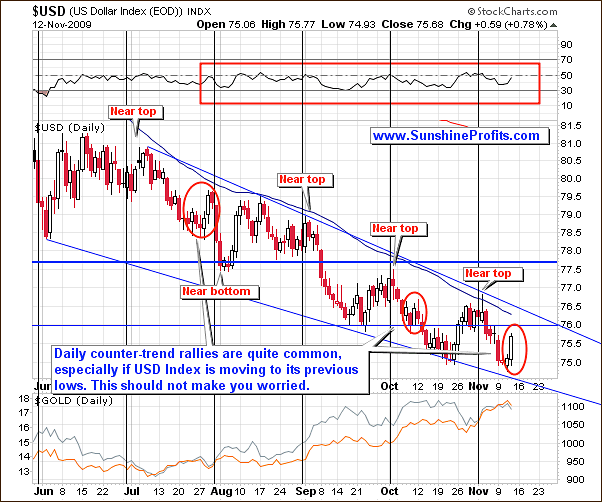
The USD Index moved higher yesterday causing a mini-pullback in the precious metals, but should this make you concerned? Not really. The trend remains down, and a single-day or two-day rallies are quite common even during particular downswings, so yesterdays action doesn't really change anything as far as the bearish/bullish implications are concerned. Again - the trend remains down, which is positive for PMs.
Moreover, please compare yesterday's performance of the USD Index to the performance of gold and silver - although the daily rally was rather big, the reaction in metals was limited, which is another sign of the strength in this market.
There is one more thing that I would like to cover this week before summarizing, and these are signals generated by two of our unique indicators. Let's begin with the SP Gold Bottom Indicator.
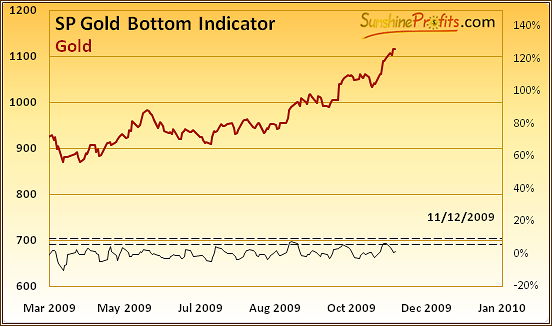
As stated in the Premium Charts section "the buy signal is given, when indicator breaks down lower dashed line, or when it breaks up through the upper dashed line". This took place after Monday's close, and it signalled that higher prices are to be expected. I didn't send out any alert based on that, as it was in tune with what I wrote in the latest Premium Update - that gold is likely to move at least a little higher.
Let's take a look at the average performance of gold after that signal was generated in the past.
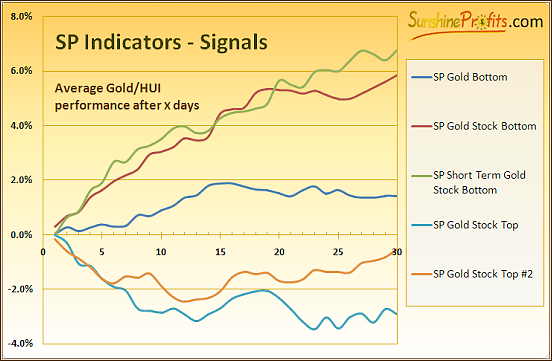
It is featured by the blue line in the middle of the chart. Although it may seem that this signal is weak compared to other ones, please remember that it is the only one for gold, and other signals are for gold stocks - which are more volatile. Anyway, the biggest part of the move that is signalled by the SP Gold Bottom Indicator takes place on average about 7 days after the signal is generated and makes gold rally for another 7 days or so.
Please keep in mind that these are just averages, but they surely confirm what I wrote earlier, and the way gold topped two previous times in the past two months. Short-term oriented traders would have been happy closing their positions early after the biggest part of the rally was over, while other Investors/Speculators could wait for gold to consolidate in a slowly rising small trend channel.
The latest signal comes from the SP Gold Stock Bottom Indicator, which also suggests that PM stocks may peak, but most likely after an additional small rally.
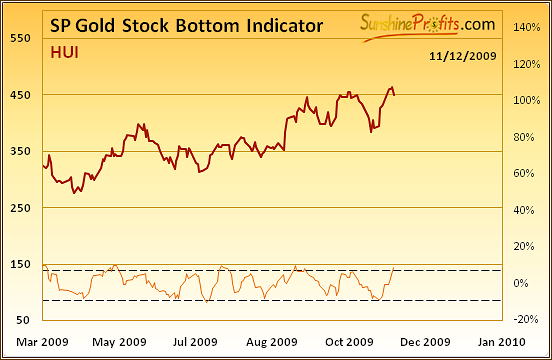
Please take a moment to study HUI's performance after this indicator moved above it's upper dashed line. Each time it happened, it meant that a top is near, but it makes sense to bet on higher prices in the immediate-term. This is another non-confirmation of the bearish signals from the GDX ETF chart analysis that makes me wait for additional signals before sending an alert with a "sell PM stocks" message.
Summary
The precious metals bull market is healthy and the post-$1,000-breakout rally is likely to be still in its early stage, which is being confirmed by the (lack of) action in the price of silver. This is very encouraging from the long-term point of view, but may require a little more patience from those heavily invested in the white metal.
The short-term situation is rather mixed in case of the precious metals. There are early signs that the top is very close, so you may want to take some money off the table if you prefer to exit your positions rather early. On the other hand, the topping signals from the gold and GDX charts are not being confirmed by other methods of analysis, so if you prefer to stay in the market until it is very likely that this action is unprofitable, then I would currently suggest to hold your positions. I will keep you updated.
This completes this week's Premium Update.
Thank you for using the Premium Service. Have a great weekend and a profitable week!
Sincerely,
Przemyslaw Radomski

