
This has surely been an exciting week for gold and silver investors. The post-Halloween rally took metals and corresponding stocks substantially higher, and gold itself reached new highs - at least in nominal terms. The mainstream media are now reporting gold-related stories on a big scale and "gold prices" is the second most often searched for phrase on http://finance.yahoo.com. The contrarians among us might be concerned about this fact, as we all know what happens, when everyone gets on the same side of the boat. However, gold DID break above $1,000 recently, and also verified it, so the excitement now is quite natural. In other words - there is no divergence that would indicate that a top is in. On the other hand, I'm still receiving e-mails, in which Readers suggest that gold does not have to go up, that its too high, etc. This is encouraging, because it means that a certain amount of investors is still out of the market, and can get in, thus fueling further gains.
The divergence that I'm referring to would take place if we were getting close to serious resistance levels after a huge rally without any breather whatsover, and still everyone and their brother would be bullish on gold. This is what I prefer to see, as a confirmation, when timing tops. I don't know if you recall this, but that was the case before the February 2009 top.
If you have been following the weekly Premium Updates for some time now, you may recall that this summer I wrote about a phenomenon known as the "Summer Doldrums", the season when demand for gold slows down temporarily while farmers in India plant crops and wait for the monsoon rains. Demand for gold picks up again when they harvest in the early September anxious to convert their profits into gold in time for the festival and marriage season. In fact, I advised my readers not to stand aside during the summer in hopes of entering the market at lower prices. I said at the time, and it turns out that I was right, that the potential cost of being completely out of the market was too great.
India, the world's largest consumer of the yellow metal, made the headlines this week as the price of gold touched an all-time high on Tuesday after a large sale of 200 tons by the International Monetary Fund (IMF) to India's central bank. Gold struck a high of $1,095.05 an ounce in London, against $1,084.50 late in New York on Tuesday and was at $1,090.00 on Wednesday and $1,089.00 on Thursday (London PM fix). More than 18 years after New Delhi had to sell 67 tons of gold to tide over a balance of payments crisis, the Reserve Bank of India came full circle and purchased three times that amount of gold from the International Monetary Fund.
So what's the big surprise?
There is none.
If anything I'm surprised China didn't jump first at the opportunity to bolster its gold reserves. I can say that I will be even more surprised if it doesn't buy the remaining 200 tons the IMF is authorized to sell. Some of you may remember that China and India jointly called for the IMF to sell all of its thousands of tons of gold only a few months earlier.
If you've been reading the news and following our Premium Updates you know that the IMF announced in September that it would sell 403 tons to finance loans to developing nations. It was a foregone conclusion that the IMF would sell the entire amount to central banks rather than flood the open market. Central banks themselves are no longer selling gold. Rather they are holding on to their gold reserves as the value of fiat currencies decline. In some cases they are increasing their holdings as countries like China, with large holdings of U.S. dollar assets, are worried about the declining value of the U.S. dollar.
Think about it - governments are institutions, so they cannot be "emotional", but it is ultimately an (emotional) individual (or a group of them), who make decisions regarding selling and buying precious metals. Sounds evident, but the implications are not that obvious. The more price of an investment asset goes up, the more attractive it becomes to buyers, as they project the same pace of growth in the future (by the way, this is the psychological mechanism that causes speculative bubbles). Consequently, when gold rises high (and silver even higher on a relative basis), it would not surprise me to see governments / central banks decide to purchase even more metals. The key implication here is that often repeated bearish argument - that monetary authorities will dump their gold on the market thus causing massive plunge in the metals - should not make you overly concerned.
India's move - the largest central-bank purchase in at least 30 years, according to Bloomberg news reports - should be seen as nothing more than a central bank deciding to diversify its asset base and beef up its gold reserves.
I believe it won't be long before China, or Russia, or even India buys up the rest of the IMF gold.
Speaking of India, I have been following reports in the Indian Press indicating that Indians are not deterred by the high price of gold. Apparently Indian consumers have realized that gold prices will not come back down any time soon and are now continuing to buy the yellow metal despite its high price. It seems Indian consumers are focusing on the gold's monetary qualities. Gold coins seem to be the hottest commodity in India these days as people shift from buying just jewelry and banks, brokerage houses and post offices across India are promoting the sale of gold coins.
Therefore, we have another signal that the fundamental situation remains favorable. Still, it is not fundamental factors that drive markets in the short- and medium-term - emotions do. This is why we need to turn to charts (courtesy of http://stockcharts.com) and their analysis for more details as to what the next several weeks and months may bring us. Since the situation has been clearly favorable in the past week for gold, but the situation was cloudy in the USD Index, and the general stock market (each of which could strongly influence the precious metals market), so I would like to focus on them first. Let's begin with the U.S. Dollar.
USD Index
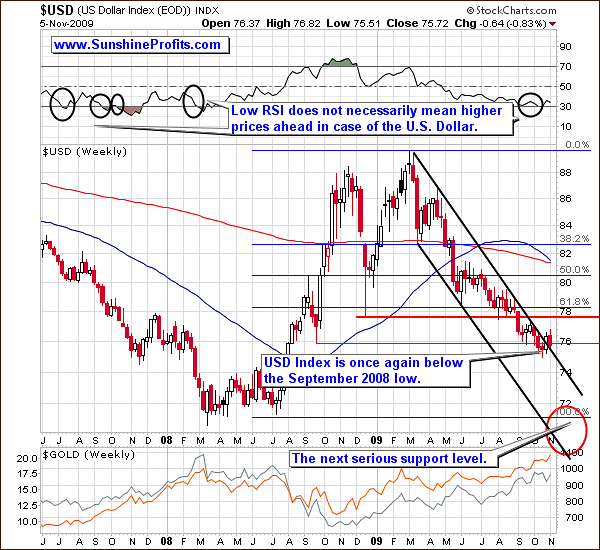
The long-term view on the USD Index has not changed much since last week in relative terms. The value of the U.S. Dollar is still very close to the upper border of the declining trend channel, so a rally is still possible from the technical point of view. However, let us not confuse what is possible with what is probable. In this case, the fundamentals and the strength of the trend make the following decline more likely than a rally.
If we broke out decisively - and only then - would the situation on the USD market look bullish. The key word here is "decisively" - the multi-month trend channel requires more than just a few sessions with USD closing above the declining resistance line, to invalidate it. Let's zoom in for more details.
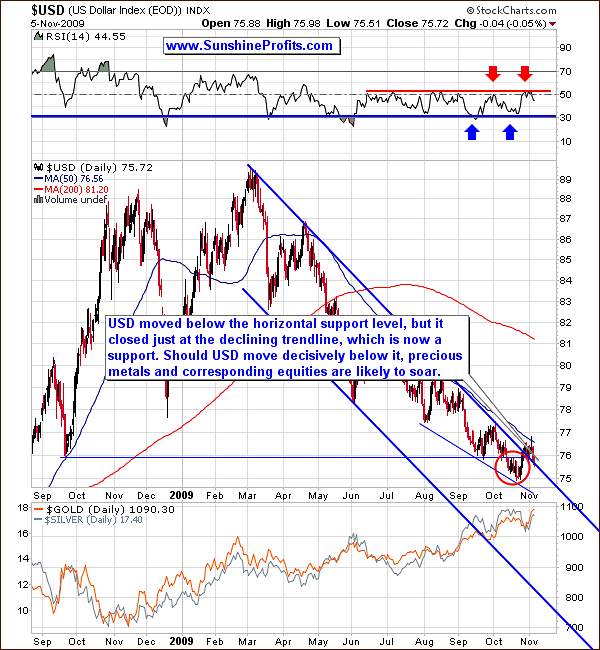
The medium-term chart confirms that the "breakout" has been barely visible, and that it is not a significant development - at least not yet. The previous breakdown below the September 2008 low has been verified by trading for a few weeks within the red-ellipse area, after which it moved once again above this price level. Yet, this rally did not take the USD Index very far - after an intraday spike on Tuesday, dollar moved much lower. The action in the RSI indicator suggests that a local top is behind us.
If we get a move below the 75.5 level - which I consider likely - it would serve as a non-confirmaton of the breakout, and that is a very strong bearish signal. Naturally, it would be a very strong bullish signal for gold. Given the recent strength of the yellow metal it seems that even if we would see USD rally from here, the only thing it would cause gold to do is to consolidate by trading sideways for some time. Going back to the USD Index itself, please take a look at the short-term chart below.
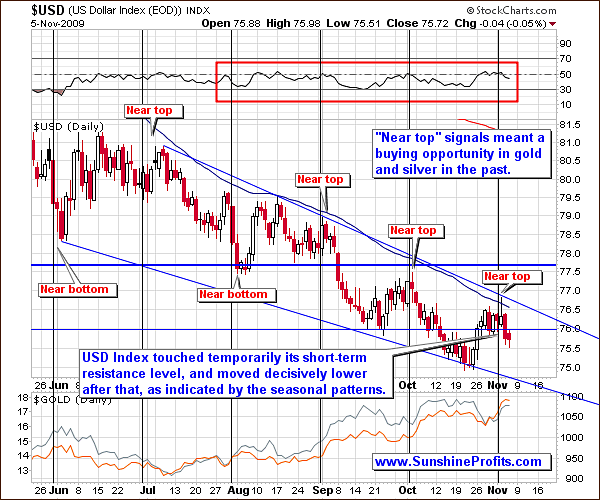
The short term chart reveals that the Tuesday top materialized almost exactly on the day that was indicated by the seasonal pattern (marked with the black vertical line) and it took place just after touching the short-term resistance level. This means that the counter-trend "rally" phase is already behind us, and that lower prices are to be expected in the next several days (and probably also weeks).
Please note that the "near top" vertical lines have also marked favorable buying opportunities in gold and silver. These were not necessarily the exact bottoms in the precious metals, but they were close enough for one to be glad that they purchased PMs at that time. Since it was only a few days ago, it serves us as another factor pointing to the necessity of being already in the precious metals market at least (!) with one's long-term holdings.
General Stock Market
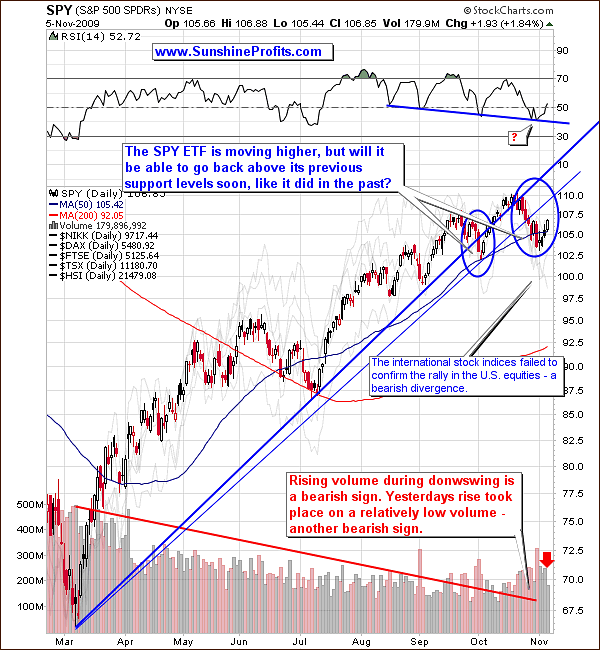
The SPY ETF (proxy for the general stock market, which allows me to analyze the volume) has failed to move above any of the rising trend lines. Moreover, the volume has been visibly high during the late-October decline, and relatively low during yesterday's rally. The Relative Strength Index appears to have formed a bottom, but that is the only thing that is bullish on the above chart - too little to make me state that a decent rally from here is the most probable outcome.
Additionally, several other main stock indices do not confirm this week's upswing in the U.S. stocks. As you may see on the above chart, I've marked the performance of other stock indices (Nikkei, DAX, FTSE, TSX, HSI) using the semi-transparent lines. Clearly, the action in these indices does not confirm the rally in the SPY ETF.
Don't get me wrong, I'm not suggesting that another rally from here is impossible - it is possible, but based on the above chart, and my experience - I currently don't view it as likely.
Gold
Gold moved rapidly higher and I believe that those of you, who entered the market on my recent signals are now happy that they did, as this investment/trade is already profitable.
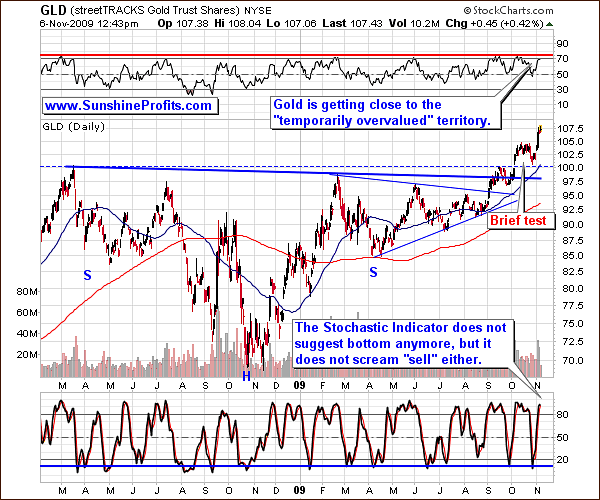
The Relative Strength Index is no longer suggesting favorable entry points, and it is even close to the 70 level, which generally means that a price is reaching a top, but it has not yet rached the red horizontal line that marks the key "sell" level. The Stochastic Indicator is above the 80 level, which is often referred to as the "overbought territory", but it didn't mark tops in gold immediately after moving above it. Conversely, Stochastic usually needed to stay above the 80 level for a few days/weeks before a top was in. Therefore, I don't view the recent action in this indicator as bearish.
If I had a dollar for every time that I've been asked "how high gold could go" in the past few weeks, and I used these dollars to buy silver, the white metal would also be above its 1980 high :-). The chart above is useful when timing local tops/bottoms, but since the move that we currently have is not a minor one (gold has just broken through the $1,000 barrier), we need to take a broader perspective to answer the above question.
Making detailed long-term predictions is particularly difficult, as the data that is available is rather limited. For instance, it is impossible to extrapolate today's sentiment into many months in the future. Still, there are technical tools that should provide us with insight as to what may be in the cards in the next several months.
First of all, please note that the long-term trend channel is no longer the major support/resistance level - gold did not reach it during the 2008 plunge. No wonder, since it is base on the whole bull market, whereas we've been in the second stage of the bull since 2006. In one of the previous essays, I've already explained why I'm using this date as the milestone marking the beginning of the second stage of the bull, but let me quote it also here:
That was the time, when gold broke out of its trading range in Euro and stayed above previous resistance long enough to attract new capital. One might argue whether this is precise time when the second stage of this bull market began (some prefer to think of the breakout date as the exact beginning) or not, but choosing this date has also additional advantage to our analysis.
Beginning of 2006 is also the moment when prices of precious metals reached important levels: $550 for gold and $10 for silver. Once these milestones were achieved, the price accelerated and peaked a few months later. Since then we have endured a long consolidation phase, during which these important milestones have been tested and verified as new super-strong resistance levels. That gives us reasoning for making the assumption that we will not see these levels breached to the downside in the near future - by that we mean at least the second phase of this bull market. Of course everything is possible in these volatile markets, but some events such as this one are very unlikely.
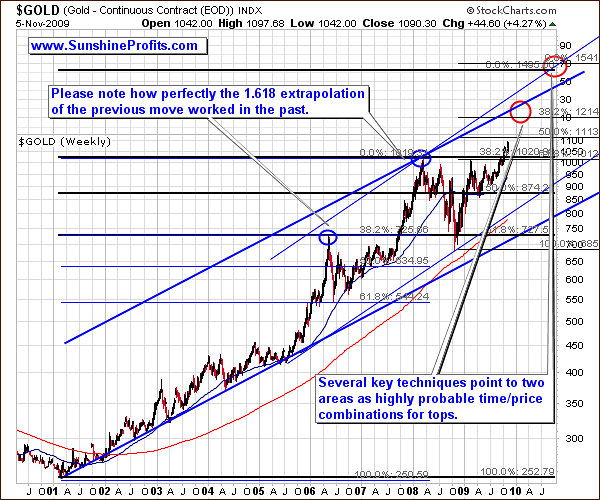
Therefore, the trend channel that we need to focus on is the one created by using the pre-2006-breakout bottom - I've marked it with thin blue lines on the chart. At this moment the upper border is at about $1,300 - clearly higher than gold is today. Still, it's not likely that it would be reached overnight, so we might expect gold to top even higher, probably along with reaching a resistance level of a different kind.
This type of resistance is provided by applying the 1.618 multiplier to the 2001-2008 mega-rally (black, horizontal lines), and it suggests gold topping around $1,500 - combining it with the previously mentioned trend channel gives us the top about a year from now.
Please note how well did this technique work in the past - the 2008 top was perfectly in tune with the 1.618 multiplication of the previous big rally (2001-2006). I've marked these levels with blue ellipses on the chart, and the multiplication is marked with blue, thin lines.
However, it is not realistic to expect gold to go $400 higher without looking back. Therefore, it is useful to look also for a topping area that is much closer to where gold is today. This type of time/price combination is provided by a similar technique, but on a smaller scale. This time it is the post-2008-bottom rally that I've multiplied by 1.618. The outcome close to the $1,200 level, which is relatively close to the whole-bull-market resistance line ($1,250), so we might expect gold to take a bigger breather after reaching the $1,200 - $1,250 area.
Does all of the above mean that the ultimate top will be a year from now on with gold at $1,500? No. It means that a meaningful top is likely to be put then, at that price, but that doesn't automatically mean that gold can't go even higher. The goal of the above analysis was to put the current rally in the proper perspective and let you know where it might end and how profound it is likely to be (based on the information available today). However, once we move to the third phase (the speculative mania) of the bull market, the rally will accelerate, and most likely shoot above the resistance lines marked on the above chart.
Moving on to the short-term part of the analysis, please take a look at the chart below.
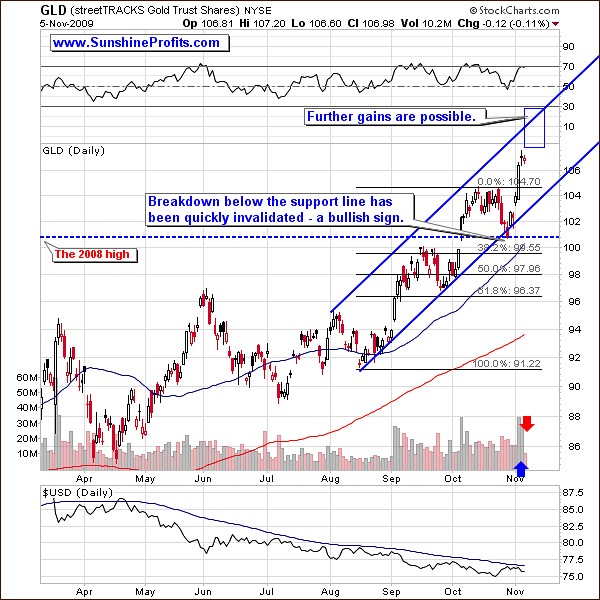
Gold rallied strongly, but it still has room for further gains - please take a look at the blue rectangle on the chart. The bullish confirmation comes from the action in volume. The volume was very high during the rally, but it was very low (in absolute and relative terms) during yesterday's small decline. This is the type of action that I would like to see during true upswings - contrary to the opposite action that would indicate a fake move also known as a "bull trap".
Additionally, gold managed to move much higher in the recent weeks, despite the fact that USD did not plunge yet. Please compare the performance of gold to the performance of the USD Index (in the lower part of the chart) and focus on the distance between price and the value of the 50-day moving average in both cases. USD is trading very close to its moving average (still in consolidation), while gold is much above its MA. This is another confirmation of strength of the yellow metal.
Silver
It was a week ago when I wrote the following:
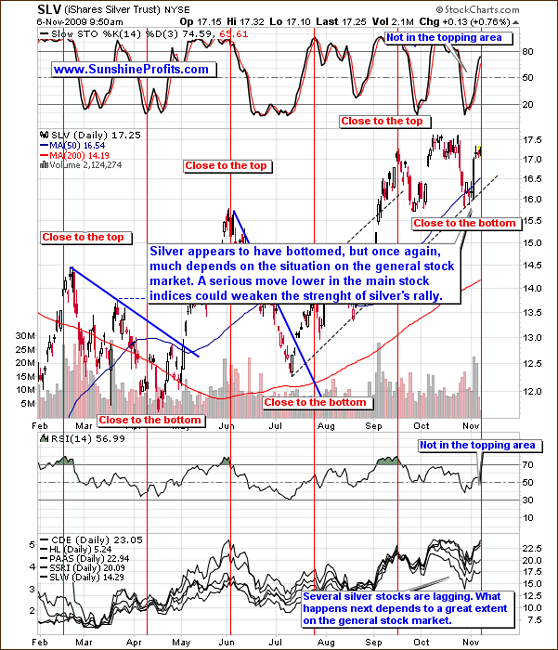
The reliability of the seasonal tendencies on the silver market is quite amazing - not only did the top materialize in the mid-September, almost exactly on the day it was predicted, but the price also rose on average up to the point where it was closer to the "bottom" part of the cycle. This pattern currently suggests that the next bottom will be put around the first days of November, which means that we are either behind one already, or are getting very close to it.
It seems that the bottom materialized a few days before the exact date marked with red horizontal line - thus it was indeed "close to the bottom". The action in the volume is just as positive as it is the case on the gold market, and both: RSI and Stochastic Indicator are not in the topping area. Several silver stocks are lagging their underlying metal but it seems that this is a temporary reaction to the weakness in the general stock market. Therefore, we will need to wait for a decisive action in either direction in the general stocks market, before making final calls here. For now, it seems that a sell-off in the main stock indices would cause the rally in silver and silver stocks to be weaker.
Speaking of precious metals stocks, let's turn to the chart of the GDX ETF (proxy for the sector)
Precious Metals Stocks
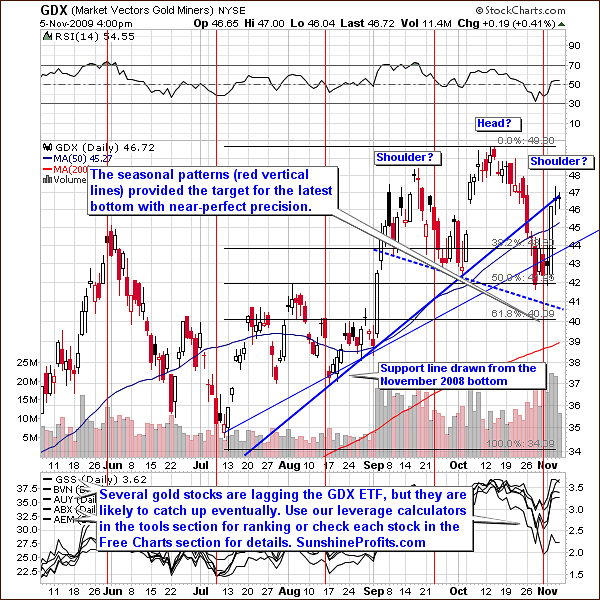
The precious metals stocks moved higher along with the rest of the precious metals market, but the shape of the rallies in the past two months may make you concerned that PM stocks are forming the head-and-shoulders top formation. I agree that the price pattern itself is visible, but I don't think that there is much to worry about. The head-and-shoulders pattern is formed when there is simply not enough buying power to push price to higher levels.
In the "head" part of the pattern the price fails to go much above the previous top, and in the final, third attempt to move to new highs, it doesn't even go above the previous (head) one. Since there is not enough buying power, the volume is lower with each upswing predecing a top (shoulder/head/shoulder). Without the confirmation in form of declining volume the whole logic behind this formation is flawed. That is precisely the case with the precious metals stocks, as this weeks rally took place on a huge volume - definitely higher than the one on which the "head" was formed. Therefore, I don't think that the head-and-shoulders pattern should concern you at this point.
On the other hand, the RSI is not overbought, so further gains are possible and likely. It seems that the bottom has been put exactly in tune with the seasonal tendency (red vertical lines on the chart), and higher prices are to be expected. The volume has been low yesterday, which is a natural during a small consolidation after a quick move. Several precious metals stocks have been lagging the GDX ETF lately, but I wouldn't worry about this situation, as it is normal, especially near local bottoms.
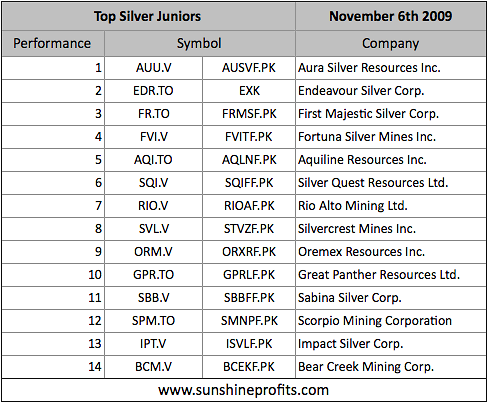
Juniors
As stated in the Key Principles section, the list of top juniors will be updated approximately every 4 weeks, so this is the Update that should contain the revised version of the list.
The tables below feature our favorite junior stocks at the moment of writing these words. For more information on how you can use these lists please refer to the Key Principles section, especially to the part dedicated to juniors.
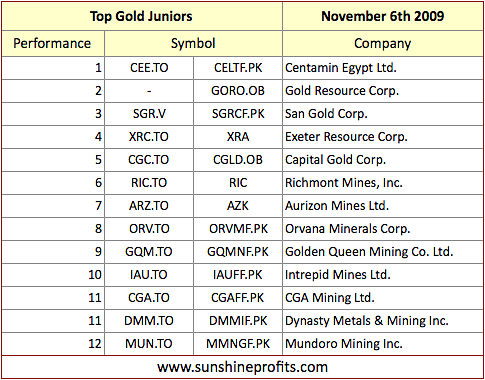
There are not many changes this month, and almost all companies featured last month are still in our top lists, meaning that if you purchased these companies a month ago, you still own stocks with the best (in my opinion, of course) profit potential. There was a particularly interesting action in Centamin Egypt Ltd. (CEE.TO, or CELTF.PK) since it was featured last month - it rose over 36%. The question is, should you dump the stock (as overvalued) or to buy more because of its recent strength. Generally there's nothing wrong with taking some money off the table, but the action in this particular company does not resemble a bubble - it's a steady (yet fast) growth that is in tune with company's previous strong performance. Therefore, I am not suggesting selling this stock at this point.
Other Information
As I already mentioned in the latest Market Alert, the results of the survey indicate that the "seasonal patterns" analysis is over 2 times more popular than the CoT analysis, so this is what I will focus on next. Thank you for letting me know about your preferences on that matter.
Speaking of improvements, if you have any ideas as to what you would like to see on my website, please contact us - we cannot guarantee that they will be implemented immediately, but they will all be taken into consideration. Just today we have received a letter from a Subscriber asking if we could update the correlation chart on a daily basis - (it has been already implemented in the form of the Correlation Matrix in the Tools section) this is exactly the type of suggestions that are particularly useful to us, to yourself, and to other Subscribers. For instance, we will be making improvements in the leverage calculators, and since we need to compile these programs anyway, it would be useful to add even more stocks to them while we're at it. So, if you would the leverage calculators to take into account also PM stocks that you are tracking, let me know what they are. I will review them (no juniors here, as their prices are too easy to manipulate on a short term basis for the statistical calculations to be reliable), and possibly add them to the leverage calculators.
There is one more thing that I would like to let you know about - if you wanted to upgrade your subscription to 90-day- or a yearly one at discounted price, but you were having problems with using the PayPal system, we have created a page to assist you. The page includes a video with detailed instructions to opening a PayPal account, and several links to pages with step-by-step guide to changing the credit card that is associated with a PayPal account - the most common problem is that individuals have "old" PayPal accounts with outdated credit cards, and therefore cannot use them.
Summary
The popularity of gold as an investment has grown in the past several weeks, but this fact by itself is not enough to turn the long-term outlook for PMs bearish. The price of gold is moving higher and central banks begin to accumulate it instead of dumping it on the market, thus invalidating one of the key arguments against holding the yellow metal.
The $1,000 barrier has been broken and verified and we are likely to see PMs much higher in the next several months, with gold likely to reach $1,500 within the next year or so. Therefore if I didn't have a long-term position in gold, nor silver, I would enter it now.
The short-term situation on the metals market is also favorable, although much - especially in case of silver and PM stocks - depends on the general stock market and the USD Index. The former is rallying, but there are many signs indicating that this is a fake rally. The USD Index moved lower and is likely to plunge once again below its long-term support level. However, we need to wait for this to take place to evaluate the effect that the following moves might have on the precious metals market.
This completes this week's Premium Update.
Thank you for using the Premium Service. Have a great weekend and a profitable week!
Sincerely,
Przemyslaw Radomski

