
One of the previous updates, in which I described several funds investing in the precious metals market resulted in many e-mail from readers, who wanted to know my opinion on their favorite ETF / ETN / mutual fund. I regret that I'm not able to reply to every e-mail that I receive (I do read them, and I appreciate your feedback - thank you), however since many of these messages contain questions about funds investing in commodities in general (for instance the RJZ ETF based on the Rogers International Commodity Index Metals Total Return), I will comment on this topic in this week's Premium Update.
Generally, funds are not a proxy for the physical metal (there are several exceptions, for instance GLD), but rather they are instrument based either on stocks or derivatives, mostly futures. This means that these investments carry additional risk with them, as certain regulations may apply during a financial turmoil. This goes double for the futures based ETFs, as it is relatively easy to change the margin requirement in order to prevent the massive increase in the price. Although the risk of that taking place right now is next to zero, but it's useful to keep in mind that it has taken place in the precious metals market not so long ago. I'm referring to the steps that the exchanges took during the spike rise in the price of palladium in 2000.
Back then, NYMEX increased the margin requirements several times to the outrageous level of $168,750 for a &72,400 contract - that's not a typo - one had to put much more money on the table than the contract was worth. Moreover, the the Tokyo Commodities Exchange froze trading for all palladium futures on Feb 24th without the possibility of taking delivery. So, investors, who owned palladium futures could not sell them, nor take their palladium in order to sell it, and consequently lost money when price declined.
I'm not writing that to cause panic - I just want to make a point that no matter how convenient using a fund may be, it still makes sense to take physical deliver of a part of your metals. Moving back to the commodities funds - since most funds are similar in terms of the asset classes that they use (mostly stocks / futures), if we want to compare the funds it would need to be between the detailed structure of their portfolio in terms of sectors / individual companies that a fund holds, or in terms of the leverage that a fund offers. The latter depends to a great extent on risk preferences of each investor, and the detailed structure in terms of individual companies varies to much to comment on it in general terms. This leaves us with the comparison of funds with regard to the sectors that they invest in. Therefore, commenting on ETFs / ETNs / mutual funds in general terms, will take form of a discussion whether or not precious metals are to outperform other commodities.
Precious Metals vs. Other Commodities
Before I present you a chart that shows how gold and other commodities performed during the late stage of the previous bull market, I would like to point your attention to the fact that PMs are generally the only commodity that investors can buy physically in large quantities (in terms of the value of the holdings). The space that is required is limited (compare that to crude oil for instance), PMs do not spoil when stored (compare to soybeans), no special permissions are needed etc. Naturally, the purpose of this comparison is to make additional comments on the commodity funds, so investor does not take the physical delivery anyway, but this unique feature of the precious metals market is important also here.
That is the case, because many investors want to keep their assets close to them - it's physical or nothing. This part of the investment demand can drive prices of only one part of the commodities market and that is the precious metals sector, mostly gold and silver. Please note that the third stage of the bull market is still ahead of us, and that is when the public will enter the market in a huge scale. I expect this to lead to the above-average increase in the demand for tangible investments, which would correspond to metals' outperformance.
Let's turn to the graphical comparison - the CRB index (commodities index) under-performs precious metals in times of secular bull markets, especially during its final stage. This can be observed on the below Gold / CRB ratio chart - this is what took place during the previous bull market.
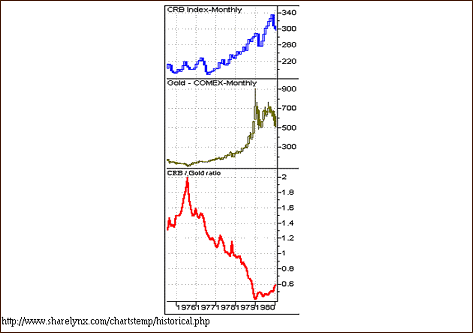
History tends to repeat itself (which is one of the most important principles of the technical analysis) and it doesn't seem that this time it's going to be any different. China, and other BRIC countries will continue to consume vast amounts of all commodities (including PMs), but gold and silver have many additional features and are considered as hedge against inflation / financial and economic distress.
The latter is a particularly important characteristic of the precious metals, especially with vast amounts of money being created out of thin air to cover losses of financial institutions, governments that increase their stake in the economy (not efficient in the long run), military interventions, not to mention the rising global political tensions because of the erosion of value in the U.S. Dollar.
From the precious metals sector only silver and gold have broader interest from public. Additionally, it was silver and gold that were the metals widely used as money for thousands of years, not other precious metals. This is confirmed by history - during the bull market 1970-1980 platinum rose about 1000%, while gold's and silver's prices rose over 20- and 30-fold respectively, and it would not surprise me to see even bigger gains in this bull market, with the proportions of gains (within the sector) being similar.
Summing up, while it's important to keep diversification in mind while constructing one's portfolio, and I don't think that it will hurt you to invest in the broad commodities-based indexes' ETFs, it may not be the best way to go. Don't get me wrong - I believe virtually all commodities will be priced higher in a few years, but I also expect metals to outperform. This means that gold-, and silver-based ETFs / ETNs / mutual funds are also likely to outperform other funds.
Gold and Crude Oil
Speaking of commodities, it is hard not to mention crude oil. This market has lost most of its popularity since it is no longer near $150 per barrel, but it still remains the world's most actively traded commodity, not to mention host of its uses. It is essential for both businesses and individual consumers, as fuels are derived from it. Most of us need to drive and purchase goods that also need to be transported to us directly or indirectly. Since crude oil is so vital to the modern economy, it should not surprise anyone that it influences many markets. Therefore, this week I will analyze this particular market, from the precious metals perspective.
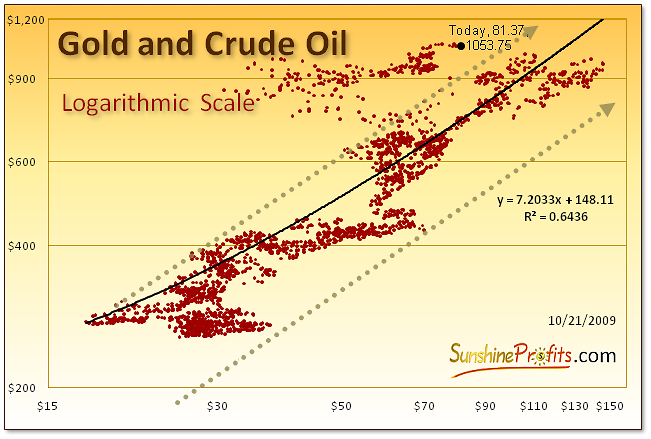
As you may see on the above chart, the price of gold/oil has been trading considerable above the dotted trend channel in the past few months. The reason was that most commodities were reacting to the deflation scare that was being hyped by the media about a year ago. Gold did not suffer that much. One of the reasons might have been that it was perceived as a form of money and during deflationary periods "cash is king". I'm not suggesting that we are in one right now -this is just a brief reminder of what was popularly heralded in the mass media. I'm not saying that this was done on purpose so that the powers that be could get away with printing more and more money, but that is definitely a food for thought.
Anyway, crude oil dropped much more than gold and the gold/oil price combination moved far from the trend channel on the chart above. Generally, prices sooner or later tend to reverse to their means, and this time is no different.
However, this time, I do not expect gold form a long consolidation while crude oil soars. To the contrary, I believe that the fundamental and technical factors are in place for a substantial rally in the metals. So, if the relative value of crude oil to gold is to rise, and go back to the previous trendline (it would mean oil at about $130 given today's gold price), I would see this process to take place by oil slowly catching up, in a similar way to what we see today.
Another possibility is that metals are going to take off regardless of the situation on the crude oil market. This is probable, but most likely will not take place untill we are in the third stage of the bull market - please keep in mind that this - as stated earlier in this essay - is what took place in the previous bull market - PMs outperformed other commodities.
As mentioned earlier, crude oil has many uses, but since transport is very crude-oil-dependent, high crude oil prices mean high (transport) costs for all companies. This means also mining companies. Higher costs translate into lower profits. Lower profits ultimately lead to lower stock values. Naturally, the same works also the other way around. Of course there are things like oil reserves and so on, but that fact does not invalidate the whole mechanism. It makes precious metals stocks react only to long-term changes of crude oil's price. On the other hand gold is the general proxy for gold stock's revenues. Since the HUI Index consists of gold stocks that do not hedge their gold production beyond 1.5 years, it is obvious that the price of gold has a direct influence on these companies' earnings and thus stock prices.
Based on the information from the previous paragraph, one might infer that the Gold / Oil ratio should trade rather in tune with the HUI Index. After all, both: higher gold prices and lower crude oil prices mean higher Gold / Oil ratio. Please take a look at the following chart for details.
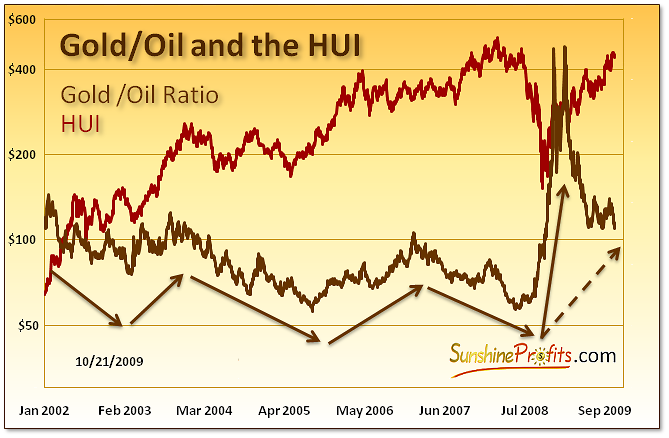
As mentioned earlier, high crude oil price translates into high costs, which leads to low profits and thus low stock prices. The key question here is how high is "high enough", which means that we need to put the moves in the gold/oil ratio into historical perspective before making final calls.
Generally, the HUI Index has been rising rather consequently (that is until the 2008 plunge), while the Gold / Oil ratio has been declining during that time frame. However, once one focuses on the changes in the direction of both lines, ratio's influence becomes visible. From the long-term perspective one can see that gold stocks were rising, consolidating, rising, consolidating, and so on. What is interesting here is that the consolidation in the gold stock sector took place when the Gold / Oil ratio was declining. Conversely, during Gold / Oil Ratio upswings, HUI rallied.
Gold stocks rose after the dramatic upswing in the ratio in 2008-2009, but the ratio is now declining once again - does it mean that the rally in the precious metals stocks is over? I doubt that. The substantial rally in the gold/oil ratio that took place a year ago was an unprecedented even during this bull market and was very sharp. As such, it is normal to expect a correction to more recent price levels, and this is what we see today.
Moreover, if you consider the average length of each upswing in the gold/oil ratio, you'll notice that the sharp move alone is much shorter than the previous rallies, which is a subtle clue that the "rally phase" (dashed arrow on the chart) is not yet completed. When you take a look at the beginning of the rally - today time frame, you will notice that although value of the ratio is much lower than it was several months ago, it is still visibly above the previous low. In fact, if you take a look at the size of the previous rallies in the gold/oil ratio, you'll notice that the current rally phase (even after declining for a few months) is still the biggest one. This is bullish news for gold stocks, not bearish.
If the abovementioned pattern is to repeat in the future, one might expect gold stocks to move higher future. This may not happen right away, as the influence that is illustrated on the above chart works in the long term range of a particular move and the HUI Index will not necessarily follow the Gold / Oil ratio immediately. However, should the general tendencies remain in place, we can expect much higher prices of gold and silver stocks in the coming months.
Since the long-term situation on the metals market has been widely covered in the previous updates, and there are no changes in that time frame, this week I will focus on the short-term situation in the precious metals and related markets. Let's begin with the chart (charts courtesy of http://stockcharts.com) of the U.S. Dollar, as it is the key issue this week.
USD Index
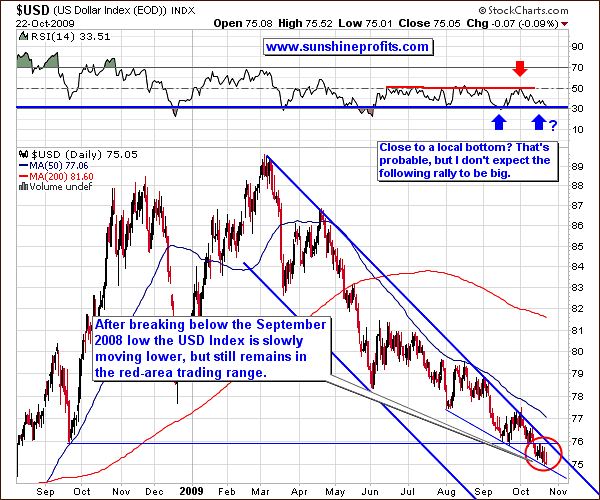
The U.S. Dollar is trading in the area marked with a red elllipse, as I indicated a week ago, but so far it is has been closing in its lower part, and consequently there was no visible downswing in the precious metals.
So far the USD Index is trading close to the 75 level, which is near the bottom of the marked area, which indicates that higher values - to the 76 level - are still probable in the near future.
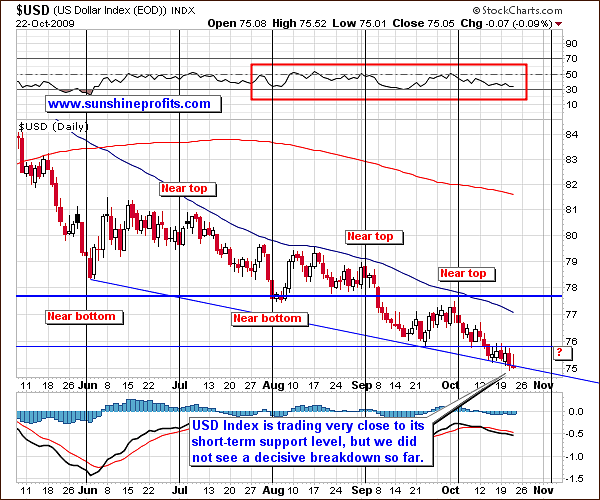
The short-term chart reveals that apart from the support and resistance levels that suggest that USD is to trade sideways for several days, there is one more interesting pattern that is worth analyzing. I'm referring to the short-term seasonal tendencies that have been in place in the past several months - I've marked them with black, vertical lines on the above chart.
The remarkable fact here is that since June, more or less the beginning of each month marked some kind of extreme on the dollar market. Most times it was bottom after top, and top after bottom, but two previous times marked local tops, so it is difficult to tell which of these two extremes is more likely to take place at the beginning of November. This, however, does not mean that this observation is totally useless.
As I stated earlier, once we decisively break below the 75 level, the value of the U.S. Dollar is likely to move much lower (possibly below the 72 level) as there are no strong support levels between these two values. Since there is very little time before the end of October, and USD didn't plunge yet, I don't expect the big move to take place this month. This, combined with the previous analysis implies that either a top / bottom is likely to take place near in a week or two, but it is likely to be a local one. By that I mean the price action similar to what we've seen in the last weeks of September.
Therefore, if it is a local bottom that is to take place, it means that a small rally would follow, that would ignite a correction in metals - meaning that a local top in USD would be put several days later. If a local top is to emerge, then metals are likely to correct even sooner. Consequently, although it is not clear what is most likely to happen in the USD Index, the implications for the precious metals are that they correct rather soon, or even sooner, which is in tune with what other charts suggest at the moment.
Gold
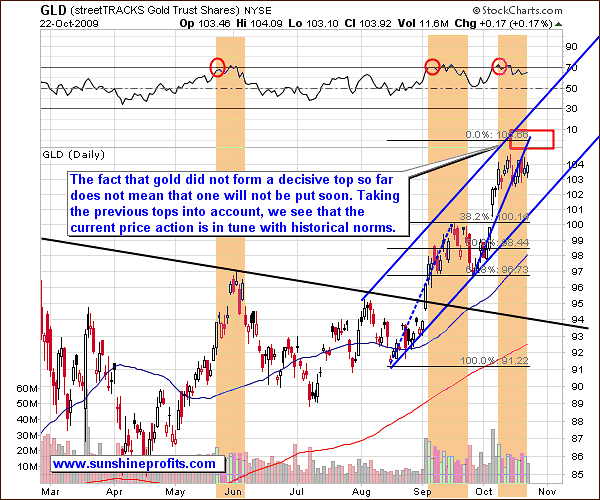
The situation did not change much since the previous week. We are still in a trading range after a significant rally, and I still view the short-term correction after a brief rally as the most probable scenario for the following weeks. The red-rectangle marks the probable topping area. It is based on the size of the rally predecing the September consolidation, and the Phi (1.618) multiplier used on it.
The question that I'm often asked recently is how low would the correction take us. The answer is that although the September correction did confirm the breakout, the size and significance of the move suggests that a one more re-test of the previous high of $1,033 is likely, but nobody can rule out a decline to $1,000. The media buzz that was caused by gold breaking into four digits caused many momentum chasers to enter the market that don't want to stay in it for longer. As soon as the rally runs out of steam (for instance we will see declining volume during days when PM rise), they will dump their gold and silver positions thus igniting the decline.
The history often repeats itself, but even more often it rhymes, meaning that the analogy is not ideally precise, but is still present. This is why I marked the whole area, instead of focusing on just one point. Please note that the end of the right border of the rectancle is in the first days of November, which corresponds to the extreme (bottom?) level in the USD Index.
The dollar is in the lower part of its trading range while precious metals are likely to move a little higher before the post-$1000-breakout rally runs out of steam. Since the U.S. Dollar is one of the most important drivers of PM prices in the short run, the temporary effect a small upswing would indicate a decline in gold and silver, however that is not in tune with what gold chart is suggesting at the moment.
My best guess is that we may have a very quick (few days at most) drop in the value of the USD Index - below the short term support line, but it fails to close below that level for three consecutive days and once again rallies above this level to test the upper border of the declining trend channel. Should this take place, I don't expect the resistance - the upper border of the trend channel - to be broken. As mentioned in the previous essay, I expect USD to trade sideways before finally breaking much lower.
The abovementioned action would correspond to a decline after a brief rally in gold.
Silver
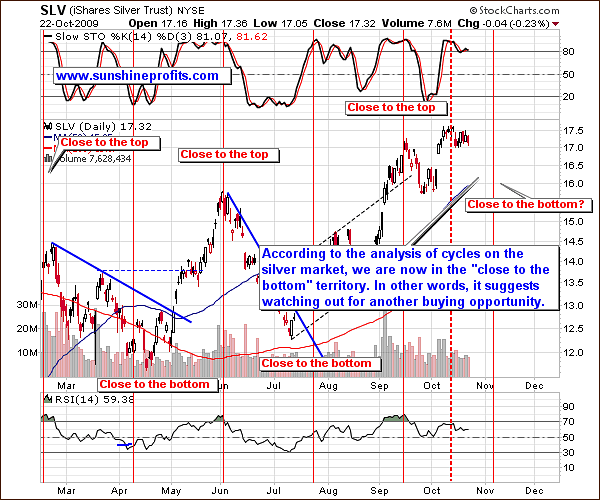
Silver is currently in a similar situation to gold. Silver moved substantially higher in the previous months, and a breather is to be expected. Taking into account the seasonal tendencies on the silver market (red vertical lines) it seems that we will see a correction rather sooner than later (not necessary today or on Monday).
The dashed vertical line marks the moment after which we are more likely to see a local bottom in silver than top, and we are now in the "close to the bottom" territory. This does not imply that we will not get higher on an immediate-term basis - it suggests that a bottom will take place, possibly after an additional rally. The particularly interesting thing is that the next vertical line suggests that a bottom might take place around the first days of November - which might as well mean that it will take place a week or so after that. This would be in tune with what I mentioned while analyzing USD, and gold - a brief rally in PMs and then a correction. Let's see if the similar thing can be said about PM stocks.
Precious Metals Stocks
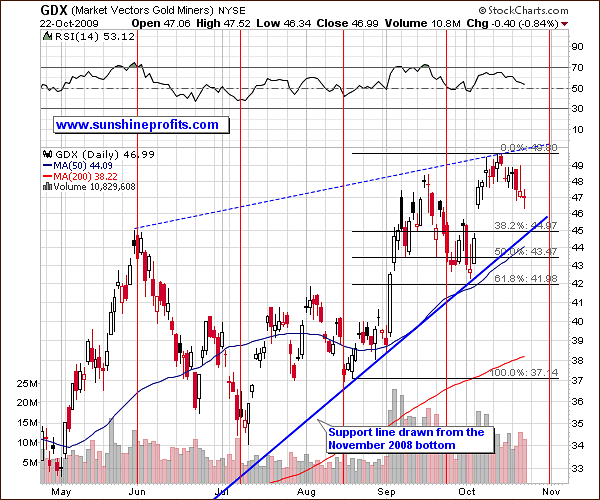
Yes, it can. The vertical lines point to turning points in a similar way they do on the USD chart, and the next one points to the end of October as the next turning point.
This suggests that in a few days/weeks GDX may trade either at $50, after a short term rally, or near the $45 level, if the correction takes place sooner. In the latter case, the brief rally that I mentioned several times in this update would most likely not take GDX to the $50 level before correcting.
Generally, the short-term situation in the precious metals stocks is quite complex at the time being, but the main point is that the $42 level (61.8% Fibonacci retracement level) is likely to hold as a support level no matter what happens in the next several days. If we get a brief rally from here (which I view as probable), possibly once again to the $50 level, the following correction might be stopped higher - at the $45-$46 area, depending on where the rising long-term support line will be at that time.
The small rally in the metals and corresponding equities in the short term has been signalled by the SP Short Term Gold Stock Bottom Indicator, which is particularly useful in timing brief (up to about 30 days) moves.
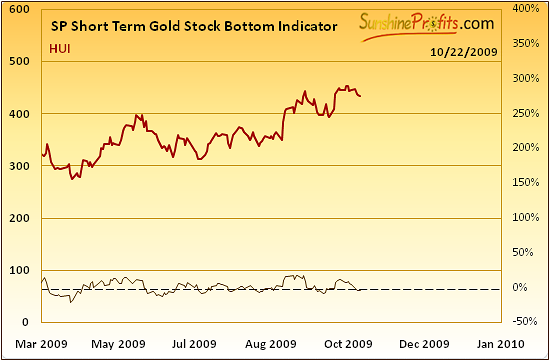
The signal was given after Wednesday's session (having broken below the dashed line, it turned up once again), so the odds are that we will see PM stocks move higher on a temporary basis, before correcting. Speaking of stocks, the final chart that I would like to present you this week is the one featuring the general stock market.
The General Stock Market
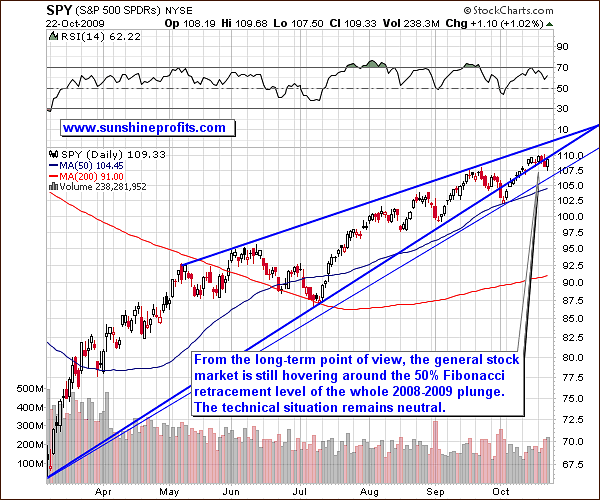
There is not much to say, as there has not been any decisive action in the previous week that would make the technical situation look particularly bearish or bullish. I decided to provide you with the above chart to assure you that I’m keeping eye on this market and that there are no signs of a plunge that would dramatically influence the precious metals.
Summary
Although many commodities declined sharply in 2008, we are still in the secular bull market in the commodities, and consequently I expect the ETFs / ETNs / mutual funds that invest in this market to do well in the future. Still, I expect precious-metals-related investments to outperform other commodity-related ones, just like it was the case during the previous bull market.
The most important commodity – crude oil – has also been hammered and - contrary to gold – did not pass it’s previous highs yet. Consequently, the gold/oil ratio rose significantly, which is a positive development for precious metals stocks, as gold determines their revenue and oil influences costs. With revenues rising faster than costs, the profits of mining companies are set to rise, and so are their share prices.
The precious metals market has been trading sideways this week, and points raised in the previous Premium Update are still relevant today. The most likely scenario for the coming weeks in my view is that gold and silver would move briefly higher and then correct the post-$1000-breakout rally.
This completes this week's Premium Update.
Thank you for using the Premium Service. Have a great weekend and a profitable week!
Sincerely,
Przemyslaw Radomski

