
I just love it when I run across an article like the one I just read in the Wall Street Journal this week.
The headline said: "Gold is Still a Lousy Investment."
I read it differently as: "Gold Still Has a Long Way to Go."
You know you've reached the top in a bull market when the shoeshine boys and taxi drivers who heard a hot tip are clamoring to get in. Two years ago when people in cocktail parties in Florida were talking about how you can't go wrong in Miami real estate, you knew it was time to sell. That's why an article like the one that ran last week in the respected, mainstream Wall Street Journal helps me sleep well at night with the knowledge that precious metals still have a long way to go.
The article, by Dave Kansas, suggests that "gold bugs" are driven by a fantasy doomsday scenario.
"Gold is the asset class of choice for those who fear grim tidings ahead" he says. "A collapse in the dollar. Runaway inflation. Civic upheaval. Some gold bugs talk of stockpiling seeds, bullets and canned goods."
I, for one, am not stockpiling seeds or bullets (though I have nothing against that, and understand people, who decide to do so), but I am certainly concerned about a collapse in the dollar and runaway inflation, all bullish signs for precious metals.
The writer admits that there might be a "whiff of possibility" to some of these fears. It's clear that the dollar is under pressure with some countries even calling for a new reserve currency. He acknowledges that the inflation fear also makes sense. He says, however, that despite the fact that central banks have dropped short-term rates nearly to zero and the financial system is flooded with money, he does not expect inflation any time soon. I find it particularly interesting, as it is precisely the countless numbers of fiat notes a.k.a. dollars, euros, pounds, etc. that are pumped into economy are the only thing that causes inflation.
"The enormous amounts of idle capacity -- from factories to workers -- make the elements of inflation tough to cobble together," he writes.
He concludes by saying that if investors are concerned about inflation they should invest in treasury inflation protected securities, or TIPS. And if the fate of the dollar is frightening, he recommends investing in international or emerging market mutual funds or exchange traded funds.
I have nothing against investing in the emerging markets, or using ETF's / ETN's (as far as trading is concerned), but I would like to point your attention to the fact that purchasing TIPS makes sense only if you believe that the inflation numbers are correctly representing the situation in the economy. Since I have a hard time believing this (as the way the inflation is measured has been changing and is currently - politely speaking - suspicious), and I think many of my Readers share my doubts about the reliability of the official inflation statistics, I also can't recommend purchasing TIPS.
Either way, as far as long-term investments are concerned, I still believe that a well-diversified precious metals portfolio is the best way to go. If this means that I am a "gold bug", then so be it.
On another subject, I know you must get bombarded by e-mails from financial newsletters that try to lure you to sign up for their service with some miraculous secret investment that will make you rich. By the way, I hope that you have noticed that we are different. At Sunshine Profits there are no gimmicks and there is no hype. Anyway, this particular e-mail touted a "gold play so powerful we stalked it for 8 months just to make sure it was real." Imagine, they said, that every time gold gains just 1% you make 2%.
The information they are peddling is publicly available and it is the case since the beginning of 2008, when investment vehicle started trading. They are talking about the DGP exchange traded note (ETN), which gains double the move in the price of gold. The twin of this ETF is DZZ, which goes down double the upswing in the price of gold.
I personally think the ETF's and ETN's are very convenient way to trade any markets. However, as far as long-term holdings are concerned (which means that you would put a lot of money into particular fund and keep it there for a long time), I believe the default risk involved is much more important factor than it is the case with speculation. Since ETF's / ETN's "add another layer" to the risk pyramid (and by that I mean that there is one more entity between you and the place where your money is), I prefer owning stocks and especially metals directly.
However, since ETFs, ETNs, and precious metals mutual funds might still be preferable way of being in the precious metals market for many investors, I have prepared a list of the most interesting funds that you might be interested in.
Exchange Traded Funds / Exchange Traded Notes:
- DBP - based on UBS Bloomberg CMCI Gold Total Return index. In short, this ETF's performance is a weighted average of gold's and silver's gains with the following weights: 80% gold and 20% silver
- DBS - based on the Deutsche Bank Liquid Commodity Index - Optimum Yield Silver Excess ReturnTM - it tracks the price of silver
- DGL - Deutsche Bank Liquid Commodity Index - Optimum Yield Gold Excess ReturnTM - it tracks the price of gold
- DGZ - 100% anti-gold, moves in the opposite direction to gold. Purchase if you want to profit on gold's decline (not recommended for most investors, as this means taking positions against the main trend)
- DZZ, GLL - like above, but these funds involve double leverage. In other words, if gold gains 1%, this fund loses 2%.
- GDX - 100% precious metals stocks, based on the GDM Index
- GLD, IAU - price of these funds reflects the value of gold owned by each trust
- SGOL - like above, but the metal is located in Switzerland. It started trading last month. Some analysts would advise you holding PMs in Switzerland only, while others suggest that if one believes that their metals will not be safe in London or New York, it probably won't be safe in Switzerland, either. My take on this discussion is that there's nothing like owning the real, physical metal, but if you still prefer other entities to hold it, please keep in mind the default risk of that particular entity. Nobody knows what is going to take place in the financial world during gold's peak, as these may be turbulent times. During such conditional, the risk of virtually any entity increases, and diversification between companies holding your bullion helps to minimize that risk. The geographical diversification also means lowering that risk. In other words, keeping a part of your gold holdings in Switzerland increases the level of diversification, which is good, as it lowers the risk associated with not owning metals directly.
- XGD.TO - It replicates, the performance of the S&P®/TSX® Global Gold Index, so it offers considerable exposure to Canadian gold stocks.
Mutual Funds
- PMPIX - aims to track performance of the Dow Jones Precious Metals Index (PM stocks) with the 1.5x leverage factor. It uses at least 80% of its capital to purchase equity securities contained in the index. In other words - it is in a way similar to GDX, but it involves more leverage.
- FSAGX - Fidelity Select Gold invests at least 80% in gold and gold securities - it is actively
- USAGX - USAA Precious Metals and Minerals is very similar to the above fund (at least 80% in gold and gold securities). Additionally, the remainder (capital not invested in PMs) may be used to purchase other natural resource stocks
- TGLDX - Similar to FSAGX, but not more than 20% of this funds total assets may be invested directly in bullion / metals themselves. Therefore, this is fund is more of a proxy for PM stocks, than FSAGX is.
- UNWPX - Again, this fund invests at least 80% in companies principally engaged in the exploration for, or mining and processing of precious minerals such as gold, silver, platinum group, palladium and diamonds. The difference here is that it invests at least 40% of assets in securities of companies that are economically tied to at least three countries other than the U.S. Therefore, it offers a considerable geographical diversification.
While the decision as to what investment vehicle one should use is one of the most important that an investor must make, the "when?" and "at what price?" questions are vital as well. Let's turn to charts (courtesy of http://stockcharts.com) for clues. This week I will begin with the USD Index.
USD Index
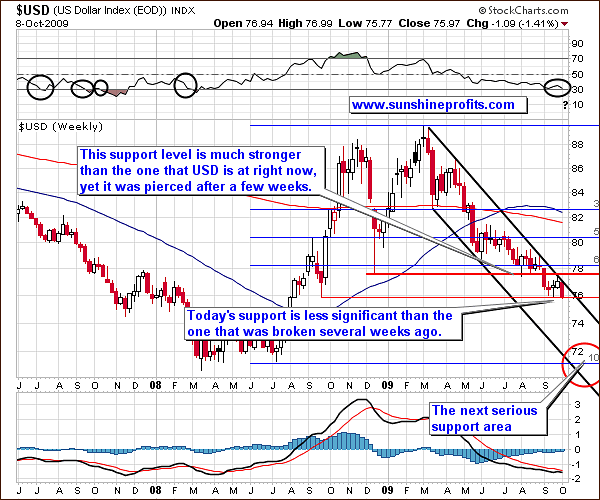
The weekly perspective on the USD Index provides us with a perfect view on how the dollar moved lower after touching the upper border of its declining trend channel. Since there were voices (certainly not mine) that this resistance level will be broken to the upside, the fact that USD in fact resumed its main trend is one of the important news this week.
The only thing that makes me more content with the current situation on the USD market is the way that gold reacted to this relatively small move, but I will get back to this later in this update.
For now, the support level just below 76 (created by the September 2008 low) has not been broken yet, but it is likely to take place soon, given the prevailing trend, and especially when one compares this support to the one that USD broke through several weeks ago. The December 2008 low (by the way, do you recall the Market Alert that I've sent on Dec 18th 2009, exactly when the low was forming?) was much more significant, yet it took only a few weeks for USD to go below it. Needless to say, it happened just after dollar touched the upper border of the declining trend channel.
This is exactly what took place last week, so it would not surprise me to see dollar lower soon. I realize that the RSI Indicator is currently near the 30 level, which generally means that an asset is undervalued, but please note that most times that this was the case in the past it meant further declines, not rallies. I have marked these situations with black ellipses on the chart.
The particularly interesting thing here is that once we go below the thin red line that marks the previously mentioned support level, we don't have virtually any other support all the way to the 71-72 area. This is obviously much lower than where USD is today, so the implications for the precious metals market could be huge, especially given the strength of gold's reaction to the recent move in USD.
Keeping the long-term bearish USD view in mind, let's take a look at the more recent time frame to check for any additional support lines that might postpone dollar's fall.
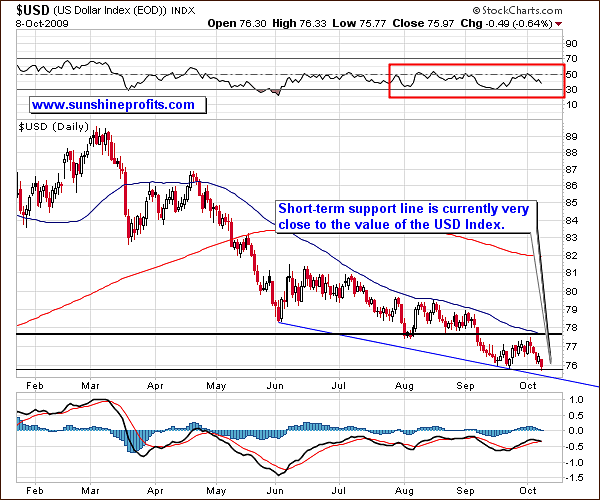
The only additional support level is provided by the thin, blue line, and it is currently slightly above the 75 level. This means that once USD goes below the current (black, thin line) support line, there is one more step that it may need to take before plunging. One of the following scenarios (that I currently view as likely) is that the dollar goes below 76 level instead of dropping sharply it will move sideways between 75 and 76 for several days or so. This action would confirm the breakdown below the September 2006 low and thus "fuel" the following sell off.
Naturally, this is positive news for gold and other precious metals.
Gold
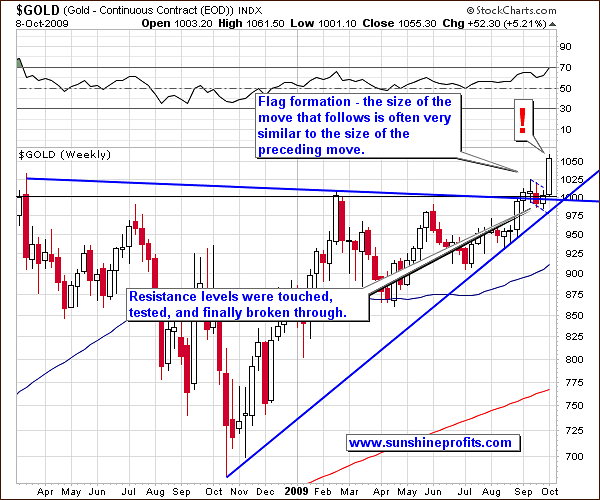
I've used the red exclamation mark as the description of this week's price action, as its consequences are very important. The message of gold above $1,000 goes throughout the worlds and many investors, who were hurt in the stock market, now begin to wonder whether or not precious metals might be a good way to go from now. This is exactly what a bull market needs to move higher - a new buying power. Even if one of the markets driving gold in the short term i.e. the general stock market, moves lower, I would still expect the $1000 barrier to hold as a support.
Should that take place, it will be the final call to go to the long side of the market and close any remaining short positions that you may have in the sector, as after that I expect gold to form a massive (!) rally. It's too early to say when we'll see another long-term top (I would like to see where the next local top is put, in order to make necessary calculations), but it is likely that the size of the rally will be somewhat similar to what we have seen in 2005/2006 and in late 2007.
As far as the first serious resistance level is concerned, the flag formation, which we have seen in the past several weeks, provides us with useful clues. Generally, the size of the move that follows this formation is very similar to the size of the preceding one. Let's zoom in for more detailed view.
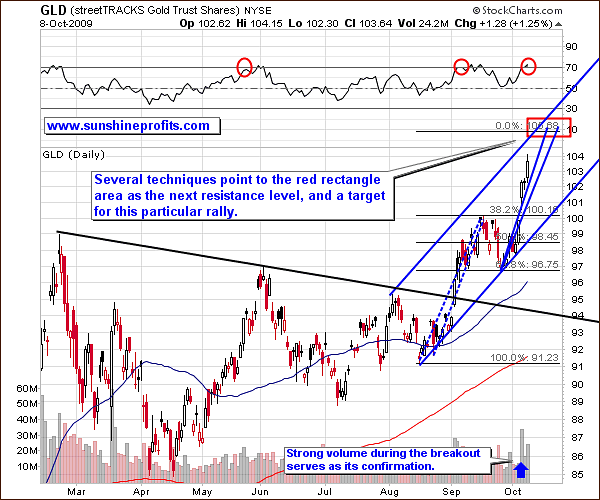
From the short-term point of view, we see that the initial assumption that the move following the flag pattern will be similar to the preceding one has several confirmations.
One of the ways that are used to estimate a target for a rally is to use the Phi (1.618) number and multiply the range of the preceding rally. The Phi number has multiple properties and uses. Nobody said that its only use in capital markets is to calculate retracement levels.
Since one of the amazing properties of this number is that 1 / 1.618 = 0.618, we can draw the target on the chart just like if the preceding rally was the correction of the move that is yet to materialize. I realize that this may be perplexing, however taking a look at the above chart should make it clearer.
Please note that the RSI is flashing the "overbought" signal, but taking a second look reveals that when it has done so in the past it mean that there is still room for gold to become even more overbought on a temporary basis.
Additionally, since the volume has been strong this week - taking particular days into account, it is obvious that the weekly volume will also be high, which means that the breakout above $1,000 is indeed significant.
As far as the similarity of the size of the upswings is concerned, I have created two blue lines that replicate the previous rally (dashed lines). Since it is difficult to tell which of the days beginning the previous rally was indeed it's true start, I decided to provide you with two versions. Both of them suggest a move above the $105 level in the GLD ETF; the difference is how fast this is to take place, but the target dates are only a few days away from each other. Either way, it seems that the current rally will take a breather after reaching the area marked with a red rectangle.
Before moving to the silver market, there is one more thing that I would like to point your attention to - the strength of gold's reaction toward dollar's decline. This week gold has already moved over 5% higher, while the USD Index, moved 1.41% lower. The reaction to dollar's weakness was multiplied over 3 times, which is a significant development. I realize that gold is MUCH more than the anti-dollar, but the multiplier of 3 is still impressive. It means that people simply can't wait to add to their positions, or even completely enter the market.
Silver
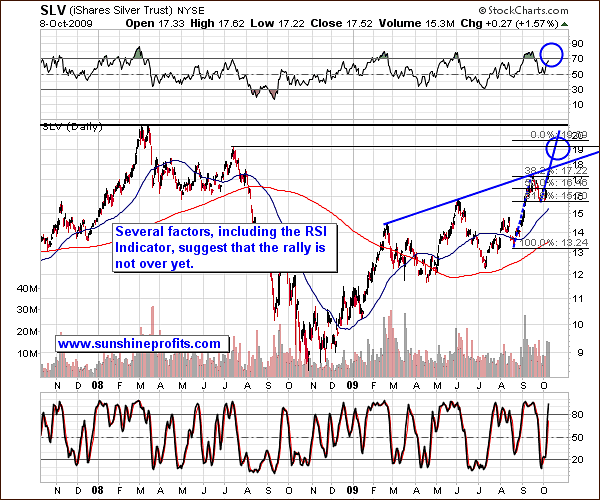
As mentioned earlier, technical analysis is a little less precise on the silver market, as it is smaller, and thus more vulnerable to large moves in either direction when one big entity decides to move in or out of the silver market, so estimating the size of the following move by using the flag formation analogy, might not be as accurate as it is the case with the gold market. In this case, the three tools that I've used in the same way on the gold chart, point to a much more wide area, which makes it less useful. However, in case of silver there are two additional resistance levels, namely two previous tops. The first one that I think has a relatively high chance of stopping the current rally is the July 2008 high of $19.17 (on the SLV ETF).
Either way, since the technical situation on the silver market is more complicated right now, it seems that the best approach is to watch analyze silver through other markets, the most important of them being naturally the gold market.
As I previously mentioned silver tends to outperform gold, during the final stages of a rally (the bigger the rally, the more visible - and useful - this phenomenon is). Since silver has been rallying strongly in the past few weeks, I believe it might be useful to analyze the silver to gold ratio.
Silver to Gold Ratio
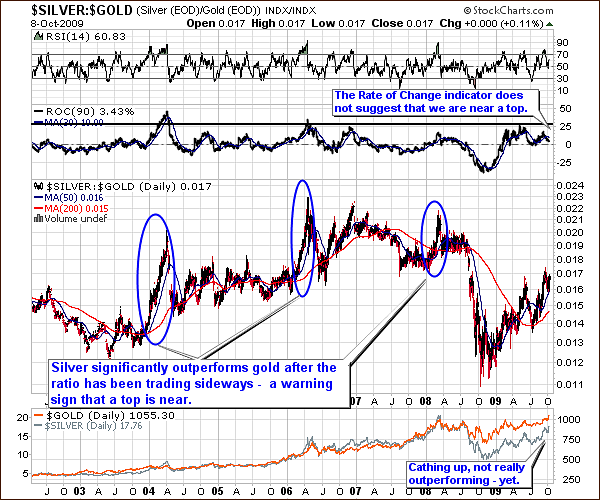
From the long-term perspective (and I believe this one is appropriate here, as we are analyzing long-term price moves), this chart does not have bearish implications. The rally in silver has indeed been sizable, but that is more of a catching up, than outperforming. The 2008 plunge took silver and thus the silver/gold ratio lower, and the white metal is still to recover. This process is under way, and the ratio reflects it.
Please note that the ratio has not been trading sideways before the current rally - it is still bouncing back after the 2008 drop. Another thing that suggests that we are not near a major top in the precious metals is that the Rate of Change (ROC) indicator is much below the 25 level. As a reminder, ROC indicator informs us how much the price of a given security changes in a given period, which is particularly useful in this ratio, as it is its momentum that should make one look for a top.
Platinum
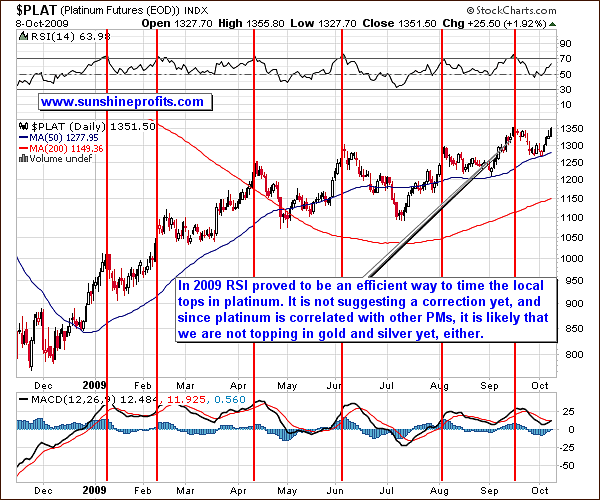
Another valuable tool that one can look at while estimating moves in gold is the analogy to the platinum market. Both metals are correlated, especially in the short term, so this technique should be particularly useful for timing local tops and bottoms.
In this case we see that the platinum market has been topping along with signals from the RSI indicator, and the reliability of this particular tool has been remarkable on this particular market. The reason that I mention this is that right now the RSI is not in the territory that signaled a top in the past, so it is not likely that we are currently at a top in gold and silver either.
The General Stock Market
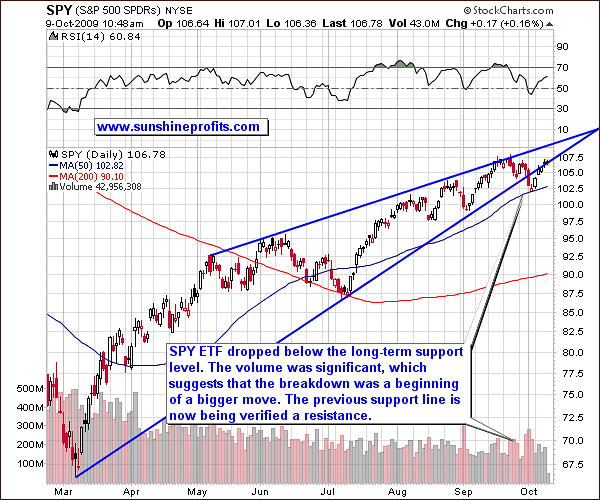
After the main stock indices moved lower, below their recent support levels, they bounced but so far did not manage to move above the blue rising line, which has turned into resistance.
The volume during downswing has been much higher than it was the case during the following rally during the last few days, so the main direction, in which the S&P goes next, is down. From the PM-Investors' point of view, if SPY ETF goes higher than it is even better, because in the recent past they have mostly moved higher together. On the other hand, should SPY decline, I would not be worried about a prolonged plunge because of that, more likely a re-test of the $1,000 level.
Speaking of stocks, let's turn to the situation on the GDX ETF, the proxy for the whole PM stock sector.
Precious Metals Stocks
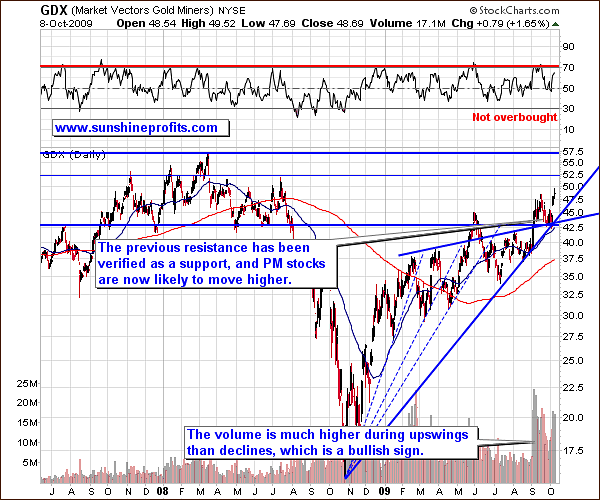
The situation in the PM stocks is similar to the situation on the silver market. We are relatively far from the previous highs, but given the recent volatility and strength of the market, it is likely that we will soon test (and then take out) both of them. The first resistance level that I think has a high probability of stopping the current decline is at the $52.5 level. It proved to stop rallies in November 2007, April 2008, and finally in July 2008, just before the big plunge. Either way, unless anything unordinary happens (I'll send you Market Alert, should that be the case), I believe that the currently rally has a big chance of taking PM stocks to the $52-$53 area, which would most likely correspond to the 70 level in the RSI.
Summary
As you may see, we are still long way (in dollar terms) from the top, as being "gold bug" is perceived as strange. Once we get to the point when NOT admitting to be one will be seen as faux pas, we will know that it's time to sell our long-term holdings. This is not what we see, hear, and read today, and it is not likely to be the case anytime soon.
As mentioned earlier, the general stock market has been lately less correlated to the PM sector, which indicates that if the main stock indices sell off dramatically, PMs may not follow, or decline modestly, possibly verifying previous resistance levels as support.
The whole precious metals sector looks at gold for guidance as far as the short-term moves are concerned. Based on several factors it seems that this rally will take gold, silver, platinum, and the rest of the PM sector a little higher before taking a breather. What happens then depends to a large extent on what takes place in the USD Index and on the general stock market.
Currently, it seems that the USD will move lower but it may take at least several days before the plunge accelerates. This would correspond to the abovementioned action in PMs.
This completes this week's Premium Update.
Thank you for using the Premium Service. Have a great weekend and a profitable week!
Sincerely,
Przemyslaw Radomski

