
As recently as seven years ago the private ownership of gold was prohibited in China. You could serve jail time if caught with any of it in your possession. Beginning in 2009, in a stunning about-face, the Chinese central government removed all restrictions. In fact, it's actively encouraging its citizens to purchase some gold, with China's Central Television, the main state-owned television company, running what in the West we call "infomercials," letting the public know just how easy it is to purchase gold and silver as an investment. Buying gold jewelry is also a relatively new option for China's citizens.
Banks in China sell gold and silver bullion bars in four different sizes. To make things easy for investors they have introduced small gold bars, commonly known as "little yellow croakers," suitable for personal investment.
China is sitting on $2 trillion worth of Treasuries and other foreign paper that is becoming worthless with each passing day. Concerned for several years about the increased rate of U.S. dollar printing, China has repeatedly called for the end of the use of the U.S. currency as the world reserve. The Chinese need to unload their dollars and one way of doing that is to buy gold, carefully, so as not to send the price soaring.
While back in the 1950s China had next to nothing in gold reserves, today gold accounts for two per cent of the total reserves held by China's central bank. China ranks 5th globally, just ahead of Switzerland and among the six nations plus the International Monetary Fund, that have reserves of more than 1,000 metric tons. The Chinese are frantically mining for more gold.
Thus China, which only yesterday was the lowest per-capita consumer of gold in the world, is preparing to become the biggest. Some analysts believe it will pass India - the largest consumer - as early as 2010. Clearly, the government believes the country will be stronger if their citizens hold some hard currency.
It doesn't take a genius in economics to figure out the implications of all this. If China's newly-formed middle class will begin to use even a small portion of their disposable incomes to purchase precious metals, a new powerful source of demand will exert its influence on the gold markets.
Let's consider some hypothetical numbers. If only a 1 of China's population bought 1 ounce of gold each that would be equivalent to a 250 million ounces, or roughly 3,500 tons. Last year's total global gold demand was 3,804 tons, so in this scenario it would mean a 90% increase in new demand.
The Chinese people are used to being told by the government what to do. If the government can control something as personal as the number of children a couple may have, then certainly the Chinese are more likely to act on a government decree than almost any other people on earth.
We have already begun to see the effect of this pent up potential of gold buying by Chinese consumers. In the August 22nd Premium Update we reported that China's gold market exhibited unique resilience while in the rest of the world demand declined. Mainland China's jewelry demand rose 6 per cent in the second quarter of 2009, the only major jewelry buying nation to record a positive rate of growth in volume, while its investment demand remained relatively stable.
All this could mean that gold is only in the second inning of a nine-inning bull market.
Before turning to charts for timing details, I would like to comment on one particularly interesting issue that has been raised over and over again, especially recently and that is supposed to have a very negative impact on the gold and silver markets - the Commitment of Traders Report.
Commitment of Traders Report
The general idea behind the CoT analysis is that large moves in gold / silver are triggered when large entities close their short positions on the futures market. The banks are generally net short very large quantities of metals and once they decide to pull the plug (close these positions at the same time), we get a sell-off in gold and silver. I don't want to get into details as far as the whole mechanism goes, as it has been already covered many times by my colleagues. Instead, I would like you to focus on the direct implication of this analysis - namely, when we see that the net short position is reaching an extreme level (based on historical norms), the risk of a sell-off rises dramatically - at least that is what analysts usually say.
Please take a look at the following chart (courtesy of http://www.chartsrus.com):
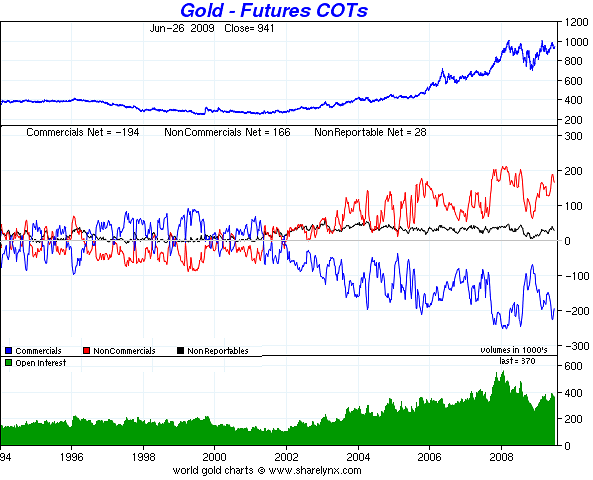
Generally, this is not the first time that the CoT is unfavorable, so it allows us to check what took place after the net short position of the commercial traders reached an extreme level. The interesting point here is that once we take a closer look it becomes visible that one would have missed the last two big rallies if one followed the CoT-is-unfavorable-let's-wait logic.
Currently, gold is after a multi-month consolidation and many factors suggest that it is now likely to finally move far above $1000 (I'm not talking about short-term here). In other words - a sizable rally from here is to be expected. The remarkable thing that is often overlooked in the CoT analysis is that since two previous huge rallies took place when the CoT was unfavorable. Therefore, it seems logical for one to expect a similar thing also here. Guess what - that is exactly what we see today. The latest CoT report shows that the net short position of the Commercial Traders has reached a new extreme. The popular interpretation is that a sell-off is inevitable, but such situation is precisely what we've seen near the beginning of the 2005-2006 and 2007-2008 massive rallies.
Trades based on CoT report were very profitable when PMs where stuck in their trader range before/at the beginning of this bull market (when silver was below $5), but I don't think they are as "sure bet" as they were several years ago.
My take on the CoT report right now is that although it used to be a very reliable indicator of the near-term direction in which the prices went a few years ago, its efficiency is now limited. The size of the open positions in the futures market is terrifying especially when one compares it to the yearly supply, or aboveground stockpiles (silver), but this is a favorable fundamental factor for gold and (especially) silver - and fundamentals tell you where a market is heading in the long term, not right away. Fundamentals are best used to decide where to put one's long-term holdings, not necessarily to time the market for short-term speculation. As far as timing the precious metals market is concerned - my experience tells me that there are more reliable indicators at this moment that the CoT report. If one wants to take CoTs into account, I would suggest putting their signals into perspective before making any investment decisions.
Speaking of timing, let's turn to the gold chart (courtesy of http://stockcharts.com) to see what may be waiting just around the corner.
Gold
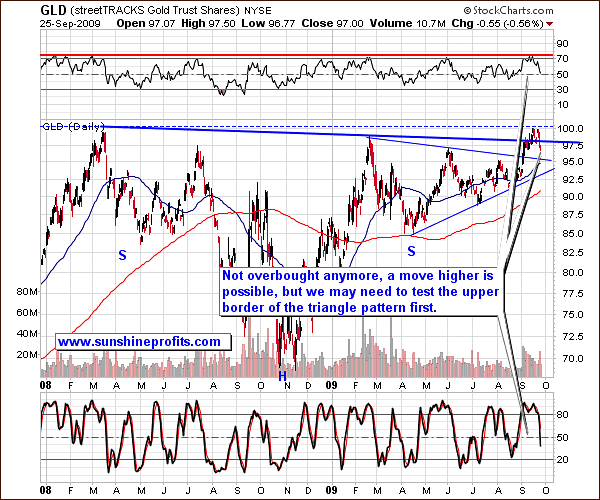
The long-term chart confirms what I wrote last week - that gold rose a little too fast for the rally to be sustainable. Consequently, we have now entered a consolidation phase. For now, it does not seem that gold will spend much time correcting the preceding move. It has closed several days above the long-term trend line (blue thick line on the chart above), so the breakout above it has been confirmed. The price of gold failed to move above the 2008 high so far, but once we go above it, we shall see some real action in this market, especially considering the high volume that accompanied the beginning of this rally. Things look promising, because every barrier below the 2008 has already been taken out. Anyway, a move lower to the upper border of the previously mentioned triangle pattern is not out of the question in the short term.
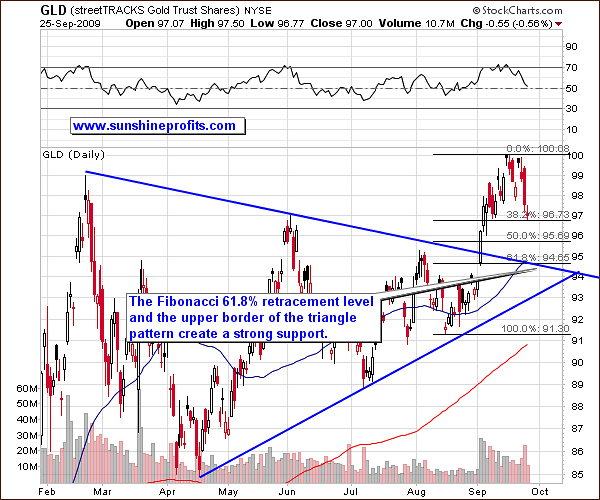
Short-term perspective provides us with more detailed view, and it mostly confirms assumptions made above. Gold is now at the first Fibonacci retracement level, just below $97 in the GLD ETF, which approximately corresponds to the June high. This is support level could hold gold, but the move lower, to the 61.8% retracement that corresponds to the declining border of the triangle pattern is even more likely to serve as a support here.
The final outcome of this situation depends on how situation develops on other markets, with the USD Index being the most important one at this point. I will get back to this market later in this update, but for now let's take a look at gold's little brother - silver.
Silver
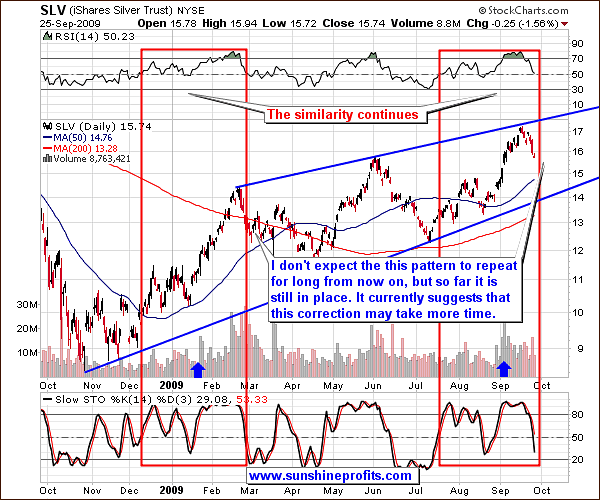
When I first mentioned the remarkable self-similarity in the silver market (red rectangles on the chart above), I knew that the pattern is an important factor when estimating the future performance of silver for the next several days at least, but it turned out that the Jan-Feb performance was a perfect roadmap for the whole September rally. This outstanding similarity has been a great indicator so far, but it virtually has to become less reliable in the future, as history doesn't repeat in every detail at all times - it "rhymes".
The current situation on the gold market suggests that the irregular (in terms of the ongoing self-similarity) is likely to surprise us positively. When gold breaks up through the 2008 high and verifies the breakout I expect silver to move quickly higher, even if the pattern suggests further consolidation. Still, for now it seems that silver may need to go lower before resuming its upward trend. Let's take a look at the cycles in the silver market for more timing details.
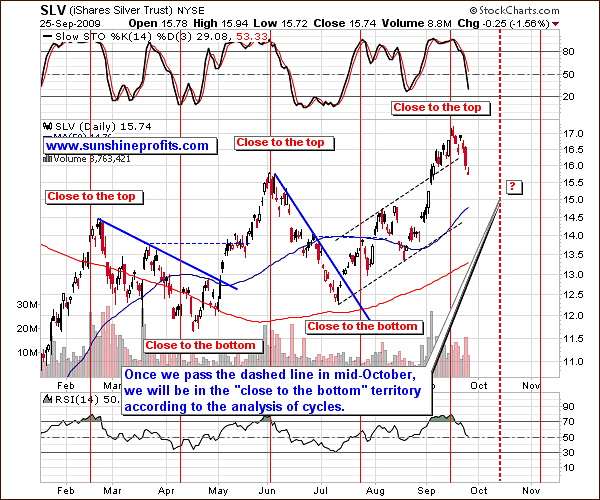
The recent top took place precisely on the target day according to the red vertical lines that I use to describe cycles on this market. Please note that signals have been much more accurate for timing tops than it was the case with bottoms. Since it is a bottom that we currently try to project, we need to keep in mind that (based on the past performance) the estimation may not be very precise here. Naturally, this does not mean that the whole analysis of cycles is worthless here, but rather tells us that if other methods of analysis suggest a looming rally, and silver is not yet at the red vertical "bottom" line, it does not necessarily revoke the bullish signal. "Close to the bottom" means that the bottom is likely to take place closer to the next vertical line following the top-line. In other words, one might expect bottom to take place at or after mid-October (as marked with dashed vertical line on the chart).
Precious Metals Stocks
The precious metals stocks move mostly in tune with the underlying metals and are right now correcting the previous rapid rally, just like gold and silver do.
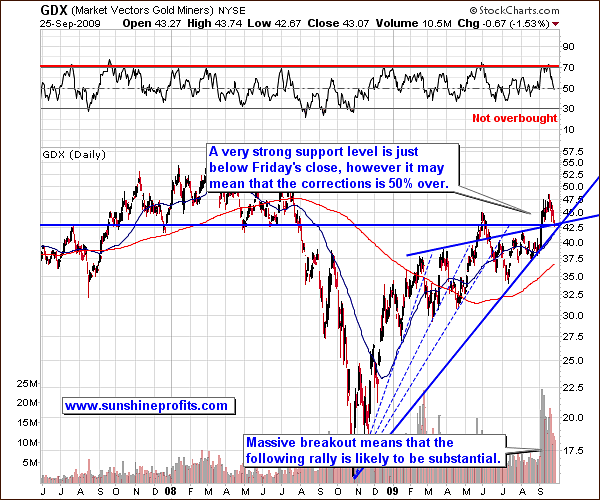
From the long-term point of view, it seems that the decline will be over rather soon, as the GDX ETF is relatively close to 3 long-term support levels. On the other hand, one of the support levels is the rising trend line drawn from the 2008 low, and such trend lines have been invalidated in the past. Moreover, they marked approximately 50% of the move to the downside. Both interpretations of the situation are exactly opposite to each other, so it will be particularly useful to analyze it from the short-term perspective.
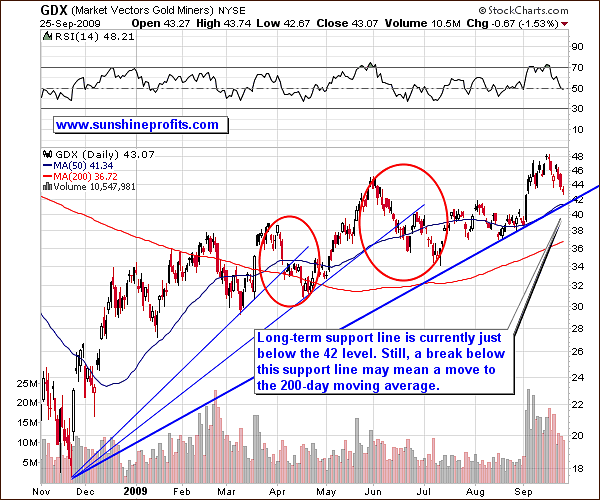
The short-term chart reveals that we are still slightly above the rising trend line ($42 level), so there is still room for a few days of lower prices before price reaches a support level. Consequently, even if the next few days are unfavorable for metals, PMs may stop declining around the $42 level in the GDX ETF. Additionally, one of the principles of the technical analysis is that a trend continues until there are evidence of a breakout / breakdown. The implication here is that the move just to $42 is still more likely than the breakdown below it.
Taking this move into proper context allows us to see that even if price does break below the rising trend line, it is still likely to reverse rather quickly and be higher than it is today in a few months.
On the other hand, the above analysis is also important to short-term Traders, as it provides two price targets for this decline: the $42 level, and the 200-day moving average, which approximately corresponds to the value that would be achieved if $42 was indeed the middle of the move.
The whole PM sector (including the mining stocks) has been recently moving along with the general stock market and in the opposite to the USD Index. It seems that the general stock market will need to correct the massive rally, but the situation on the USD Index remains bearish in the medium-term. The direction, in which these markets head next will determine also the action in the PM stocks.
Before I proceed with the analysis of the abovementioned markets, please take a look at the performance of PM stocks relative to the general stock market.
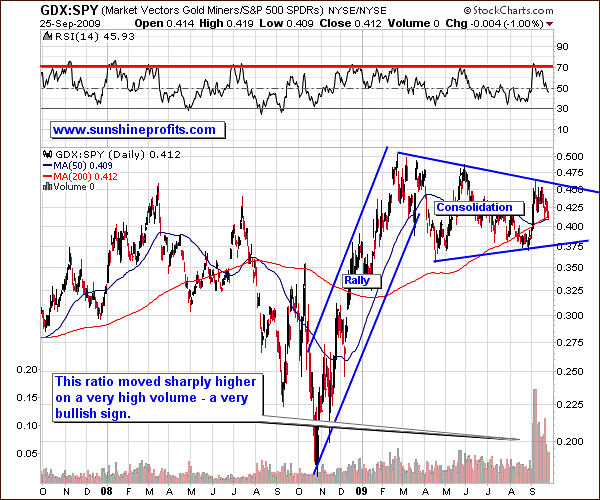
What we see above is a long consolidation after huge rally. This is really encouraging from the long-term point of view, as the rally that follows such a consolidation is often similar in size to the move that preceded it. If PM stocks manage to break out soon, we could see some real fireworks in the sector, for instance the GDX would equal the value of the SPY ETF. I realize that unless general stock market plunges, this means HUI above 800, but this is what the above chart suggests, and what I expect to take place sooner or later.
General Stock Market
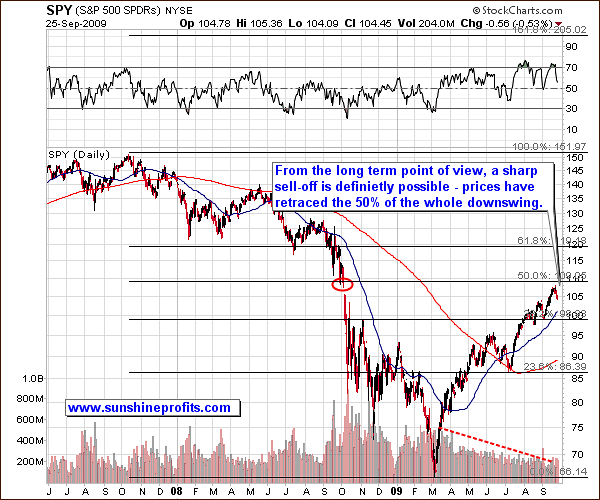
Moving on to the general stock market itself, we see that the price has moved very close to the 50% Fibonacci retracement level, which may mean that a top for 2009 is already in, but at this point I can't rule out a double-top formation.
Such situations occur when a lot of wealthy investors believe that price would go to a particular level, and they enter their sell orders just below this level to make sure that they get filled. Consequently, most of these orders get filled, but the remaining buying pressure is insufficient to move the price to the level that was originally supposed to stop the rally. This might have been the case recently.
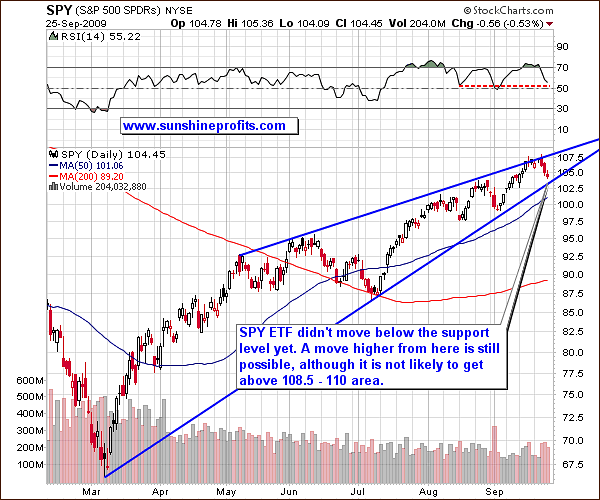
The short-term analysis confirms points raised earlier. The general stock market moved lower, but it did not break through the rising support line, so the trend still remains up. The RSI is very close to the level that signaled a local bottom in the past few months, so perhaps we will see another rally - a re-test of the 50% Fibonacci retracement level, as seen on the long-term chart.
Either way, it seems that a sell-off will materialize sooner or later. It is still unclear what medium-term consequences will this have on the PMs and PM stocks, but I expect to see signals in the correlation matrix, once the decline begins. In any case, it seems that the move in the general stock market would influence the move in the PM stocks - meaning that a move below the support line here, could cause PM stocks (GDX ETF) to go below the $42 level.
USD Index
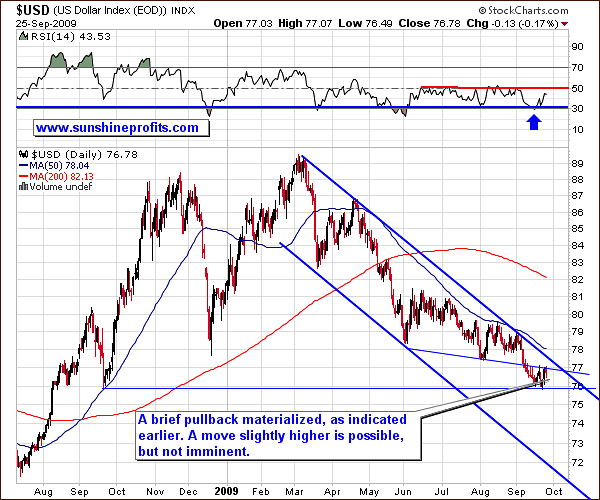
The USD Index is currently correcting the September downswing, and it might have already completed it, though this is not the most probable outcome in my view. There are several factors that make me think that we may move a little higher - above 77 but not higher than the 78 level.
The declining trend line (thick blue line) provides a solid resistance right now, and it has not been reached yet. Moreover, the breakdown below December 2009 low has not been verified yet, and a brief move higher from here would verify it. Last, but not the least, the RSI Indicator is not yet at the 50 level, and it was the level that meant the end of a correction in the past few months.
Summary
The Commitment of Traders report suggests that either a serious sell-off or a breakout above new highs is likely. Taking into account other factors and putting this analysis into bigger perspective suggests that the latter outcome is more probable.
The analysis of the USD Index suggests that it is likely to move a little higher from here, which would mean exactly the opposite action in the PM sector. The general stock market is likely to decline soon (after another small rally) or even sooner, but it is yet not certain how will PMs react in the short- and medium-term.
Two most likely scenarios at this point are: gold (along with silver and mining stocks) goes a bit lower to the upper border of the triangle pattern, or gold moves higher right away. The outcome depends to a huge extent on the dollar and the way PMs react to weakness in the main stock indices. The first factor is favorable in the medium-term, but suggests caution in the short run, and as far as the second one is concerned, I will let you know, once we have more information.
This completes this week's Premium Update.
Thank you for using the Premium Service. Have a great weekend and a profitable week!
Sincerely,
Przemyslaw Radomski

