
This week the price of gold hovered above the $1000 level and managed to close above this important level, a very significant and optimistic development for anyone interested in the precious metals sector. But before we launch into euphoria and speed away, now might be a good time to look back into our rearview mirror.
This past week marked the one-year anniversary of one of the most dramatic and turbulent weeks in Wall Street history. On September 15th Lehman Brothers, the 158-year-old Wall Street icon, filed for bankruptcy rocking the financial system to its core and sending shockwaves around the world.
In the days and weeks that followed credit markets froze, the stock market plunged, Wachovia and Merrill Lynch disappeared as independent entities, the government took a controlling interest in AIG, Congress approved a plan to spend $700 billion to bail out Wall Street, the Federal Reserve announced various programs throwing trillions of dollars worth into the economic crises and the American economy, and with it, much of the world's economy -- declined sharply into a tailspin.
The ensuing panic hit the global economy harder than the OPEC oil crisis of the mid-1970s, the loss of control over inflation in the late 1970s or the dotcom crash at the turn of the millennium.
Wall Street plunged and Main Street paid the price. The financial crisis had a devastating impact on regular folks with a jobless rate racing to 10 per cent (and many argue that this number is manipulated and the real jobless rate is even higher) and housing defaults mounting and more yet to come. Even today the mortgage crisis continues to worsen with more than 1.5 million foreclosures filed through the first seven months of this year. By mid-2009, roughly a third of outstanding mortgage borrowers were underwater - meaning they owed more than the value of their home -- and the number is growing.
While we're looking back, here is some interesting research to put things into historical perspective. Back in November, a researcher by the name of James Bianco crunched the numbers adjusted them to inflation and discovered that the government bailout cost more than - are you ready for this? - the Marshall Plan, the Louisiana Purchase, the race to the moon, the S&L crises, the Korean War, The New Deal, the invasion of Iraq, the Vietnam War and NASA combined.
The only single American event in history that even comes close to matching the cost of the credit crisis ($4.6 trillion) is World War II: Original Cost: $288 billion, Inflation Adjusted Cost: $3.6 trillion.
The government has spent most of the previous year trying to save the financial industry, rather than to transform it. In the short run, one could say that their efforts have succeeded. The economy has sidestepped a depression if one defines it as the plunge in the main stock indices. The problem is that the steps that were taken mostly meant printing more money into the system, which was the root of the problem in the first place. Excessive money supply caused by too low interest rates found its way into the real estate market driving prices to extreme levels. The corresponding creation of credit added fuel to the fire. The solution this time was pumping even more money into the system so that the economic problems subside temporarily while ignored the fact that they will be back with a vengeance in the future, most likely in the form of a massive inflation. It's like treating a cancer patient while ignoring the possibility of metastases.
On the eve of the one-year anniversary of the Lehman Brothers debacle President Obama told congress: "We have pulled this economy back from the brink." Tim Geithner, US Treasury secretary, told Congress last week: "The emerging confidence and stability of September 2009 is a far cry from the crippling fear and panic of September 2008." But, he added, "We still have a long way to go before true recovery takes hold."
Now let's take a look at how gold has fared in this turbulent year.
On September 19th , a year ago, the price of gold was $865. Over the past year gold proved to be an excellent hedge at times of economic distress, and bounced with a vengeance after dropping, along with virtually every other asset, due to margin calls. Contrary to the general stock market, gold is now much higher (and about to reach new highs) than it was back then. This fact is encouraging by itself. Combining it with positive fundamentals provides us with an even more bullish outlook. The only thing the PMs need to move substantially higher is a very favorable technical juncture. Are we there? Let's turn to charts (courtesy of http://stockcharts.com) for clues.
Gold
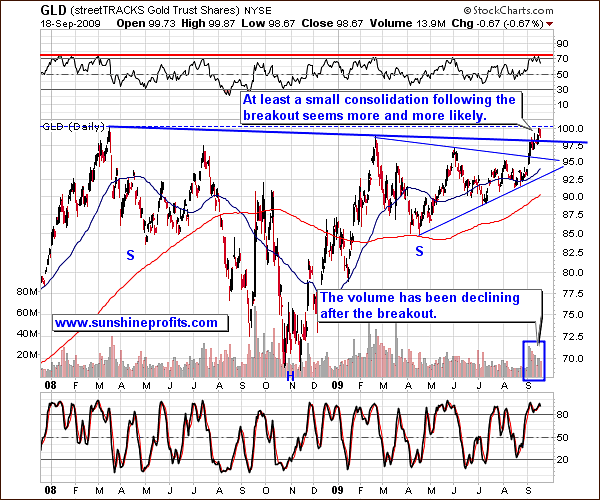
From the long-term point of view, gold is in a favorable situation, as it closed above the $1000 level during the last 4 trading days, confirming the move above that barrier. It hasn't yet pierced through the 2008 high, but I believe it's just a question of time, and in the not too distant future, before we see the yellow metal break higher.
The RSI Indicator was just at the overbought levels and is still near 70, which in the past was an efficient tool in timing local tops, so the odds of a decline from here are rather high.
Volume has been declining after price moved sharply higher, generally a sign that a rally's end is near. In this case I think a consolidation is the most likely outcome. Should consolidation indeed materialize, I expect the downswing to be stopped by either the horizontal blue line, just below Friday's close, or to the declining upper border of the previous triangle pattern - marked on the chart with thin, blue line. In other words, if it corrects, most likely gold will not go lower than $970.
Silver
Gold's volatile brother has been rallying strongly in the past several weeks, yet one must remember that no asset moves straight up or down.
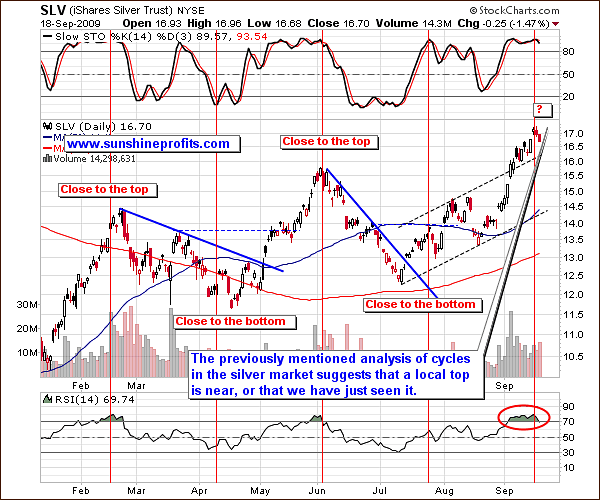
In the middle of August I mentioned a particularly interesting cycle visible in the silver market, which can be a profitable addition to one's trading tools. While it is not a crystal ball, especially with bottoms, the red vertical lines provide us with a somewhat reliable indication of when a market turning point may emerge. Back in August I used this analysis to show you that the rally is just beginning (which, happily, was the case), as the price of silver was trading close to the "bottom vertical line", not the "top" one.
The reason I'm returning to this analysis this week is that silver has just moved past the "topping line", meaning that we can expect a local top. We have indeed seen an immediate-term top on the exact day that this line signaled it, but it is not yet sure whether or not price will move higher once more before taking a breather. With the RSI at the overbought levels and going lower, it seems that they top may be in. Still, taking the size of the preceding rally into account, one may want to wait for additional confirmation before closing one's long positions - for instance a daily upswing on a very low volume. The more short-term oriented you are, the more I would suggest closing your long position in silver.
Since last week I featured gold in the non-USD perspective, this week I would like to do the same with silver.
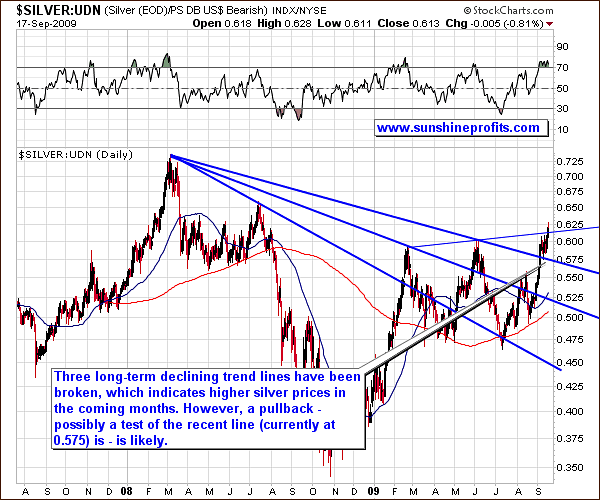
The price of silver from the non-USD point of view is less appealing because of the erosion of the dollar's value, however, this loss is less visible here than in gold - because of the leverage that silver offers.
Either way, the silver's technical picture from the non-dollar perspective confirms the regular analysis - silver has broken out of 3 declining trend lines, which is a long-term bullish development. However, since the rally was very rapid and has just reached a resistance level (rising thin line on the chart), a consolidation from here is likely. The Relative Strength Index also suggests that a breather is needed.
Precious Metals Stocks
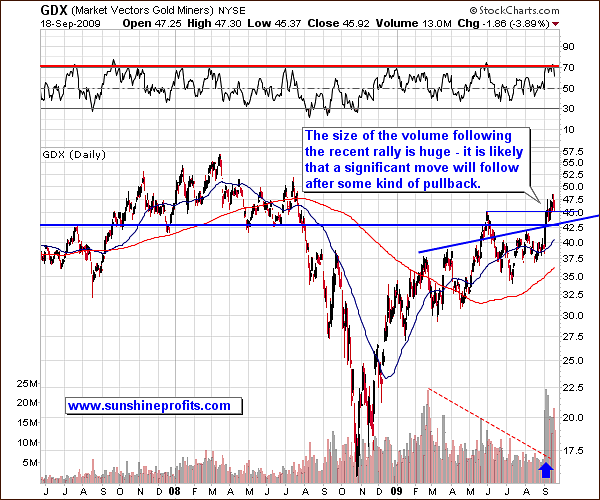
The first thing that comes into mind when looking at the above chart is the gigantic volume that accompanied the recent move in the precious metals stocks. It is really unprecedented in this ETF, so it intuitively suggests that this rally is somewhat different than previous ones. It is very likely that this marks a beginning of a substantial rally - most likely to new highs - but we will know for sure once the GDX pulls back, tests its recent resistance levels and verifies them as a support.
Given the rapidness of the recent rally and the fact that the RSI Indicator was just in the overbought territory, one may indeed expect PM stocks to move lower before they continue to rally toward their 2008 highs and above. Currently, it seems that a verification of either the $45.10 (June 2009 high), or the $42.50 level (corresponds to the thick blue lines on the chart) will take place before any significant rally.
Please note that the beginning of consolidation after the breakout in 2007 took place on September 21st, and late September in 2008 was the period when we saw a local top. So, seasonal tendencies suggest that we may not see much higher prices immediately.
Additional conformation of the above analysis comes from the Gold Miners Bullish Percent Index chart (a market breadth/momentum indicator that is calculated by dividing two numbers: the amount of gold stocks on the buy signal (according to the point and figure chart) and the amount of all the gold stocks in the sector).
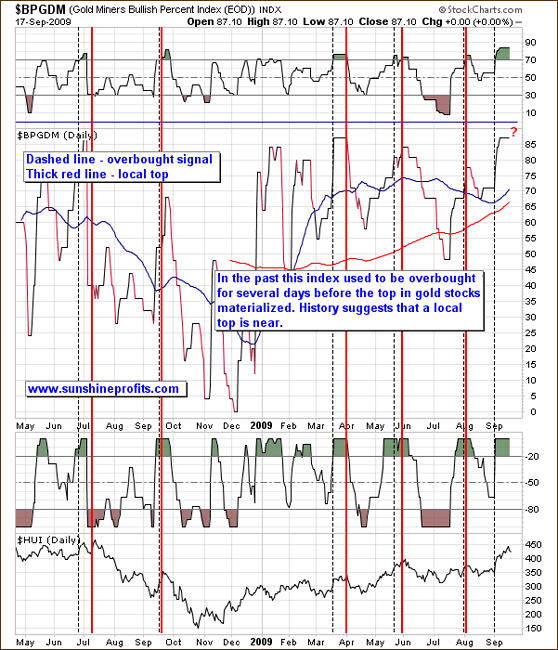
This breadth indicator, along with the RSI and the Williams %R, proved to be a valuable tool in the past.
Two weeks ago I suggested that the top might be near, but that I don't expect it to take place immediately after the breadth indicator signals it, since it usually takes some time. Two weeks have passed, sufficient time for us to consider taking action.
On the above chart I have marked both: "sell" signals from the breadth indicator (thin, dashed line), and the tops that followed (thick, red line). Please note that there was at least a small delay between these two lines, but it was not longer than 2-3 weeks. That is the case this time, so based on past performance of this indicator, a local top is very close.
Other Markets
It is said that whites lead yellow, meaning gold follows the price action in platinum and silver. Currently, the platinum market provides us with a confirmation of what has already been featured above.
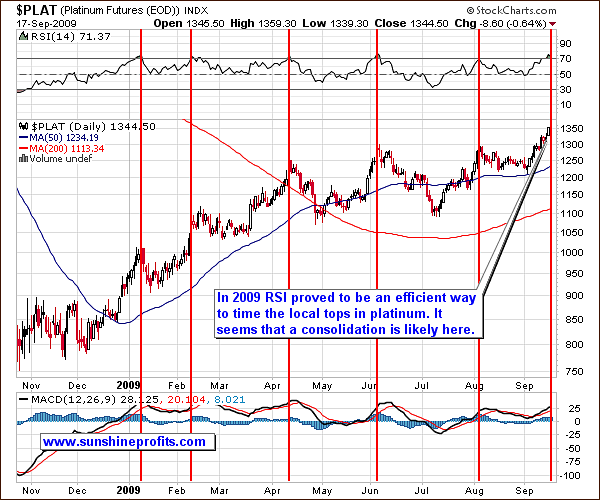
The RSI indicator has been correct in timing local tops / consolidations, so the fact that it is now suggesting one, should make you alert. The RSI indicator's performance has been so remarkable only in 2009, but it is still useful for trading purposes as long as it is combined with other reliable tools.
General Stock Market
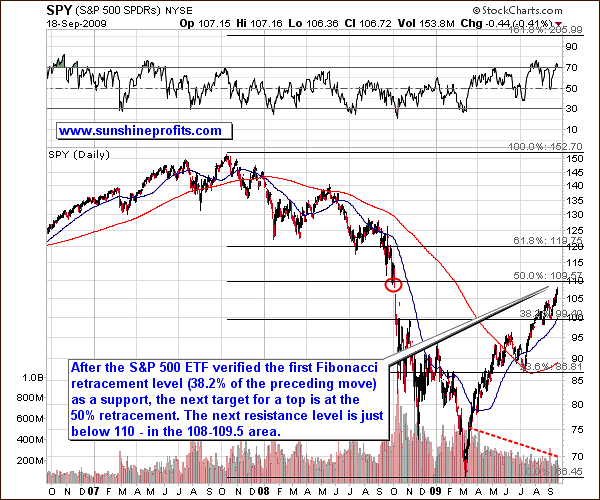
There are no big changes in my view in the general stock market - the rally has been very steep and consequently vulnerable to a correction. The 50% Fibonacci retracement level of the super-important 2007-high - 2009-low range should be taken seriously, especially that combined with the price gap that creates additional resistance level.
The area likely to stop this rally is 108 - 109.5 in the SPY ETF. The short term chart reveals additional details.
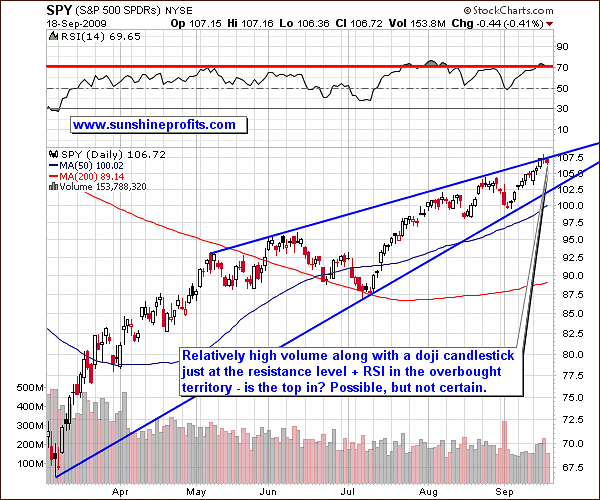
From the short-term perspective it seems that a top may already be in, as several short-term factors indicate. The doji candlestick that is often seen at the exact top (or bottom) formed on a relatively high volume on Thursday, so the implications are bearish.
Is the top in? Possible, but after such a big rally, I would like to see some kind of confirmation, before making any specific calls, especially that the long-term resistance lines are not much higher.
I recall substantial amount of bullish essays on the stock market in the mainstream media this week, which is a contrarian bearish signal. Another sign comes from the NIKKEI Average.
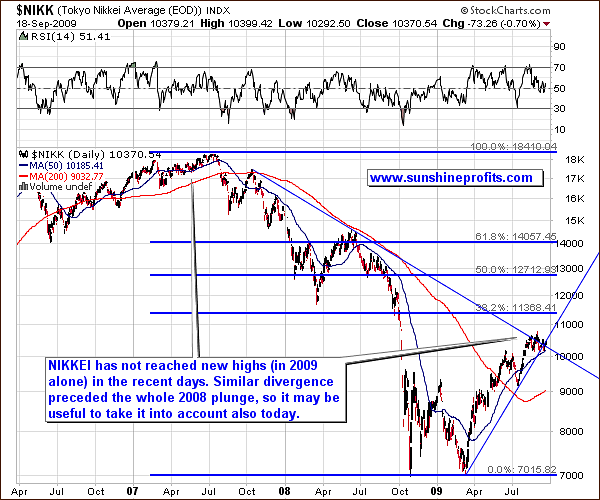
The divergence that should not be ignored here is the fact that NIKKEI has been decisively underperforming the American stock indices. This, by itself, is not necessarily bearish. However, once you consider the fact that it was also the case (to a much bigger extent) before the 2008 plunge, it becomes much more significant.
USD Index
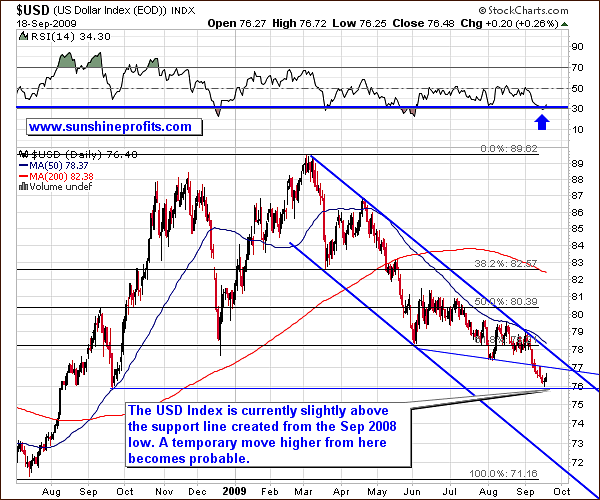
Contrary to the precious metals sector and the general stock market, the USD Index has been declining since the beginning of September and is now very close to a support level that stopped even a sharper decline about a year ago.
What is really intriguing is the fact that the 75.89 low that formed a year ago, materialized exactly on September 22nd. Taking into account the fact that history tends to repeat itself, and that similar events sometimes take place on the anniversary of the previous event, I would suggest watching the beginning of the next week closely. If you have an open leveraged speculative position in the PMs, a rally in the USD could hurt you. The RSI has just touched the 30 level, which in the past months meant that at least a small rally is near.
Either way, if we get a small rally from here, I doubt this move would take us above the 78 level - above the declining trend line that USD Index touched last time at the beginning of this month.
Summary
Gold managed to close above the $1000 level for 4 consecutive days, and also for the second week - very positive developments from the long-term point of view. On the other hand, it seems to be overbought in the short term and vulnerable to a decline or a consolidation. The same can be said about silver, platinum, and PM stocks. If gold (and corresponding markets) moves lower, it is probable (no guarantees, of course) that it would hold above the $970 level.
The general stock market is likely to correct as well, while the USD Index seems to be oversold at the moment, and charts point to a brief move to the upside.
The short-term Speculators may want to limit their exposure to the PMs in order to get back to the long side once prices have consolidated. Day-Traders may want to wait for the final signal in the form of a day when prices rise on a very low volume before exiting long positions.
The long-term Investors don't need to worry about this consolidation, as I don't think there are signs pointing to much lower prices. I currently expect gold to move much above the $1000 level in the following months. Of course, this may change in the future - and I will keep you informed. This week we looked back over a startling year, and we look forward to the challenges and opportunities ahead.
This completes this week's Premium Update.
Thank you for using the Premium Service. Have a great weekend and a profitable week!
Sincerely,
Przemyslaw Radomski

