
As gold touched $1,000 an ounce this week, I received several worried e-mails from readers about how changes in interest rates might affect the price of gold. Some are concerned that future higher interest rates might lead to lower gold prices, as was often the case in the past. Others are worried that higher bond prices might lead to lower gold prices.
I want to reassure my readers, both those who are afraid that gold is going to go down because of higher interest rates, and those who are afraid that it will dip due to lower interest rates.
My take is this: a move in interest rates in either direction does not necessarily translate into any type of action in gold. Lower interest rates are better, but higher interest rates are not necessarily a bearish sign.
A few years ago I researched the long-term correlations between various markets (including calculations for time series that would lag and lap gold up to 20 years), and found a very weak correlation between gold and bonds (thus interest rates).
Some argue that since interest rates have gone down, it must necessarily follow that gold prices will also go down. Over the last 100 years, this indicator has always been correct -- interest rates go down, gold goes down. There are analysts who predict lower gold prices from here - some even go so far as to suggest that the yellow metal might decline $150 soon.
Not very likely in my opinion...
First of all, for most of the last 100 years the price of gold was fixed, so most of the time it could not follow the value of anything. During the gold standard era, prices of goods rose and fell relative to each other, but if you buried your money and dug it out after 50 years, it would still buy you more or less the same amount of goods.
In the new era, when gold was de-linked from the dollar and became free floating for the first time in centuries, we see that gold is an excellent inflation hedge, maintaining its purchasing power over the long run. A World Gold Council study confirms that gold moves up when inflation goes up and falls when there is deflation. Please keep in mind that inflation is the increase in the prices of goods caused by the changes in the money supply - and lately smoke is coming out of the printing presses because they have been working overtime.
So the government is keeping interests rates down and is likely to continue to do so. One could argue that low interest rates are good for gold. Keep in mind that gold, as an investment, does not pay interest or dividends. So when banks and bonds also pay little to zero interest, gold becomes an attractive alternative investment.
The deflation-versus-inflation debate will continue to preoccupy economists. In any case, in a serious depression we can expect gold to hold its own better than other assets and in a period of serious inflation we can expect gold to take a moonshot.
With gold around $1000, I would rather worry about a possible speculative attack by some big outfit that could spark a significant move in either direction. For example, if some institution dumped many futures contracts on the market to trigger a rally or a plunge. Should that be the case, I would expect to see certain patterns in the charts that would flash a warning signal and, hopefully, I will be able to warn you ahead of time.
Speaking of charts (courtesy of http://stockcharts.com), let's take a look on the one featuring gold from the non-USD perspective
Gold
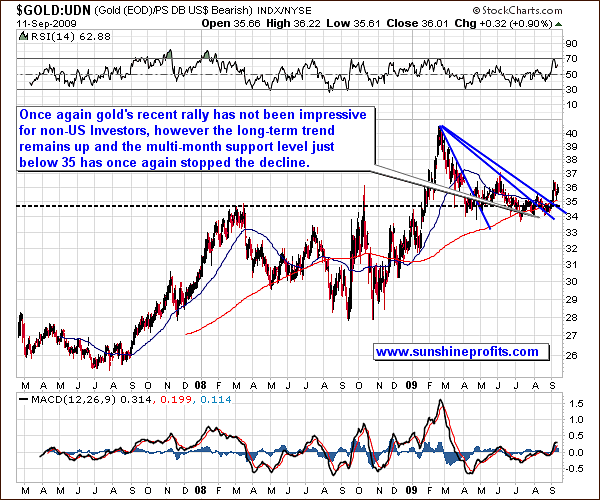
Here's a quick reminder of the ratio featured in this chart (price of gold divided by the value of the UDN ETF.)
UDN is the symbol for PowerShares DB US Dollar Index Bearish Fund, which moves in the exact opposite direction to the USD Index. Since the USD Index is a weighted average of dollar's currency exchange rates with world's most important currencies, we may use the gold: UDN ratio to estimate the value of gold priced in "other currencies".
Looking at the price of gold from the non-US perspective, you realize that there is no need to worry about the health of the gold bull market. The price of the yellow metal in the other currencies is not near its previous highs. But those investors who are concerned that there is no bull market in gold because it does not rise equally in all currencies can relax. For now, the fundamental situation of the precious metals market is stable, which means that the bull market is charging ahead. Besides, bull markets usually end when everyone and their brother and the shoeshine boys too, jump in causing a parabolic spike in the price. We are still far from seeing anything like that.
The gold / UDN ratio is quite bullish. It seems to have finally managed to move (and verify) above the support level at the 34-35 area.
Additionally, the three declining trend lines have been broken, a bullish signal indicating higher values of the ratio in the future.
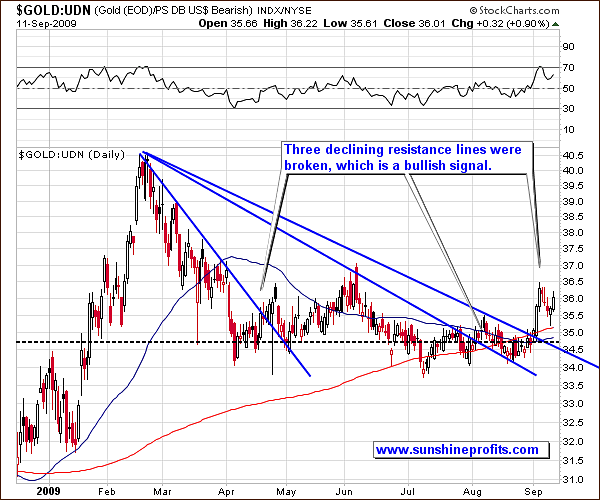
As you can see in the short-term chart, the breakout above the highest of the resistance lines was verified this week, as the value of the ratio touched its 200-day moving average, and bounced. The recent rally is much more visible in the gold(USD) chart than here, but the overall implications are bullish as well.
Summing up, although the value of gold priced in most currencies other than USD is not at its previous highs yet, it does not automatically mean that the bull market is over. On the contrary, I expect PMs to do well in the future regardless of the fiat currency in which they are priced.
As far as the value of gold in the U.S. Dollar is concerned, please take a look at the following chart:
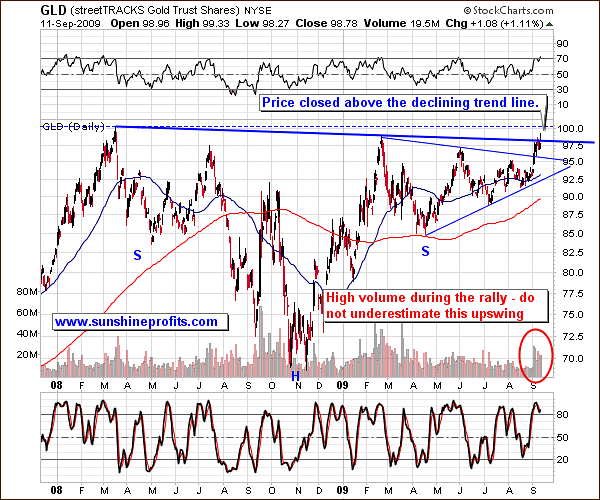
Gold closed above the declining trend line, an encouraging sign. Naturally, we will need to wait for a confirmation - three consecutive closing days above this level, or even better, three consecutive closing days above the previous high (marked on the chart with dashed line).
The volume is visibly higher than in the previous few months, which confirms the significance of the last-two-weeks' move. This is why I am not concerned about the overbought RSI, as I would normally be. The volume, the length of the previous consolidation and the seasonal tendencies - all suggest higher prices. The RSI is no crystal ball, although it is very useful during consolidation periods. Please note that at the beginning of 2008 it was overbought for the first time that year, but prices continued to rise much higher after that.
Silver
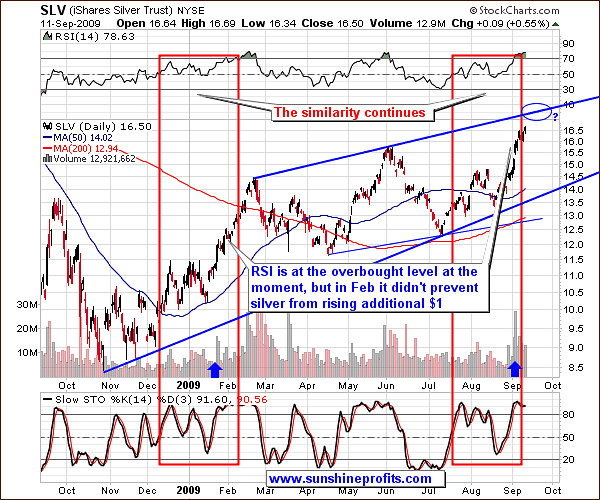
Please take a look at the two red rectangles marked on the chart. The price of silver continues to mimic its action in January- February of this year. Back then, when silver became overbought on the RSI indicator, the price nonetheless went up an additional $1. This could happen this time as well.
It would correspond to a local top at $17-$17.5 in the SLV ETF, also the level on the rising, blue resistance line. I marked the possible topping area with a blue ellipse. Should gold break above the previous high and verify this breakout, silver will likely also move higher increasing percentage-wise, at a faster pace than gold.
Precious Metals Sector
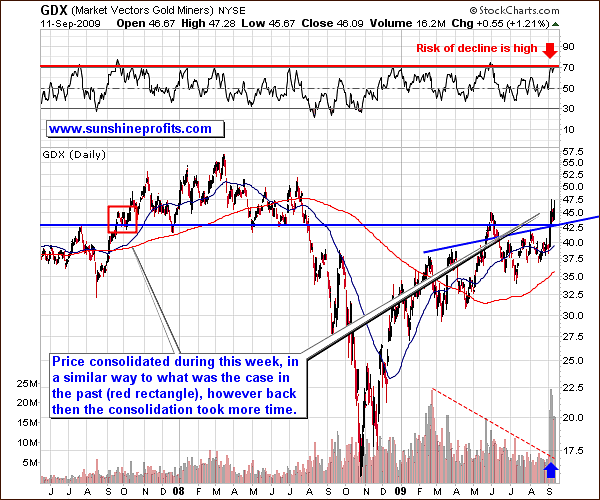
As is the case with gold, the PM stocks have confirmed their move higher with high volume. They broke out above two resistance lines in a strong fashion (because of the volume and rapidness of the rally), and are now trading above them. They are currently consolidating in a similar manner to a period in 2007 that I marked on the chart with a red rectangle. Back then the consolidation took place longer that is the case so far, so perhaps additional several days of a "breather" are ahead.
The RSI signals that the risk of a decline is high, but I have reasons not to take that signal seriously. Two things are not "usual" this time, volume and the amount of time the market took to consolidate before the move. Therefore, the simple interpretation of the RSI signal may not be the best way to go. Please note that the area marked with a red rectangle was also characterized by the overbought RSI, but still the GDX rose higher in the following weeks.
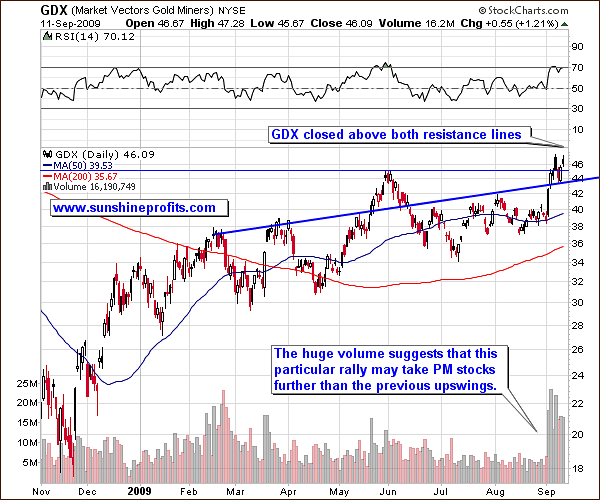
In the short-term chart, the breakout is even more visible and has been verified. The volume is substantial, and price of the GDX ETF moved briefly lower to test the previous resistance line and verify it as support. Apart from the RSI indicator, the situation is bullish in the PM stocks.
USD Index
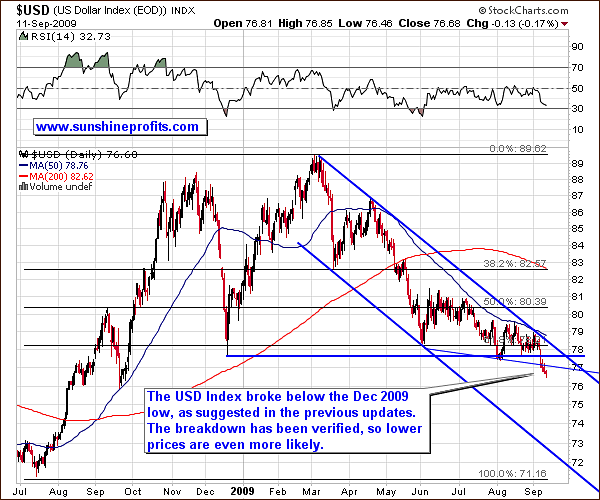
The USD Index, one of the key drivers of precious metals prices, has now broken below the December 2008 low, and below a minor support line (declining, blue, thin line on the chart). The trend was down before the breakdown, and in the previous Premium Updates I told you this was likely to happen.
The USD stayed below the support levels for a few days, thus making the recent move meaningful, but I can't rule out a re-test of the previous lows. This would mean a brief upswing above the 77 level. This could be negative for the PM sector, but if gold first verifies the breakout above the 2008 high, I would not be concerned about a possible sell-off.
The General Stock Market
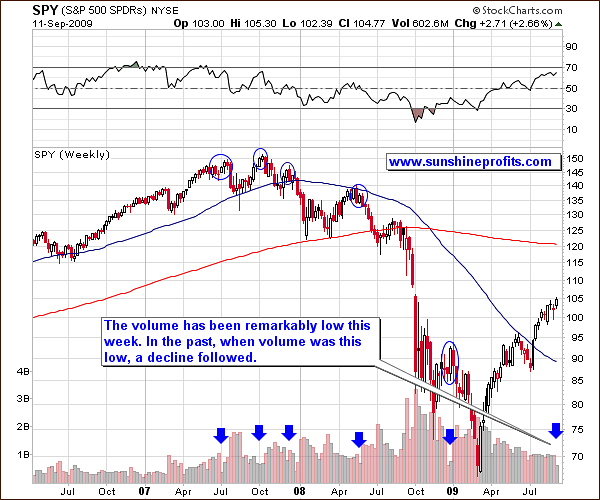
It's important that we take a look at the recent action in the general stock market. In the past I've mentioned that the volume in the SPY ETF is nothing to worry about since it was not yet low enough to indicate an imminent plunge.
That changed this week.
The volume is now about 603 million -- a very low value. There was no trading on Monday, so if we extrapolate the volume to the past Monday, we still get a relatively low value - 754 million, lower than previous weeks. It is not a "screaming sell" signal, but definitely a bearish sign.
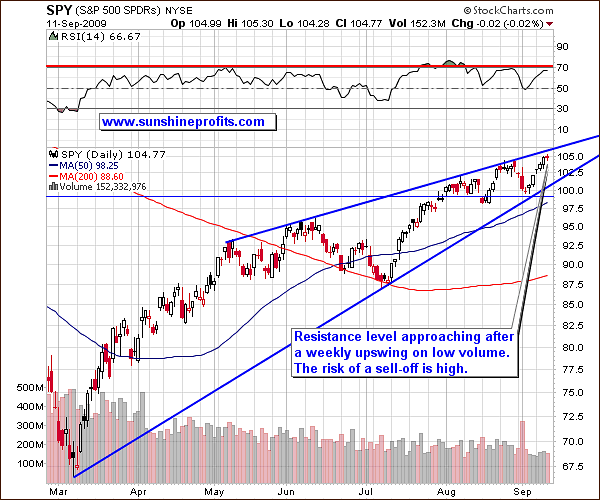
From the short-term point of view, volume has been lower this week when compared to previous weeks. Prices rose, but without a corresponding volume confirmation. This is something you see when you get close to a top, so I would be careful if I owned a lot of "popular stocks", especially now that the SPY ETF is approaching a resistance line.
The important question here is whether a sell-off in the general stock market would mean a similar sell-off in PMs and mining stocks. Let's look at our Sunshine Profits correlations matrix for some clues.
Correlations
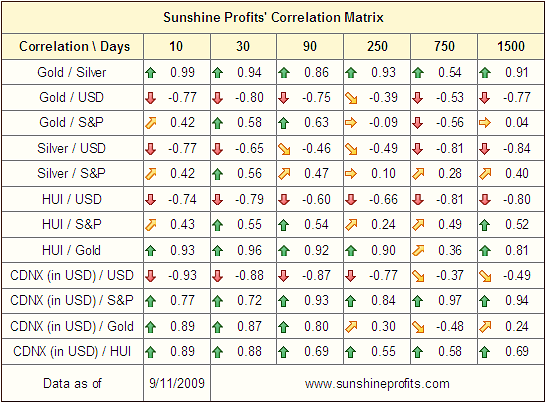
The short-term (30 days) column tells us that both the USD and the S&P 500 are correlated with PMs, with the strongest correlation in case of the dollar. Moreover, the 10-day column, which can provide clues to the near future, suggests that the USD and PMs correlation is not likely to weaken, and might even become stronger in case of silver. The table says the opposite about PMs and the general stock market, meaning that a the chance of a simultaneous sell-off in stocks and PMs has become a little lower.
Summary
Precious metals moved higher this week and gold managed to close above the $1000 barrier, a significant development. I think it won't be long before $1,000 is the new floor of the gold price and not the ceiling.
Although gold seems to be overbought on a short-term basis, there are several things (high volume over the past several days) to suggest that the regular methods of analysis (the RSI Indicator, for example,) may not be appropriate here. Silver appears to be near a local top, but it does not mean that a brutal sell-off must follow - we may see a small pull-back as a form of consolidation. Should this correspond to gold verifying the $1000 level as a support, we may see substantial moves up in the whole precious metals market. The path of least resistance for the precious metals is still higher.
The key short-term drivers of PM prices, the USD and main stock indices, are in a particularly interesting junctures. The dollar has moved considerably lower and may test its recent support level as a resistance, before moving higher. The S&P 500 may decline after reaching its next resistance level. It is too early to tell if that would take place this week, as the volume (reliable indicator in the past) was not yet extremely low. It is also too early to tell if the PMs would follow.
Again, should gold move above $1000 and verify this level as a support (until then it is still much more vulnerable to a plunge), a small upswing in the USD Index, and/or a decline in the general stock market, may not necessarily mean a return to three digits for the yellow metal. Even if that were to take place, I would expect gold to bounce back quickly and move north of $1000 once again.
The analysis of the price of gold in currencies other than the U.S. Dollar confirms that a bigger move may be just around the corner.
This completes this week's Premium Update.
Thank you for using the Premium Service. Have a great weekend and a profitable week!
Sincerely,
Przemyslaw Radomski

