
I have to confess to a love affair that goes back a long ways with that exciting, hyper-volatile metal - silver.
I was 17 when my mother died and left me what was then for me a substantial sum, so I had to figure out how to invest the money. I suppose looking back one could say I was a precocious teenager. I did some research and hit upon the idea of investing the money in silver. (I guess I was lucky because I bought silver at its nadir and the investment did very well.) It was this experience that sparked my interest in precious metals and launched the trajectory of my career and eventually the Sunshine Profits website.
This week The Wall Street Journal reported that so far in 2009 silver has enjoyed greater price gains than gold. The Journal noted that silver often follows gold, although sometimes with greater moves since it is a less-active market and thus more prone to volatile price swings. Naturally, silver's calm is limited to many consolidation periods, and to the early parts of a particular upleg. When silver finally does move near the end of a rally, the move is likely to be substantial. So far in 2009, December silver futures have risen 26%, while December gold is up 6%, the Journal reported.
Knowing about the relationship between silver and gold can mean large profits at the right time, so I would like to revisit this topic.
Silver, sometimes referred to as "poor man's gold," is often bought alongside gold as a hedge against dollar weakness, inflation fears and geopolitical turbulence. But silver also has a more significant role as an industrial metal because of its application in batteries, cell phones, computers, TV's, refrigerators, medical applications, satellites, weapons systems, electrical wiring applications, etc. In the majority of cases this silver is never recovered. Once it's used up, it's used up.
As mentioned earlier, the rule of thumb is that generally silver initially lags behind gold, but as gold gathers steam, speculators flock to silver and ignite the sharp moves higher for which this fidgety metal is so famous. We can also expect silver to drop faster than gold during a recession. We saw that in the recent stock panic when gold was fairly resilient while silver nose-dived. The yellow metal hit a 14-month low at its worst, while silver spiraled down to a 34-month low.
Today there is a confluence of factors on the demand side for silver: Investment demand, industrial demand and the fear factor due to the economic situation which has not yet resolved itself. We also need to keep in mind that we have another factor, one I touched on last week-- almost 2 billion new consumers in China and India who are moving into middle class status and acquiring a taste for gadgets. Gadgets require silver. In other words, there is a growing demand for silver as an industrial metal and as an investment vehicle while the supply continues to dwindle.
Looking back at history we learn the lesson that we can expect silver to drop faster than gold during a recession, and silver to rise faster than gold during a bull market in the metals.
A simple application of this observation is to trade silver for gold in the middle of a recession, when a bull market in gold and silver is about to start, and to trade gold for silver at the top of a bull market in precious metals.
Today's ratio of gold to silver is 64.6 ounces of silver equal the value of one ounce of gold. With gold today at $956, and a normal, historical 12 silver to gold ratio, (referring to its occurrence in nature, and ratio's value through centuries) silver should be trading near $80.This is about 400% higher than it was trading for this week. So, if the price of silver gravitates to its historic ratio, we can bank on some nice profits. It's impossible to tell the exact date when this would take place, but I expect the ratio to go much below its historical average of 12, most likely in a few years.
Since we're already on the subject let's begin with analysis of the silver chart (charts courtesy of http://stockcharts.com).
Silver
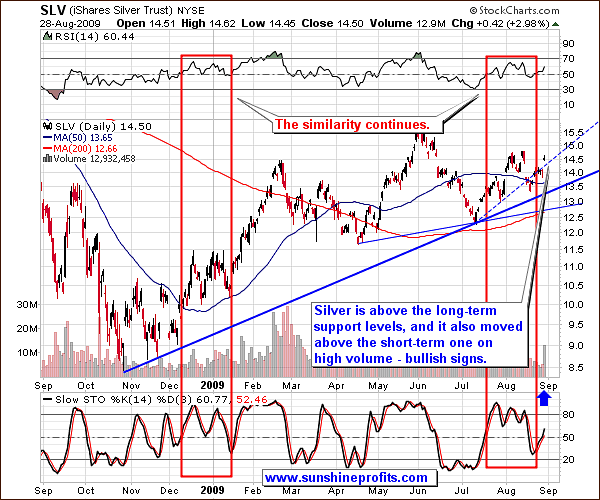
As far as timing the silver market is concerned, the similarity is still intact between the two time frames that I mentioned in the previous Premium Update. The situation developed as I expected and we saw higher silver values this week. Not only did silver manage to stay above the long-term support lines, but it was also able to once again move above the short-term one. Moreover, this move (which took place on Friday, August 28th) materialized on high volume (as marked with the blue arrow on the chart above), which serves as a confirmation of the bullish signal.
The bottom in silver was accompanied by a buy signal from the Stochastic Indicator, which was also the case at the end of January 2009. Back then a relatively large rally followed, so this may also be the case here. Naturally, we may need to wait for additional few days of prices closing above the 14.5 level in order to confirm the move, but given the size of the volume on Friday, I think it is likely that we will move higher from here.
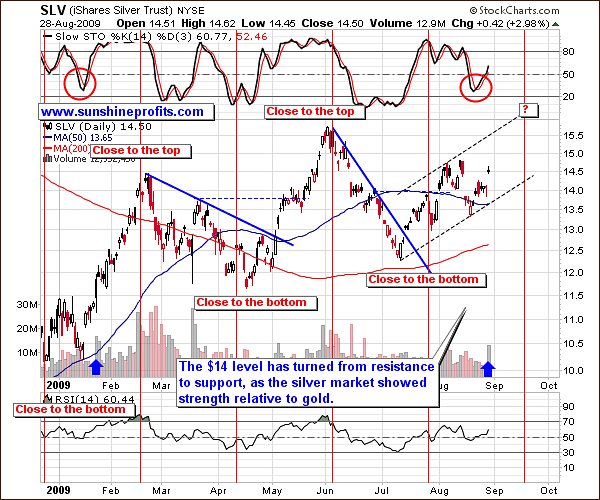
The analysis of the medium-term chart emphasizes the size of the volume of Friday's session. Combining this bullish signal with the featured cycle analysis suggests higher prices are to be expected from here - with a local top several weeks away.
Gold
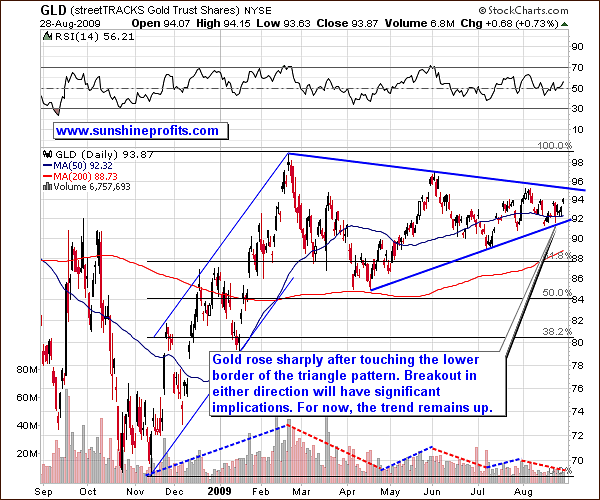
The technical situation in the gold market has not changed much from the long term point of view. We have not yet broken out of the triangle pattern, so the points raised in the previous Premium Updates are still relevant today:
Triangle patterns, like the kind we now see in gold, are usually (about 60% of the time) a sign of a trend continuation. For us this implies that there is a 60% chance that gold prices are going higher above the $975 level, and possibly above $1000.
The volume has been declining from a long-term perspective, but that is nothing out of the ordinary during a consolidation - and a triangle pattern is a form of consolidation.
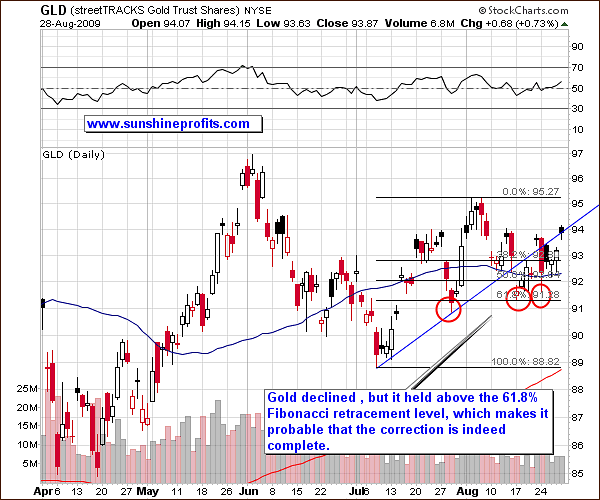
The short-term chart provides us with one additional clue as to whether or not the local bottom has been already put. The 61.8% Fibonacci retracement level, generally considered the maximum size for a correction that does not invalidate the preceding move, has not been broken even though there were three attempts (marked with red ellipses on the chart).
Friday's rise was not as significant for gold, as it was for silver, because gold closed right at its short-term resistance level. Given the size of the silver market rally, it is likely that gold will also move higher from here, but based on this week's price action it is not possible to make very specific calls. The trend remains up in the long- and medium-term (months and weeks), however much will depend on the way the triangle pattern is completed. A confirmed (!) breakout on strong volume would naturally mean much higher prices in the coming weeks, while a breakdown would have the exact opposite implications.
The price action in the mining stocks suggests that the former outcome is more probable.
Mining Stocks
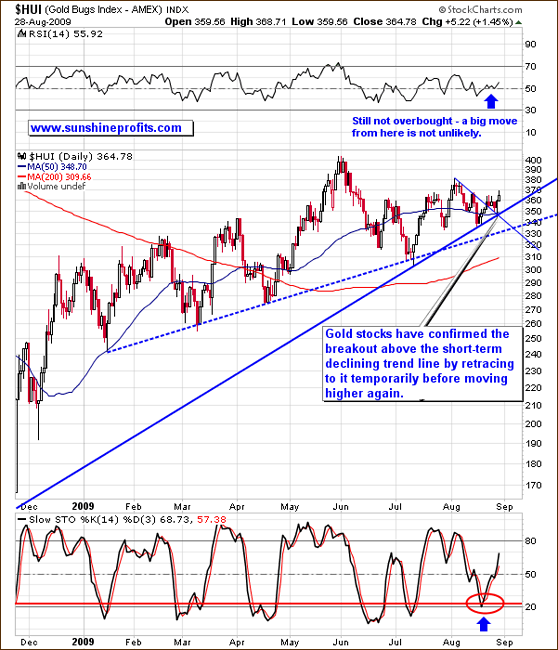
The technical situation in the gold stocks is still favorable. Last week I mentioned that the recent downswing did not take the mining companies below their long-term support levels, and they are just about to move above their short-term declining trend line.
The HUI Index has indeed moved above its short-term declining trend line, and it already confirmed this breakout by moving temporarily lower to this trend line, bouncing and moving higher again. What is even more important, gold stocks have also verified their long-term support level (at the same time).
The Stochastic Indicator has once again proven a valuable tool in predicting bottoms in the gold stocks (though I can't say the same about its efficiency in timing tops). Naturally, we cannot rule out the possibility that we will see a double-bottom here, meaning that prices would decline temporarily before moving higher.
If a double bottom were to materialize here, I would expect it take place if the USD Index moves above its declining trend line (not the most probable outcome in my view). While we're on the subject of the USD, please take a look at the following chart.
USD Index
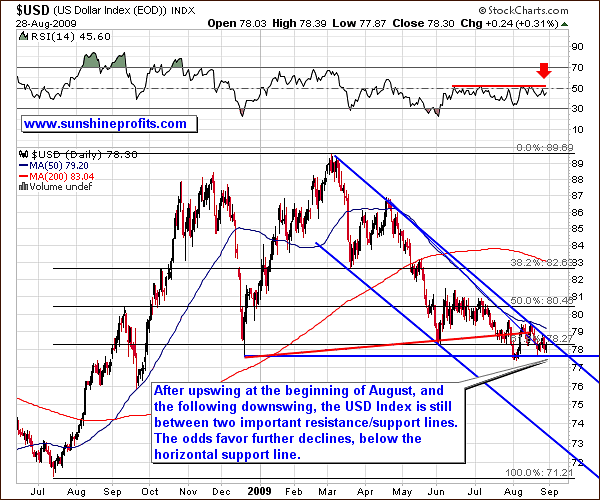
The USD Index has been trading sideways this week, thus postponing the breakout from the declining trend line or breakdown below the December 2009 low. The trading range between the critical support/resistance levels is becoming narrower with every passing day, so we will see a breakout/breakdown at most in about two weeks. The current trend is down and fundamentals are not favorable of the dollar, so a move lower from here is more probable.
General Stock Market
For a considerable amount of time the main stock indices have been rising on a declining volume. Such a divergence usually suggests that the rise is only temporary and that the true price direction is down. Whereas this could be the case here, I would like to point your attention to the fact that the level of volume we are seeing is not yet low enough to be screaming "sell".
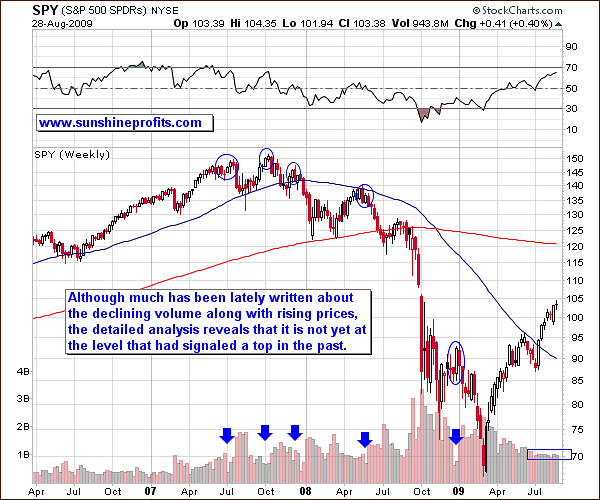
Since it is the long-term tendency that is the subject of this analysis, I have used the weekly chart that filters out the daily noise. The weekly SPY ETF chart makes it easy to compare the volume that accompanied previous tops to the volume in the previous weeks.
Please note that past tops were mostly accompanied by volume that was visibly lower than what we have seen in the past several weeks, so we may indeed move even higher before correcting. (The next Fibonacci resistance level is just below 110, which is also close to the upper border of the price gap - 108.02, which formed in early October 2008.)
Other Factors
The recent bottom has also been confirmed by our indicators that have shaped in a very similar fashion to what was the case during previous local bottoms.
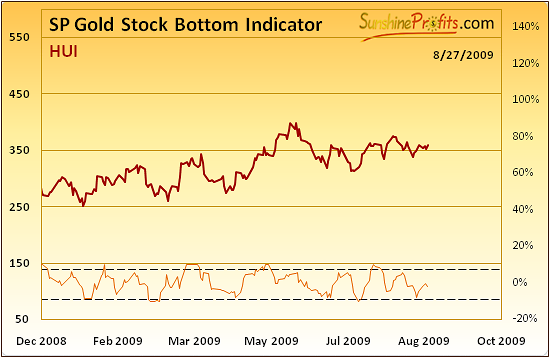
The SP Gold Stock Bottom Indicator moved very close to the lower dashed line, which is generally the "buy zone." Similar behavior in the past meant a bottom in the PMs.
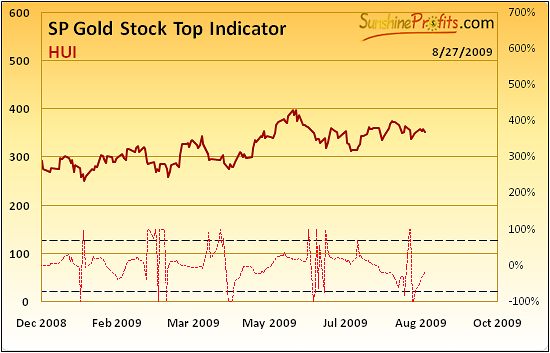
Additionally, the SP Gold Stock Top Indicator (signals extremes) shaped in a way that during the course of 2009 meant that a bottom is in.
Summary
This week the precious metals sector moved higher. The most favorable technical situation can be seen in the mining stocks that have just verified their recent resistance level as a support and are likely to move even higher from here. Silver moved higher on strong volume, which may mark a beginning of a new substantial upleg. Gold is currently in a cloudy technical situation, and much depends on what happens in other markets - still, if silver and mining stocks move higher I would expect gold to move along with them.
The dollar is getting to the point where it has to break down or out of its recent trading range. The trend remains down, which suggests lower dollar values - along with higher PMs. The value of the main stock indices is naturally an important factor as well, especially for PM stocks and silver, due to its many industrial uses. For now the general stock market is overbought, and it moves higher on a declining volume, but the size of the volume is not yet very low, so it would not surprise me to see even more strength in DJIA and S&P 500 before they make a move lower.
It's too early to say whether such a move would drag the PMs down along with them, as there were many times in the past when PMs move along with most stocks, and there were many times when they moved in the opposite direction. Please remember that it the price of the underlying metal that has the most important influence on particular company's earnings and thus its share price, not values of other stocks. I will keep you informed through Premium Updates, or Market Alerts, should the situation change during the coming week.
This completes this week's Premium Update.
Thank you for using the Premium Service. Have a great weekend and a profitable week!
Sincerely,
Przemyslaw Radomski

