
Various news media reported this week that demand for gold sank to a five and a half year low in the second quarter of 2009 after jewelry consumption dropped by more than one fifth. This sounds discouraging, but before jumping to final conclusions, let's take a closer look at the data itself (courtesy of World Gold Council). Let's keep in mind that journalists can sometimes slant the figures, or ignore those that don't fit their story.
According to the tables, total demand was 9% lower in the second quarter of 2009 than it was a year earlier. However, if we take the first half of 2009 and compare it to the analogous period in 2008, we see that during this time frame demand for gold increased by over 14%.
Some might argue that the investment interest slowed (second quarter of 2009 vs. the first quarter of 2009) as the threat of an economic meltdown receded. But this observation fails to take into account the fact that the investment demand for gold is generally lower in the second quarter (please compare the first two quarters of 2008: 170.7 vs. 151.9 tons). Moreover, investment demand in the second quarter of 2009 is up 46% from 2008.
Applying the same half-year analysis to the investment demand, we get 322.6, and 822.4 tons, which means that investment demand was over 150% higher in the first half of 2009, than in 2008. Since it is investment demand that drives prices in the late stages of a bull market, the fact that this type of demand is picking up is actually very encouraging.
Hidden in the various statistics was one fact that jumped right out at me.
China's gold market exhibited unique resilience.
Mainland China's jewelry demand rose 6 per cent in the second quarter, the only major jewelry buying nation to record a positive rate of growth in volume, while its investment demand remained relatively stable.
Like many things in modern China, buying gold jewelry is a relatively new option for China's citizens. Essentially, for the past 50 years, no one was allowed to touch gold in China... except for the government. After the founding of the People's Republic, gold trading was placed under a state monopoly and it was illegal for private individuals to trade gold. They could only sell it to the People's Bank of China.
But today, that is changing... and in a hurry.
Retail price controls in China's jewelry sector were abolished eight years ago and on the investment side, although the Shanghai Gold Exchange was established in 2002, the investment market opened up only four years ago. Small gold bars, commonly known as "little yellow croakers" and suitable for personal investment, made their debut after 50 years of absence from the market, according to the Shanghai Gold Exchange's website.
Most Chinese consumers are still in the process of accumulating gold holdings and relatively low levels of ownership reflect the long period when it was illegal and impossible to do so.
That's a lot of pent up potential.
The potential is astronomical since the average per capita consumption in the past five years was less than half of that of India, and just over one fifth of that in the US. While the Chinese may not have the same traditional attitude towards gold as the Indians, nonetheless, gold has become a part of their wedding season and a component of their investment strategy. The World Gold Council estimates that China might overtake India within the next 10 years, or even as early as within the next five years.
Gold accounts for only two per cent of the total reserves held by China's central bank. Keep in mind that in 1950 China had next to nothing in gold reserves. Today they rank 5th globally, just head of Switzerland and among the six nations plus the International Monetary Fund, that have reserves of more than 1,000 metric tons. The Chinese are frantically mining for more gold on their own soil. If China's reserves continue to grow rapidly, more gold would be required just to maintain a constant proportion.
Let's keep in mind that China is the largest holder of US government bonds and is highly concerned about the fate of the U.S. dollar. It's entirely possible, even probable, that China could diversify some of its reserves into commodities, including gold. In fact, I did a bit of research and discovered that many Chinese refer to the dollar as "mei jin," or "American gold."
Given their recently acquired distrust of the American greenback, they might quite literally prefer to exchange their "mei jin" into real gold. All that could bode very well for the shiny yellow metal.
To see what happened this week to gold let's turn to the gold chart (charts courtesy of http://stockcharts.com). I will begin with the update on the chart I featured in this week's market alert.
Gold
In the Market Alert that arrived in your mailbox on Tuesday, I wrote that
(...) both gold and silver (and corresponding stocks) moved substantially lower, but after putting this move into proper perspective, it becomes clear that they are still within their trading ranges, so the situation is not definitely bearish (...)
I also mentioned that it is necessary to wait for additional signals before making any bearish calls for the precious metals sector. This means waiting for prices to break through a resistance line, and - in most cases - stay there for three consecutive days. (Here the lower border of the triangle pattern serves as a support level.)
At the beginning of this week the PM sector plunged, but prices did not break below the support level. Consequently, the price resumed its previous trend - up.
The same thing can be said about the silver market - the plunge was significant, but silver did not go below long-term support levels.
Silver
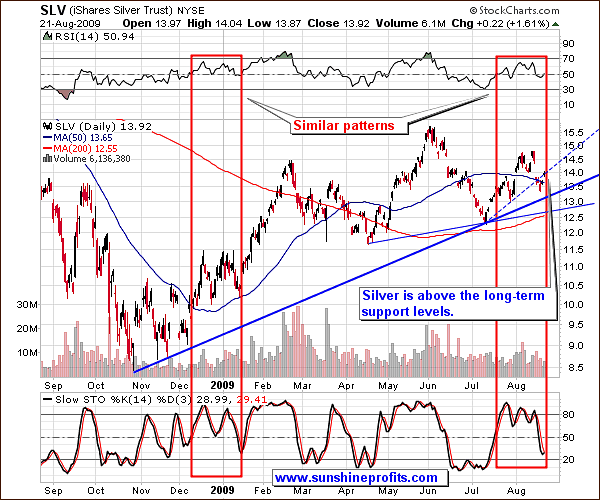
Silver stopped above the long-term support levels and bounced.
The value of the SLV ETF is just above the 50-day moving average, which is also where it was (in relative terms) mid-January 2009, when it put a local bottom and rose over 4 dollars. This does not necessarily mean that it will be the case here, but there are three similarities between these two time-frames (as marked with red rectangles on the chart).
- The first similarity, which took place at the end of this July, is the price action itself. In the first time frame, during the December to January consolidation, silver twice broke lower temporarily. This month we saw silver move lower twice as well. The first small decline occurred in late July and the second took place this week.
- The second similarity, which materialized this week, is in the Relative Strength Indicator. In the December to January period the RSI traded below the 50 and 70 levels, and this is approximately what we have seen for the last few weeks.
- The third similarity is with the Stochastic Indicator. During the first period it traded around the 80 level, but moved below 50 before the final local bottom was in. This is also what we just saw develop from mid July until today.One thing that can cause silver investors' concern is the fact that each of the last three local tops-- February, June, and August-- took place on lower volume than the previous one. Since the June top was the highest one, one can view this as a head-and-shoulders pattern with the Feb and Aug tops being shoulders, and June top being the head. Still, at this point I am not overly concerned.
We saw declining volume also in the gold market, but in case of the yellow metal, each local top was lower than the previous one, thus creating the triangle pattern - which is a continuation pattern, as I mentioned in last week's Premium Update.
The silver market is much smaller than the gold market, and therefore more vulnerable to temporary price manipulation, making technical signals less reliable than in other markets. Therefore, the fact that the middle (early June) top in silver was higher than the previous (February) is not as meaningful as it would be if the same pattern took place in the gold market.
This head-and-shoulders formation in silver has not been completed, so the implications are not bearish at this point - I simply want to give you an early "heads up" on what might be in the works in a few weeks.
Until we decisively break below the $12.6 level in the SLV ETF (which approximately corresponds to the 200-day moving average - also an important support level), the head-and-shoulders formation in silver does not need to concern you.
Mining Stocks
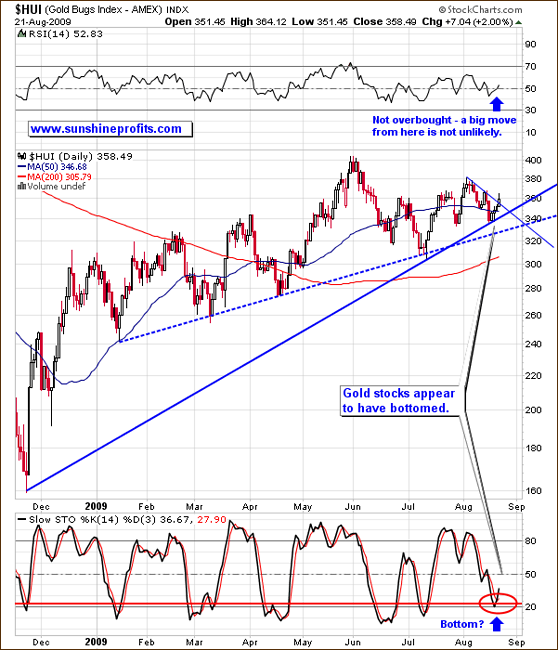
The HUI Index (proxy for gold stocks) is currently in a favorable technical situation.
Gold stocks have been trading sideways in the past few weeks and consequently are ready for the next part of the bull market. The recent downswing did not take the mining companies below their long-term support levels, and they are just about to move above their short-term declining trend line.
The Stochastic Indicator has just touched the 20 level. Similar action in the past meant a local bottom. While a double-bottom is not out of the question, my interpretation of the HUI chart suggests that much lower prices are unlikely. A move to the upside looks possible, as the RSI is not even near being overbought, and the same can be said about Stochastic.
The additional signal comes from one of our indicators - the SP Gold Stock Bottom Indicator.
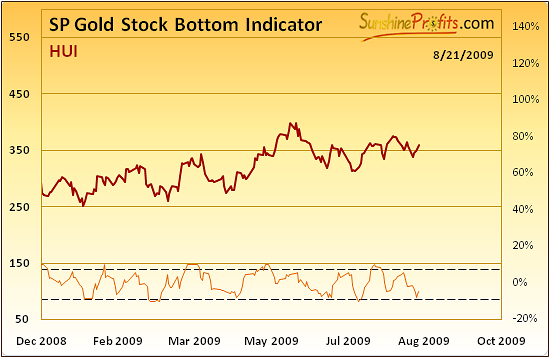
While its value did not reach the dashed line, which would flash a buy signal, it has bottomed very close to it. There are no certainties in any market, but when the abovementioned indicator moved to these levels it was close to a bottom in the mining stocks, not to a top.
Therefore, if you did not purchase any mining stocks yet, it might be a good idea to buy at least some in the coming days.
General Stock Market
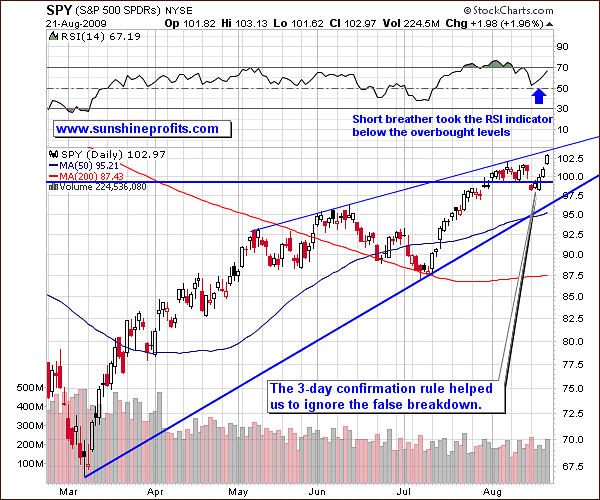
The general stock market moved below the 99.34 level, but this move was quickly invalidated and was followed by a few days of rising prices. This is a perfect example of why waiting for confirmation makes sense. The price is now once again approaching the thin resistance line, but this time it does not correspond to a Fibonacci retracement level, which would make this resistance much stronger. Please take a look at the following chart for more details.
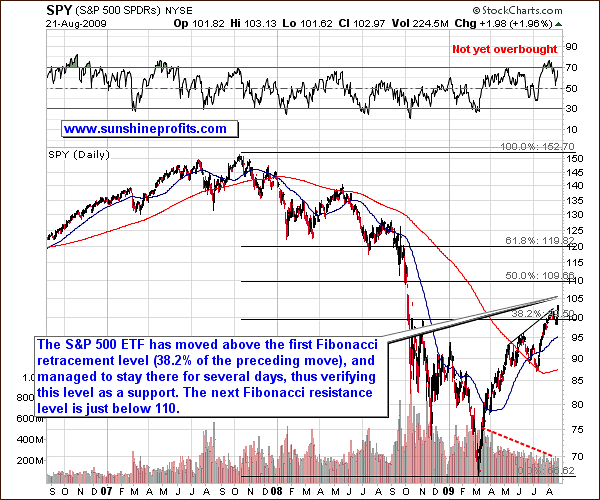
The S&P 500 ETF has moved above the first Fibonacci retracement level (38.2% of the preceding move), and managed to stay there for several days, thus verifying this level as a support. The additional factor pointing to this level as a support is the fact that the lowest Fibonacci level (just below 100) has already served as a support - this week price moved temporarily below it, but quickly moved higher.
The next Fibonacci resistance level is just below 110, which is also close to the upper border of the price gap - 108.02, which formed in early October 2008.
USD Index
In this week's Market Alert I wrote that (...) the USD Index is still below the multi-month trend line, which is visible on the first USD chart from the Premium Update. This long-term trend line is much more important, so the main trend still remains down.
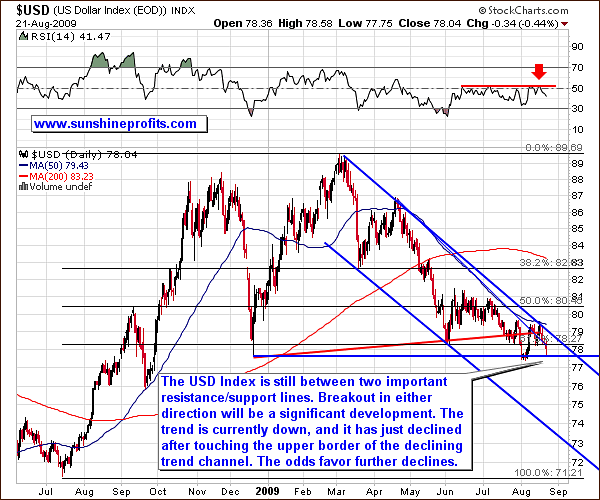
The value of the USD Index moved lower, as I indicated in the last Premium Update, but it is still above the December 2008 low.
The confirmed breakdown below the thick horizontal line is likely to result in a significant move lower. The trend is currently down, and it has just declined after touching the upper border of the declining trend channel. Consequently the odds favor further declines, especially given the fact that the RSI indicator has once again moved lower after reaching the 50 level. The latter development marked a local top during the past few months.
On Friday Nobel Prize-winning economist Joseph Stiglitz said a new global reserve system is needed after the global financial crisis exposed the U.S. dollar-based system as flawed and risky. The "dollar now is yielding almost zero return," Stiglitz said in a speech at the United Nations regional headquarters in Bangkok. "The current global reserve system is fraying. It's falling apart. The issue isn't whether we go to a new system. The question is do we do so in an orderly or disorderly way...It's very hard to have a globally integrated financial system based on a single currency when there's such uncertainties about the economic fortunes of that particular country," he said.
Summary
Precious metals declined at the beginning of the previous week, as they got bearish signals from their key drivers - general stock market moved lower, while USD rallied - but the situation changed during the week.
The temporary breakdown in the general stock market was not verified in the following days, and stocks rallied. On the other hand the USD Index moved lower, and is once again trying to break below December lows. It would not surprise me to see it finally manage to do so.
The technical situation in the precious metals market is generally favorable. The silver market is in a little less bullish situation in technical terms, but based on the specifics of this market, I am not overly concerned about the health of the silver bull.
The gold, and gold stock charts indicate higher prices ahead - not necessarily immediately. But they do suggest that even if we go lower temporarily, this move would not be a significant one.
This completes this week's Premium Update.
Thank you for using the Premium Service. Have a great weekend and a profitable week!
Sincerely,
Przemyslaw Radomski

