
Legendary investor Jim Rogers says he can't wait for the International Monetary Fund to sell some of its gold holdings. Should such a move cause the price of gold to dip, Rogers says he will buy some more.
In fact, Rogers says he buys gold whenever he thinks about it.
"If it goes down I'll buy some more, and if it goes up I'll buy some more," Rogers said in a CNBC interview. "I periodically buy some gold. I don't have a method to it. I just buy it."
The IMF is the world's third largest owner of gold reserves. The number one holder of gold is the United States, followed by Deutsche Bundesbank.
In last week's essay I discussed the new Central Bank Gold Agreement signed recently by 18 countries limiting the amount of gold they can sell each year. They agreed to sell no more than a combined 400 metric tons of the yellow metal each year through September 2014. The agreements were originally introduced to give the gold market stability in the knowledge that sales by central bank would take place in a regulated framework removing the wild card that gold would get dumped ad hoc on the market.
But that still leaves the IMF, which is not a signatory. The U.S. Congress passed legislation in June which allows the American representative to the IMF to agree to the planned sale of some 400 metric tons of gold to finance aid to poor countries. (The IMF holds 3,217 metric tons.)
The International Monetary Fund oversees the global financial system by following the economic policies of its 185 member countries. Its purpose is to stabilize international exchange rates and it offers highly leveraged loans to poorer countries. The IMF has pledged to "avoid causing disruptions to the functioning of the gold market."
Last week I reported that the signatories to the agreement sold 73 per cent less gold in the first six months of the year when compared to the previous year. It was the lowest level since 1944-definitely a bullish sign.
I think the market has already discounted the planned IMF sale and that it won't cause any disruption to prices. China with its huge dollar surplus, has a great interest in buying gold to hedge its dollar. It's possible that China might snap up the entire amount as they have already indicated they would like to do.
The golden rule is - he who has the gold rules. So, in case you are curious as to which countries hold the largest gold reserves, here are the stats on the top ten, according to data from the International Monetary Fund's International Financial Statistics Report.
The top three, as mentioned before, are the U.S. Germany and the IMF itself.
In the fourth position is Italy, followed closely by France. The number six top holder of gold is not a country, but rather the SPDR Gold Shares ETF, one of the fastest growing ETFs in the world. Number seven is China, followed by Switzerland and then by Japan. Number 10 is the Netherlands.
If we include jewelry ownership, then India is the largest repository of gold in terms of total gold within the national boundaries.
Getting back to Jim Rogers, he said he buys gold whenever he thinks of it. However, we are much smaller investors and need to time our trades with more caution. Therefore, let's turn to the gold chart (charts courtesy of http://stockcharts.com) for some clues.
Gold
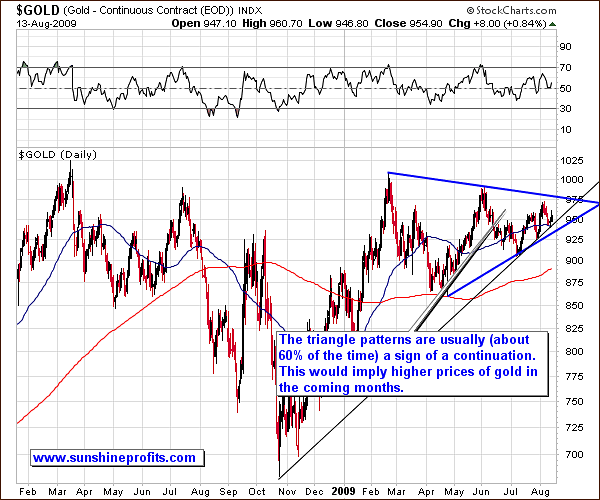
This long term gold chart confirms the fundamental outlook.
Triangle patterns, like the kind we now see in gold, are usually (about 60% of the time) a sign of a trend continuation. For us this implies that there is a 60% chance that gold prices are going higher above the $975 level, and possibly above $1000.
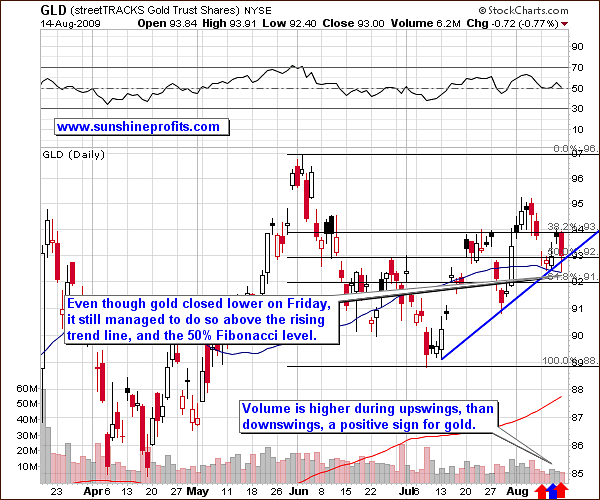
Checking volume in the GLD chart shows that during the past several days, volume was higher when price rose than when it declined. We're not talking about a huge difference, but enough to tell us that volume alone is not suggesting lower prices.
Another interesting thing to notice is that GLD closed above both the declining trend line and the 50% Fibonacci retracement level, which, after price broke above it, has turned into support.
USD Index
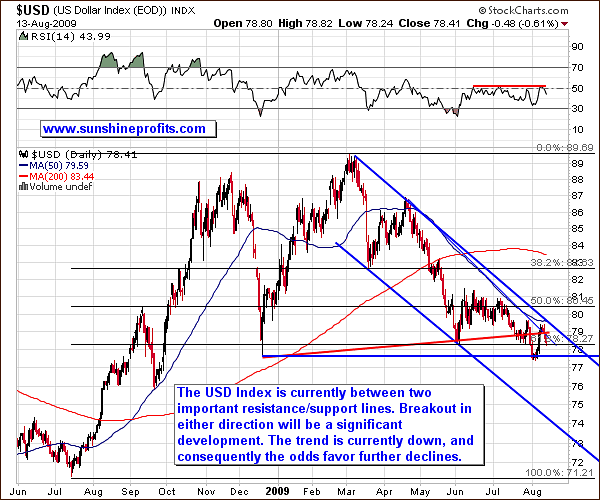
The USD Index is currently entrenched between two important resistance/support lines. I have marked them with thick blue lines. These two lines - the upper border of the declining trend channel and the December 2008 low - provide us with two important levels. Breaking out of these lines would have important implications for the precious metals market, especially for gold and mining stocks. The trend for the USD remains down, so a move further down is more probable, but frankly the situation is somewhat unclear.
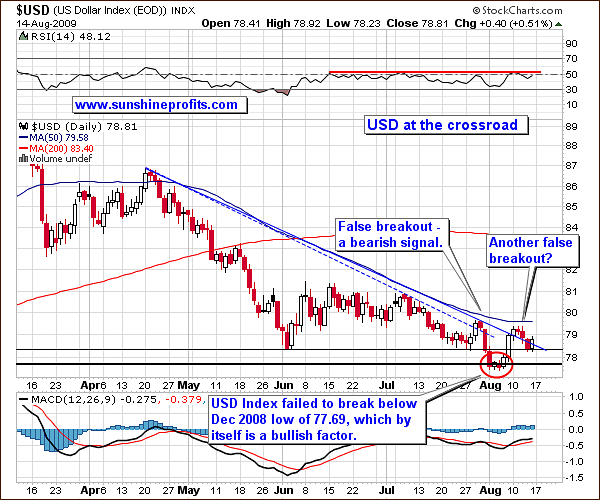
As you can see in this chart, (marked with red ellipse) the USD Index briefly moved below the December 2008 low. However, this move was rather insignificant and definitely not confirmed by closing below that level for three consecutive days.
We saw similar events in late July and early August when the dollar had a false breakout, a bearish signal. This week we saw a small upswing after which the USD once again declined below the previous trend line. Are we looking at another false breakout? It looks that way, but it's a tough call to make right now. Much will depend on what happens in the coming few days.
I would like to bring to your attention that as far as Robert Prechter, President of Elliott Wave International, is concerned, the outlook for the USD is not cloudy at all. He said in recent weeks that he believes that the dollar has put in a major bottom and is going up for a year or two. He points to the Elliott Wave pattern which indicates to him that the next wave for the USD is up. He also point out that sentiment against the dollar has reached an extreme and that the "short the dollar" trade is overly crowded.
As I said, the situation is not clear and we'll have to wait for the USD to telegraph its intentions. For now, the trend remains down.
Silver
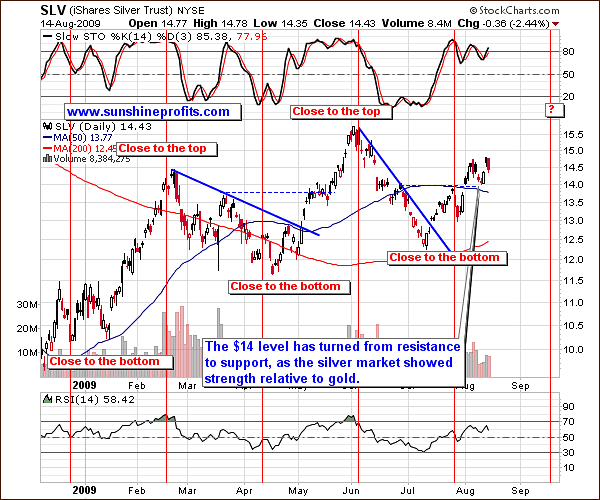
Recently, relative to gold, silver has been acting very strongly. Gold is more or less where it was a month ago, whereas silver is about $1 higher. Since previously I have said that silver tends to outperform gold during the final stages of an upleg, this recent tendency might cause some nervousness. Before I move on to the silver-to-gold ratio analysis let's take a second look at the silver chart.
Besides silver's recent outperformance, and the fact that the $14 level has turned from resistance into a support level, there is one more thing to consider.
I'm referring to the bottom/top cycles that have been present since the beginning of 2009. I have marked them on the chart with red vertical lines. My research shows that every time this particular time period passed, silver has either put, or was close to putting, a bottom, or a top. This signal is not precise as far as the exact day/price is concerned, but it has been rather reliable in indicating the general tendency.
Please note that according to these cycles we are close to the "bottom" vertical line, and are still in the early part of a bigger upswing. This would imply that we can expect higher prices.
Yes, the Stochastic Indicator is at the overbought territory, but it has been more useful in estimating bottoms than calling tops. As far as RSI is concerned, silver is not at the overbought territory. It is close to it, but the same levels (as today) have not meant a top in the past - i.e. the beginning of February and early May 2009.
Silver / Gold Ratio
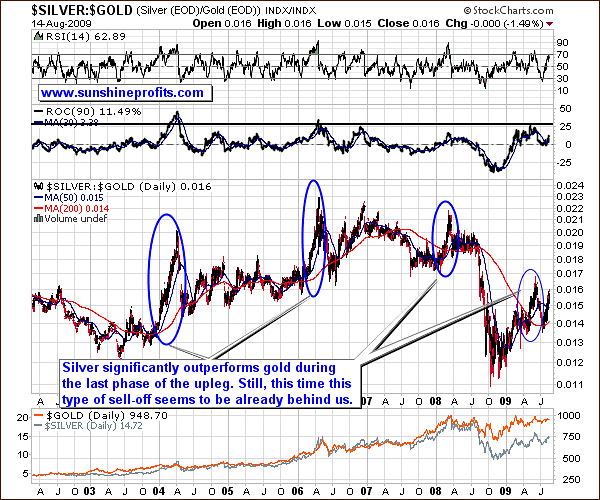
As I mentioned earlier, silver's recent strong performance relative to gold could cause us to worry since in the past this often happened during the final stage of a rally, and thus could indicate lower prices ahead. Still, this time, the most visible rally in the silver-to-gold ratio is already behind us.
If you take look at the ROC indicator and the levels it achieved prior to a sell-off, you'll notice that we are currently much below that level. (The Rate of Change momentum indicator informs us how much the price of a given security changes in a given period.)
The reason I include the ROC indicator here is that its construction allows us to isolate really rapid, meaningful moves from the steady, slow ones. In this case the ROC tells us that the recent out-performance of silver is not really bearish - it is much below levels (about 25) that meant lower prices ahead.
For more information about what might be causing the disparity in the performance of the two precious metals let's look at the precious metals correlation matrix
Precious Metals Correlations
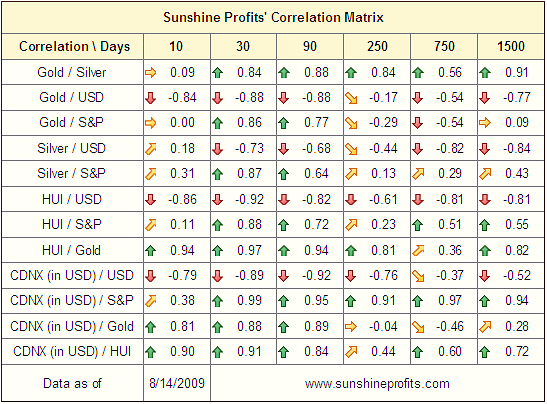
Although not much has changed in the 30-day column (which is statistically significant), the past two weeks (10-trading-days column) were indeed characterized by only moderate correlation between gold and silver (barely 0.09).
Further analysis reveals that gold and gold stocks have been driven by moves in the USD Index (-0.84 and -0.86 correlation coefficients respectively), whereas silver has been rather independent from the dollar (0.18). On the other hand, the correlation between gold (and gold stocks) and the general stock market has been very weak while silver has been trading a little more in tune with it.
Thus, this week's price disparity could be explained by the fact that gold followed the USD, while silver (to a small extent) followed stocks. Historically (1500-trading-day column), silver is much more highly correlated with stocks, than gold (0.43 and 0.09 respectively). Keep in mind that gold's little brother has many industrial uses.
Therefore, should this tendency hold, we may need to look outside of the USD Index for signals for the silver market.
General Stock Market
Last week I wrote:
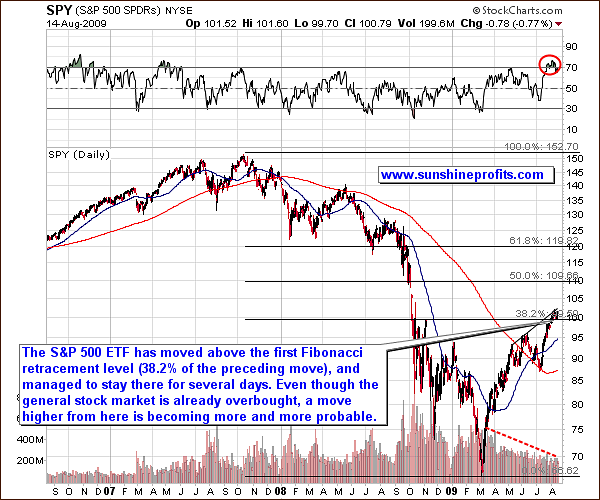
With the price of the SPY ETF so close to these important short-term resistance levels, it is difficult for me to believe that in the short run stocks will go much higher. The red "beware" signals are flashing for investors who are long the stock market.
Stocks did not plunge this week but have corrected to the 38.2% Fibonacci retracement level and were able to hold steady. This can be perceived as a bullish signal, as it means that this level has been "taken out" and we are now ready to move up to the second retracement level (just below the 110 level in the SPY ETF). Additionally, the RSI indicator is no longer in the extreme overbought territory.
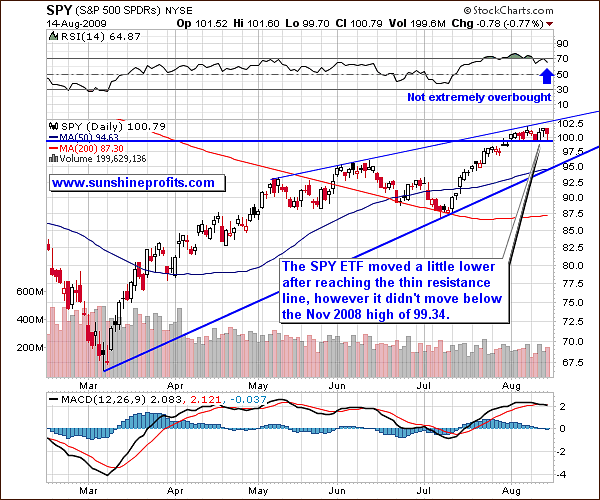
The 38.2% Fibonacci level, which corresponds to the November 2008 high of 99.34, has proven to be a support several times now. This, take into account along with the RSI indicator below the 70 level (not overbought), means that higher prices in the stock market are possible. Consequently, silver is likely to move higher along with the general stock market.
Although this has not been the case for the past two weeks, PM stocks often move along with the general stock market.
Precious Metals Stocks
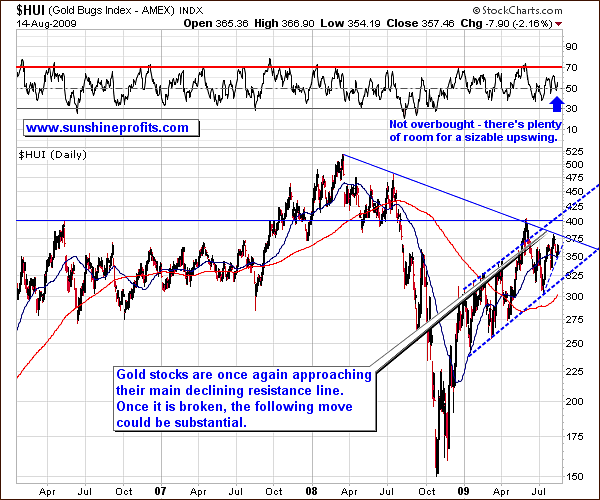
From the long term point of view, gold stocks are currently at a critical juncture. They are just below their important resistance line. Should they manage to break above it, and close above for three consecutive days, we may see a strong rally. The RSI Indicator is not even near the overbought territory.
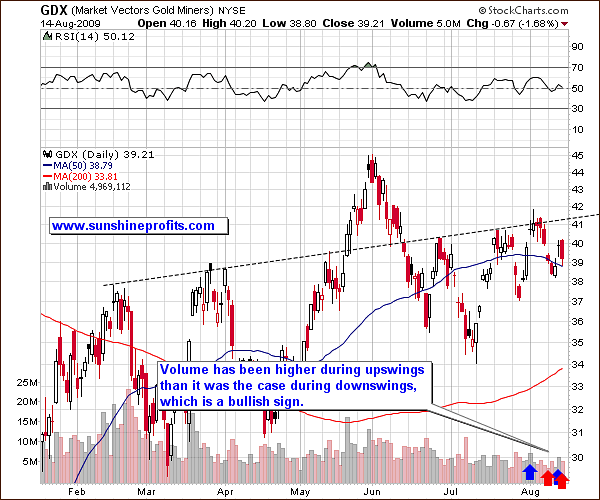
Taking a look at the short-term chart of the GDX ETF allows me to check the volume. As was the case with gold, the volume has been higher during upswings, than downswings, a bullish indicator.
Summary
The technical situation in the gold and silver markets is positive. However, two key drivers of PM prices are now vulnerable to a strong move in either direction. The odds favor the continuation of the previous down trend in the U.S. Dollar, but this is not a sure thing. A move higher in the main stock indices has recently become more probable as they have managed to stay above the critical support level. They have been moving sideways, taking a breather, and making the continuation of the previous rally more probable.
Mining stocks are also at a crossroad. The main trend here is up, and the HUI Index is once again approaching the critical resistance level. Should it manage to break out decisively above it, the following move could be substantial. I will be closely monitoring the markets for signs of strength or weakness, and report to you accordingly.
This completes this week's Premium Update.
Thank you for using the Premium Service. Have a great weekend and a profitable week!
Sincerely,
Przemyslaw Radomski

