
You may have run across newsletter ads that entice you with the promise of revealing a secret investment that goes up after gold prices rise, thanks to a glitch in the U.S Treasury Department. Although I have already covered this in the Editor Answers section, I believe that since gold is still in the "buy" territory, writing about it once again might be valuable to my Subscribers.
The anomaly these ads are referring to is a period in American history between the time FDR signed the order forbidding American citizens from owning gold bullion until the beginning of 1975. The ads hype rare collectible gold coins as the magic investment that goes up after the price of gold does.
There is a difference between contemporary bullion coins, such as the American Eagle, the Canadian Maple Leaf or the South African Krugerrand, that trade at a steady, small premium to the current gold price, and collectible coins, such as rare St. Gaudens Double Eagle coins, that trade at a higher premium. The theory runs that the premiums for collectible coins will rise sharply to catch up with the rise in gold prices, and that is how investors will make a killing.
There is an entry in Wikipedia about Stephen Fenton, a British coin dealer, who was arrested for possession of an illegal 1933 St. Gaudens Double Eagle gold coin during a sting operation at the Waldorf Astoria Hotel in New York City. The coin, which was made within a month of the ban on private gold ownership, was never officially issued and it was never explained how it came to Fenton's possession. To make a long story short, the whole thing went to court, charges against Fenton were dropped, and he made a fortune when the coin was auctioned in 2002 at Sotheby's for $6.6 million dollars. Half the proceeds went to the U.S. Treasury and half to Fenton.
The St. Gaudens are named for their designer who was hired to beautify American coins. St. Gaudens only lived to finish the double eagle and the Indian Eagle. They were struck from 1907 until their ban.
Such a gigantic profit makes one think about running to the local coin shop and buying the rarest and most expensive coins one can find. While this sounds tempting, please consider the probability of achieving such gains. The chance for someone who is not an expert in the field of numismatics to achieve such a profit hovers at zero.
By purchasing high-premium numismatic gold/silver coins you are buying gold/silver with only a part of your capital. The rest is invested in the numismatic premium. Fenton achieved his profit on the rise of this particular premium (not the metal from which the coin was made). By trying to follow his footsteps, you are no longer investing in gold or silver, but in the numismatic premium. Therefore, if you are an expert in the field of numismatics and would like to diversify between the value of metal and the numismatic premium, then the rare high-premium coins might be worth considering. However, the vast majority of investors who wish to purchase bullion products as a proxy for gold/silver prices would be better off by avoiding high-premium coins (I don't own, nor do I plan to buy high-premium coins). You will find additional calculations here.
It is possible that you could get lucky and find one of those one-in-a- million rare coins worth a fortune, but without numismatic expertise, the odds are against you.
Speaking of luck, I read an article in this week's The New York Times about two Swedish grandmothers who found, what experts say, may be one of the richest gold deposits in Europe. The blueberry crop failed that summer, so instead of looking for blueberries, as they did every summer, these amateur geologists went prospecting around their small village. They went to a spot where trees had been recently felled, exposing rocks below. Using their hammers they cleared away soil and dug for six hours until they found a rock with a dull glimmer. Analysis showed that the stone contained more than 23 grams of gold per ton, whereas most active mines in Sweden yield less than 5 grams. The grannies were smart enough to obtain the mineral rights for the area where they found the gold nugget and to negotiate, alone without a lawyer, with 20 mining companies in Sweden and abroad.
Luck is always welcome, but we won't depend on it. Instead we will rely on good-old technical analysis, along with other important tools, which will give us indications on how to make our money in precious metals.
Let's start this week with the chart (charts courtesy of http://stockcharts.com) for the general stock market using the SPY ETF, as it allows me to analyze volume.
General Stock Market
The reason I sent you the Market Alert this week was because of the action we saw in the main stock market indices. I cited the invalidation of the head-and-shoulders pattern, which took place on Monday and was verified on the following days.
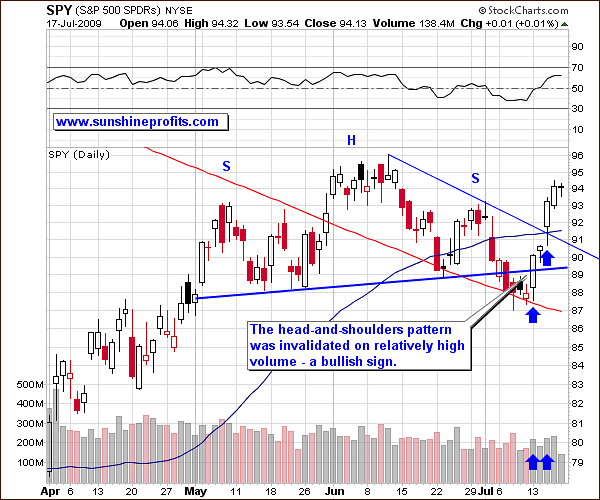
The invalidation I referred to in the latest Market Alert was accomplished after intra-day downswing move that touched the 200-day moving average.
In the previous Premium Update I wrote:
Unless we see a sharp move above this line (89 level) on Monday or Tuesday, the technical picture remains bearish for the general stock market.
In fact, the bounce above the head-and-shoulders neckline on Monday and Tuesday was not only sharp, but also took place on high volume, making it even more significant. It had many traders believing that after four weeks of downside the bulls are back in the market as the earnings season begins in earnest.
Moreover, prices moved even higher in the following days, also on relatively high volume. I marked the second breakout on the above chart with the upper blue arrow - price broke above a declining trendline created by using the head and the right shoulder portion of the now invalidated pattern.
On Friday stocks ended little changed but held onto an enormous rally for the week in which the Dow Jones industrials and the Standard & Poor's 500 index posted their best weekly performance since the week ending March 13. All the major stock indices rose about 7 percent for the week.
Both the breakout and the consecutive daily move took place on significant volume, which suggest that higher prices are possible from here. Had we seen higher prices along with visibly declining volume, we could have inferred that a correction is likely. Volume was very small on Friday, which would normally make a correction likely (thus creating a shorting opportunity), but this time it was not confirmed by analogous values in the indices themselves. Additionally, we see that prices did not increase substantially on Friday, so it is difficult to say that the prices rose on a small volume, as they were barely higher. The underlying index (S&P 500) was down on Friday by only 0.04%, which means that this week's last session was in fact a small consolidation, implying that small volume is a natural phenomenon and does not itself signal lower prices.
The reason why I emphasize the situation in the general stock market is that recently this market has shown a high correlation (30-day column) with the precious metals sector.
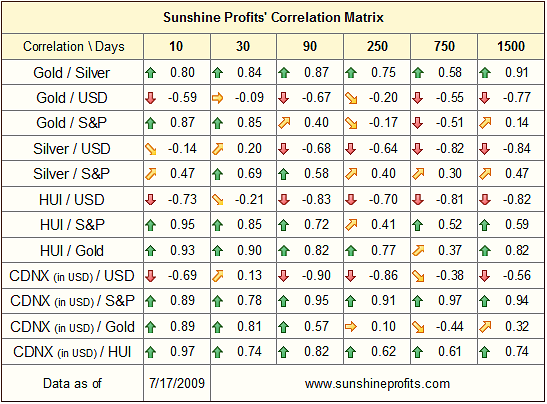
To remind you, green arrows (corresponding to values above 0.5) mean that two particular sectors are correlated significantly in a positive way (the two sectors on average are moving in the same direction). We currently have values for S&P and gold, silver, HUI at 0.85, 0.69, and 0.85 respectively, which means that all of these markets have been trading mostly in tune with the main stock indices.
Still, if you consider the long-term (1500 day) column, you will notice that the U.S. Dollar is definitely one of the key drivers behind the PM prices. So let's take a look at what the USD did this week.
USD Index
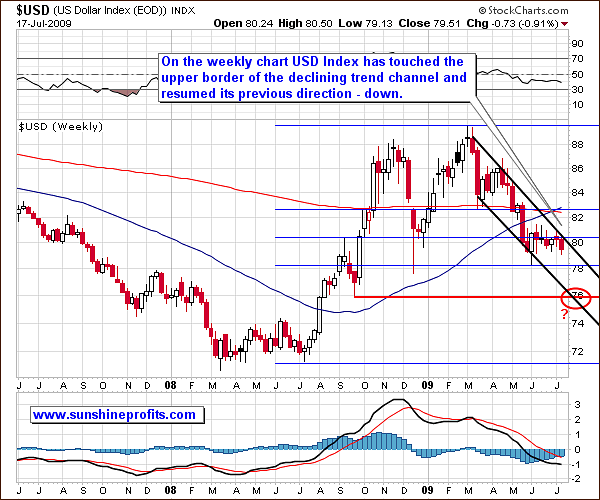
From the long-term perspective (weekly chart) we see that the U.S. Dollar has moved lower after having touched the resistance level. Generally, this suggests that the previous trend (down) will continue. Taking into account the fact that the previous consolidation took place over a month, makes it even more likely to see a significant move. I wrote about this phenomenon in the previous Premium Update.
It is much too early to make specific price projections, but should this be a beginning of a bigger move, it would not surprise me to see the USD at, or below, the 76 level, where we currently see the lower border of the trend channel. Additionally, this price level corresponds to one of the previous local lows - the USD hit a temporary bottom just below the 76 level in September 2008.
From the short-term point of view, this week's price action is even more significant.
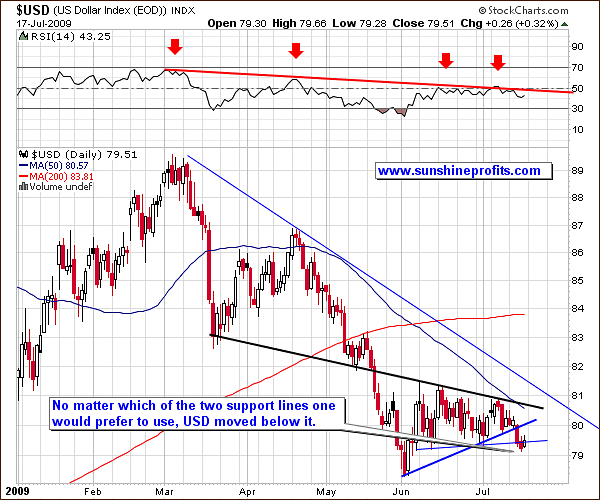
The USD Index has moved below both blue support lines and bounced very briefly on Friday, but failed to break even the lower blue line, which has now turned from support into resistance. While we could consolidate further, I do not view this very likely. This consolidation already took over one month, a relatively long time (compared to the mid-March - mid-April correction) and a breakdown or breakout is likely.
I previously mentioned that the current medium-term trend is down, as is the main, secular trend, so a breakdown is more probable. Therefore, while nobody can rule out another counter-trend rally, the odds favor lower prices in the short-, medium-, and long-term.
Gold
Gold's reaction for this week's decline in the USD Index was rather strong.
The size of the move is impressive when one compares it to the corresponding move in the USD Index. The values of both-- gold and USD Index-- are at the same levels they were at the beginning of July. However, gold moved from its local lows to these levels in this week alone, while the USD retraced only half of the preceding upswing this week.
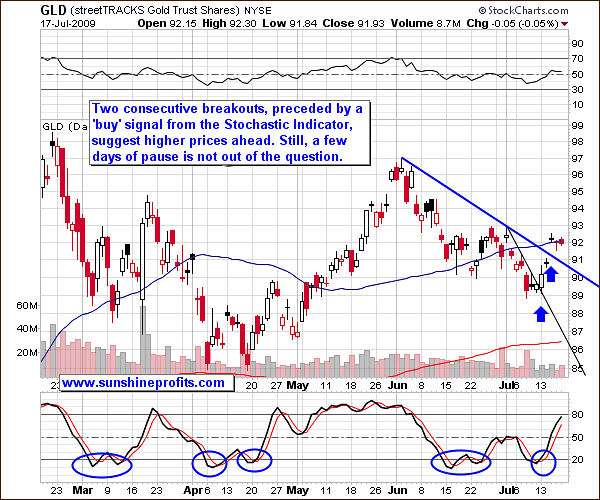
This alone signals that the momentum is currently strong and we may expect even more strength in the PM market. This is confirmed by the Stochastic Indicator that you see in the bottom portion of the chart
The breakout is significant, however, the rapidness of the move suggests that at least a small pullback is likely. Therefore, it would not surprise me to see gold test the thick blue line, by moving temporarily to about $90.7 in GLD ETF, which would correspond to about $923 in spot gold.
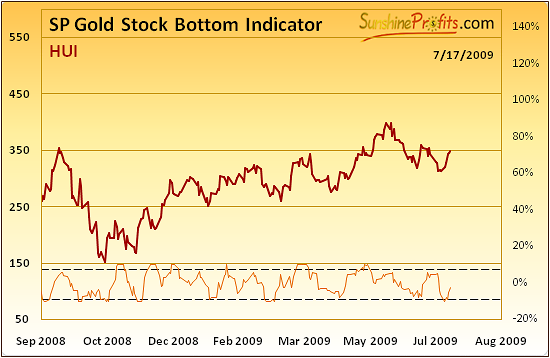
The importance of this week's rally is visible in our SP Gold Bottom Indicator, which rose rapidly and is getting ready to flash a speculative buy signal for gold. The fact that it did not signal a bottom yet should not concern you, as this particular indicator tends to be late in providing signals, but once it does, the following move tends to be substantial.
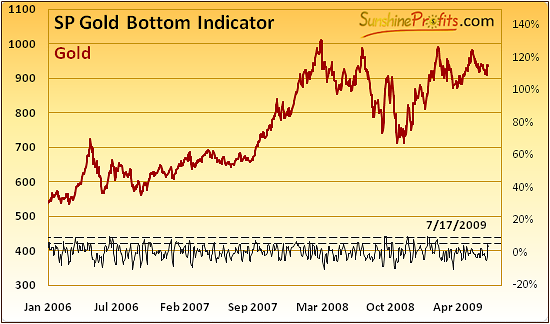
To remind you, the Gold Bottom Indicator gives a buy signal when it breaks down lower than the dashed line, and when it breaks up through the upper dashed line. As you may see, in the past few years, most times when the SP Gold Bottom Indicator flashed a buy signal after a consolidation pattern, a sizeable move in gold emerged.
Silver
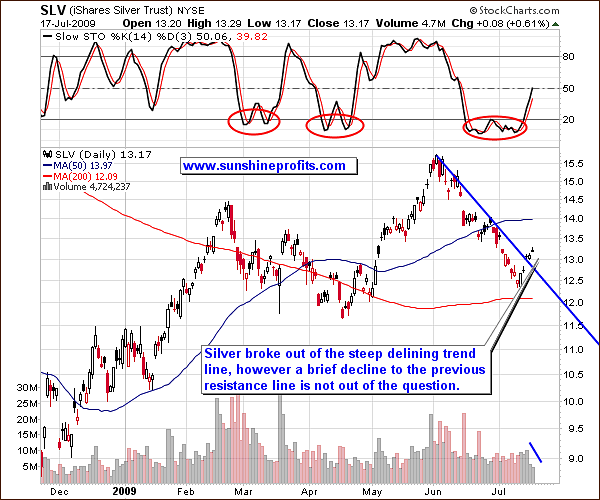
This week's price action in silver is analogous to the one in gold, so I will not go into it in depth as the same implications apply. However, in case of silver, we have just seen higher closes on declining volume, which makes a pause likely - a brief test of the previous trend line at about $12.6 - $12.7 in the SLV ETF which would correspond to about $12.80 in spot silver.
Precious Metals Stocks
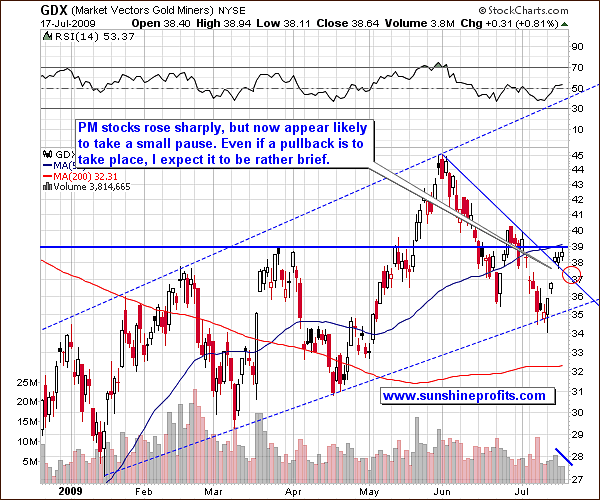
Gold shares got a nice boost from the rising gold price and the surge in the stock market. The technical situation in the gold mining stocks is similar to the gold and silver charts. It suggests higher prices ahead, with a small pullback along the way.
The GDX ETF (proxy for the PM stocks) has moved to its March high which also corresponds to the 50-day moving average. The volume has been low in the past two days and the GDX ETF closed higher, meaning that a small pullback from here should not surprise you. At the moment, my best guess is the area marked with the red circle - around the $37 level.
The additional factors confirming the bottom and pointing to higher prices of the precious metals stocks in the future are coming from our Charts section. For instance, please consider the following chart:
Taking into account this indicator's extraordinary performance so far, we have a rather high probability of seeing PM stocks higher in coming weeks. I recommend that Day-Traders and other short-term Speculators monitor these indicators closely to prepare for taking a particular position even before indicators flash particular signal. To make the process easier you may want to use our RSS feed dedicated to this section.
Summary
Recently the precious metals market has been influenced by developments in the general stock market, which contributed considerably to its recent downswing and subsequent rally. At the moment, the technical situation for the main stock indices is favorable, which means that precious metals are likely to move higher as well. We must keep in mind that the long term situation of the precious metals depends more on the USD's situation, so it is also this market that we must take into account when predicting large moves in the PM sector.
Currently, the situation is not yet crystal clear, but there are signs that point to lower values of the USD Index in the short-, medium-, and long-term, which is another positive factor for gold, silver, and corresponding equities. The technical situation in the PM sector seems favorable, however, a short-term pause is not out of the question. It's too early to make any specific predictions, but taking into account the fact that we have been consolidating below the $1000 level for over a year now, it seems that this rally could take us above this milestone level. Should the SP Gold Bottom Indicator flash a buy signal, I would consider this as even more likely.
Other information
We have just introduced medium- (90-days) and long-term (1 year) subscriptions, which are available at a discount through the PayPal system. As you switch from your current subscription to the medium- or long-term one, your already-paid-for days will be automatically added to your new subscription. To be clear - these days will be priced $0.01 or $0.02 (yes, one or two cents), due to the technical specification of the PayPal system (we never receive this money, as PayPal has a minimum payment processing fee which is higher than $0.02). For example if you had 17 days until the next renewal date and you choose to pay for the next year, you will be billed $0.01 for the first 17 days, and then $499.95 per year. If you wish to proceed (which might be a good idea, as the yearly subscription saves you $100), please click here for detailed instructions.
This completes this week's Premium Update.
Thank you for using the Premium Service. Have a great weekend and a profitable week!
Sincerely,
Przemyslaw Radomski

