
In the recent two Premium Updates I briefly discussed inflation and its effect on gold prices. I showed a chart indicating the massive increase in the amount of money that had been recently pumped into the system. We all know that precious metals tend to appreciate during inflationary periods (under the current financial system) and outperform other assets: stocks, real estate, and bonds. Therefore, this chart is very bullish for gold and silver, long considered to be the ultimate inflation hedge.
I've looked deeper this past week into the issue of inflation researching what some of the smartest people have to say on the subject. There are those, like billionaire investor Warren Buffet, who believe that inflation is inevitable:
A country that continuously expands its debt as a percentage of GDP and raises much of the money abroad to finance that, at some point, it's going to inflate its way out of the burden of that debt.
Then there are those, like Nobel Prize winning economist, Paul Krugman, who don't believe that inflation is just around the corner. Although the Powers That Be have increased the money supply by a trillion dollars, most of that money is sitting in commercial bank vaults as excess reserves and not out in the real world creating "inflation" by buying up cars, houses and flat screen TVs.
I put quotation marks around on the word "inflation" because there is more than one way to define it. As I wrote in the past, I define inflation the way it was originally defined -- "the increase in the prices of goods caused by the changes in the money supply". Using that definition we must consider inflation to be imminent and inevitable. Please keep this in mind, as professor Krugman refers to inflation as the rise in prices of goods (without attaching the monetary base).
Although in ordinary times the Fed's recent actions would cause "inflation", wrote Krugman in a New York Times article, these are not ordinary times.
Banks aren't lending out their extra reserves. They're just sitting on them - in effect, they're sending the money right back to the Fed. So the Fed isn't really printing money after all.
Krugman answers the question of whether the Fed's actions will have to be inflationary sooner or later by looking at the example of the Bank of Japan, that when faced with similar economic difficulties between 1997 and 2003, purchased debt on a huge scale. Most of the money sat in bank vaults and prices fell.
The theory of the Fed's stimulus package is to give money to the banks, which will lend it to individuals and to businesses, who will then spend it on goods and services helping the economy while at the same time inflating prices. Still, from my point of view, the fact that consumers aren't borrowing, and banks aren't yet lending, does not imply this situation will persist forever. As far as the comparison to Japan goes, please remember that these are different economies, different currencies, and most of all - different circumstances. The U.S. Dollar is more of an international currency than the Yen, and I believe that Japan's economic woes are of systemic nature. Therefore, I doubt they can be solved through the monetary/fiscal policy alone, which makes it difficult to compare these two cases.
Moreover, from the banks' point of view, it may make sense for them to wait a little longer before resuming lending money just in case new regulations to have more cash in their reserves will be introduced, as some officials are suggesting. Although in my view such legislation is highly unlikely, I understand that banks may be hesitant to create more credit until they feel more confident
Banks aren't lending yet, but that is likely to change. Think about it in market terms - the short run situation may be irrational and emotion-driven (banks fear to lower cash reserves in case additional regulations are introduced), but in the long run, it is the fundamentals that drive prices. Banks have money but want to earn more, so they will eventually lend it.
There is also the argument about falling real estate prices, which is supposed to indicate that we are in fact in a deflationary period. (Again, please note that this argument is valid only by applying the "modern" definition of inflation which refers only to the increase in prices without reference to the money supply.)
Generally, homes are just one type of goods that need to be taken into account. The best approach is to take some kind of average, for instance the GDP deflator, CPI, PPI, etc., so that no single product can dramatically affect the outcome. In other words, we want to see the forest instead of focusing on particular trees. By paying so much attention to home prices, we are doing exactly the opposite. It would not be so important if it wasn't for the fact that the real estate market has recently ended a parabolic upswing, and prices in any case were bound to move lower, regardless of the inflation/deflation debate.
Some of you may recall the essay I wrote last year about the fundamentals of the gold market, in which I included several real estate market charts. This was based on research I had conducted of historical correlations between gold and different asset classes. (I will update and published this in the future.) While doing this research I had become familiar with work of Robert J. Shiller, a Yale economics professor, who argues that changes in direction of home prices are very slow and moves tend to be of long duration. Once prices determine a direction, the move will be long-lasting and predictable, as he reiterated last month in a New York Times column. After having analyzed long term time series for the median U.S. home prices, I have to concur. The previous surge in prices lasted for approximately a decade and it is too early to expect home prices to bottom soon. Home prices rose too high and had to correct even if other factors (rising money supply) would have normally caused them to rise. Therefore, prices of homes should not be used as a proxy for prices of other goods, even if you decide to define inflation as a general rise in prices.
Summing up, nobody can be absolutely sure what the future holds for inflation, however, in my view, the vast majority of signals are screaming "inflation ahead". Since I can't consult a crystal ball, I will do what I do best, which is to analyze the charts and explain what happened this week in the markets, and even more important, what is likely to happen next. Let's begin with the U.S Dollar chart (charts courtesy of http://stockcharts.com).
U.S. Dollar
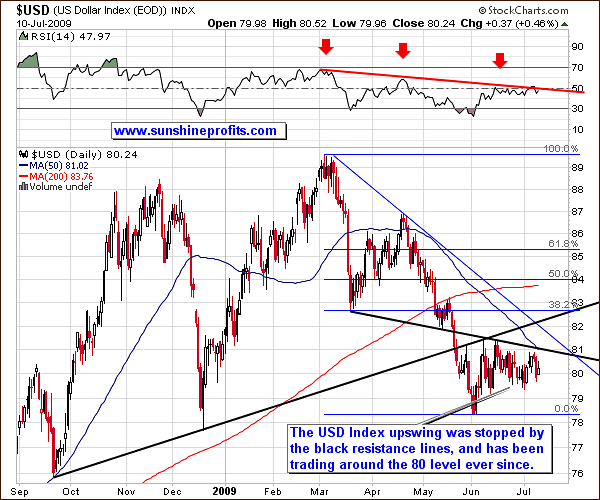
The USD has been trading sideways since its sharp pullback at the beginning of June. Back then the correction was significant, but only in terms of range, not in terms of time. It is often the case that requirements of both time and range need to be fulfilled before prices can resume their previous trend (in this case, down). One of the reasons for this phenomenon is that very short moves are not visible from a bigger perspective. Dramatic intra-day pullbacks are almost invisible on a weekly candlestick chart. This means that some market participants believe that there was no pullback at all and that one is therefore likely. They then proceed to close their positions in the hope of re-opening them at more favorable prices. This action by itself would create a pullback.
Moreover, after a dramatic rally or plunge, emotions are rampant and virtually everyone interested in a particular market is already in (some on the long side, some on the short). In order for a significant move to materialize, many people need to commit to one side of the market. In order to get there, they must first be out of the market (switching from short to long positions and vice-versa being an exception. Traders tend to be in the market in times of several very volatile, yet brief, moves, as they hope to profit on even the daily moves.) What makes a decisive move in one direction more likely to take place is to see these positions closing, which would correspond to decreased volatility. The more traders are out of the market waiting for a decisive breakdown/breakout, the more likely the following move will be significant. This mechanism is visible in many technical tools, including the Bollinger bands and several technical formations such as the "rising wedge".
Please take a moment to study the following weekly chart:
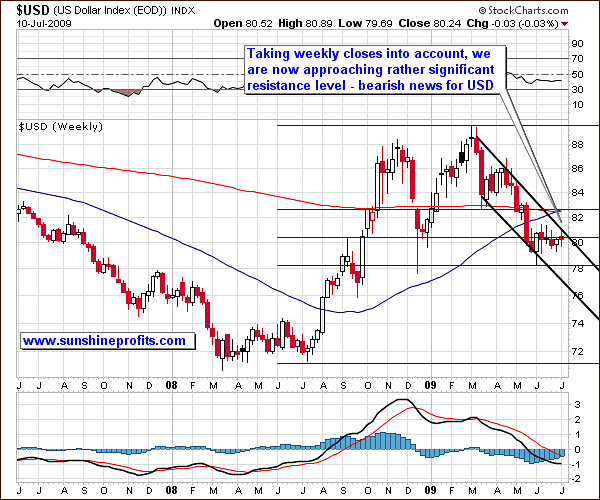
Taking into account weekly closing prices, we are now very close to a resistance level, which, unless we see a confirmed breakout, makes lower USD values in the near term more likely.
As far as implications for the USD Index, we have been trading sideways for approximately a month now, a considerable amount of time, thus making the correction more likely to be completed soon. This is naturally bearish news for the U.S. dollar and bullish for the precious metals market.
General Stock Market
In the previous Premium Update I wrote the following:
(...) there are signs that the general stock market may move lower in the short term. Should that be the case, it could affect the prices of precious metals, particularly silver. Still, I believe that this would only be temporary.
This has been the case this week, as the SPY ETF moved lower on higher volume:
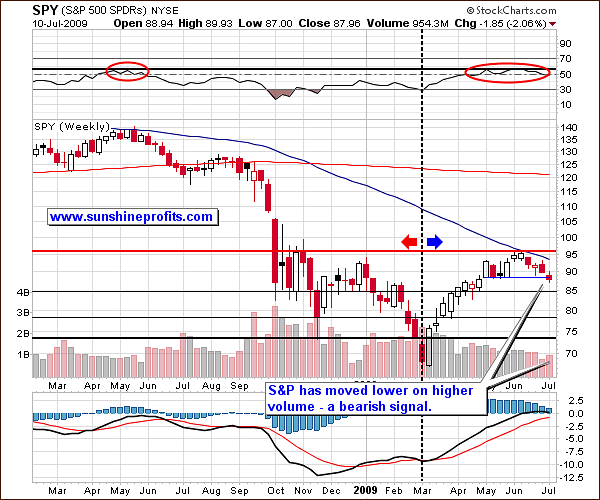
Not only has the general stock market moved below the May lows, but it has done so on a relatively (compared to the previous week) high volume, which makes this move more important. Additionally, the head-and-shoulders formation appears to be completed:

The breakdown below the neck level (currently below the 90 level) has been confirmed by a relatively high volume just after it materialized. Additionally, we witnessed a brief pullback to the neck line, which did not close above it, thus confirming the formation. Unless we see a sharp move above this line (89 level) on Monday or Tuesday, the technical picture remains bearish for the general stock market.
Generally, it is to be expected that the breakdown below the neck line of the head-and-shoulders formation would take prices lower by an amount equal at least to the range between the head and the neck (marked on the above chart with blue, vertical lines). This would correspond to the 82.5 level on the SPY ETF. Please note that there are also other important resistance levels marked on the previous weekly chart (black, horizontal lines) that could stop this decline.
Gold
This week has been disappointing for precious metals investors as gold, silver and corresponding equities followed the general stock market lower.
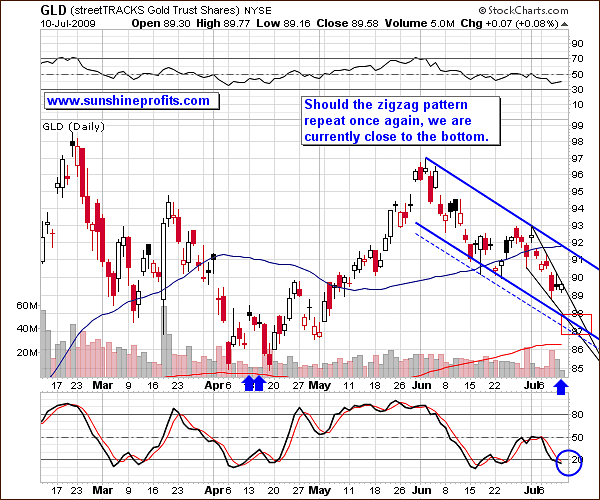
Gold moved lower despite the technical similarity to a previous pattern that was followed by higher prices. Higher prices were likely, but of course, not guaranteed. In order to make calls that have the greatest probability of being correct, it is important to always take what the market provides and use it on an "as is" basis.
Currently, gold appears to be close to bottoming out, as it seems to be forming the zigzag correction pattern. As mentioned in the past, precious metals tend to correct in a zigzag fashion, and this time we could see another example of this tendency. The support area that would likely stop this decline is around the $87 - $88 in the GLD ETF, which corresponds to 885 - $900 in gold. This could be viewed as a favorable development from a psychological point of view, as people who heard in the media about gold going to $1000 would most likely perceive it as being relatively inexpensive below $900.
Friday's close was characterized by very low volume. In the past such a small volume during a rising session meant that the bottom was close - I have marked similar days with blue arrows. Although the very-short-term situation appears bearish, the medium term chart has not changed much.
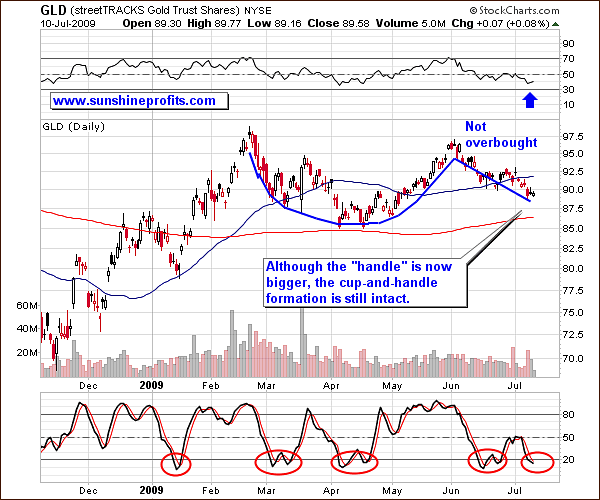
The bullish cup-and-handle formation is still intact, even though the "handle" is now considerably bigger. Additionally, the Stochastic Indicator, which has proven a valuable tool in timing local bottoms in the past, is also suggesting that the bottom is rather near.
Silver
In the previous Premium Update, I wrote
If you are speculating on the silver market and you have open sizable long position, then perhaps limiting it here would be a good idea
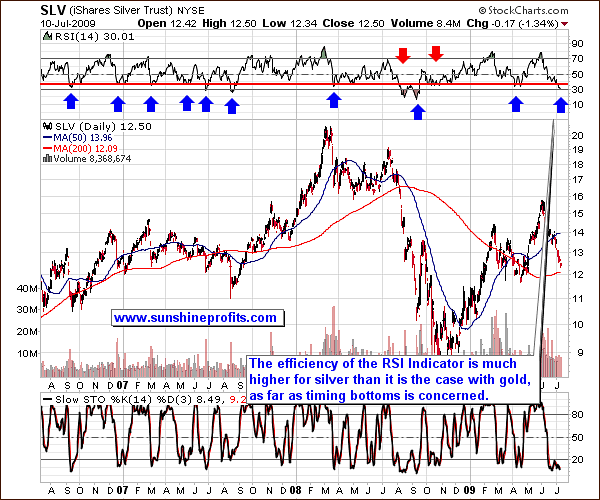
Clearly, that turned out to be good advice, as silver declined severely along with the general stock market. The good news is that silver appears to be bottoming, as its decline is now much too sharp to be sustained for much longer. This is confirmed by two of my favorite indicators for the precious metals market: the RSI (Relative Strength Index) and the Stochastic Indicator. Whereas the Stochastic Indicator has been in the oversold territory for some time now, the RSI has just reached the 30 level that previously marked important bottoms. I have written about the RSI's tendency to be a rather reliable tool in timing gold market tops, but being less efficient in estimating bottoms.
Fortunately, this is not the case with silver. During the last 3 years it was correct in predicting a bottom for silver 10 out of 12 times (as marked with blue and red arrows on the above chart). While one should never rely on just one single indicator/tool, it may be useful to include the RSI in your silver market set of tools. The important thing is that the RSI is now suggesting that a bottom in silver is just around the corner. Moreover, the 200-day moving average, commonly known as the support/resistance level, is also just below Friday's close. Combining the above with the positive fundamental situation for the white metal should make you feel confident about your long-term silver holdings.
Gold Stocks
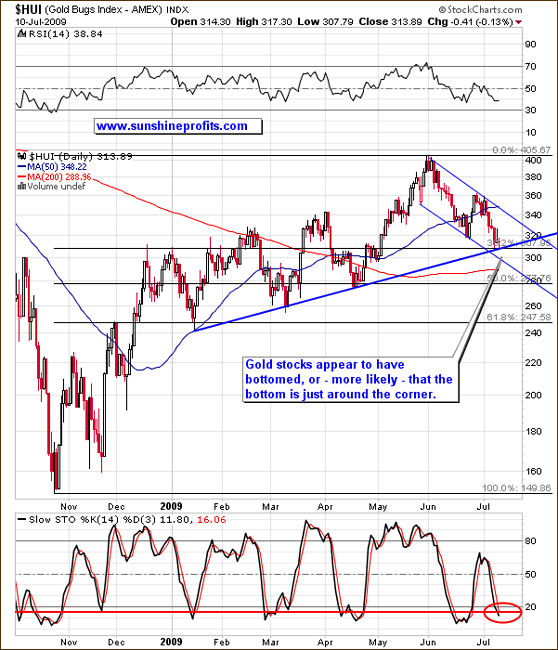
Gold stocks are currently at their support level, created by taking the 31.2% Fibonacci retracement level, and the medium term rising trend line, which is a rather strong combination. Still, should the general stock market plunge from here, it might negatively (yet, most likely temporarily) affect gold stocks' prices. Prices are already oversold (which is confirmed by the Stochastic Indicator), but they can get even more oversold in the coming days. This would correspond to bottoming just below the 300 level on the HUI Index, at the lower border of the declining short-term trend channel.
Additionally, there are also other factors suggesting that the bottom is just around the corner. One of our indicators suggests that higher prices are likely in the future.
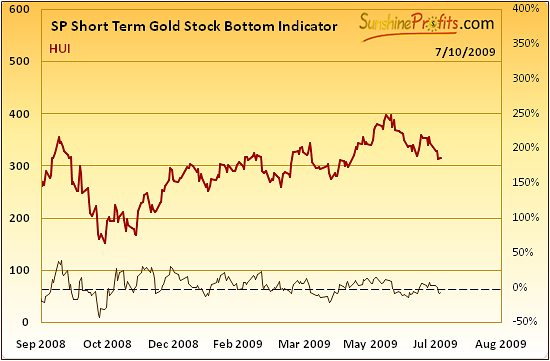
The SP Short Term Gold Stock Bottom Indicator has flashed a "buy" signal on Friday, as it turned up after having declined below the dashed horizontal line. In the past, similar action meant that a bottom is already in, or that it will be in rather soon.
Summary
Summing up, as I have emphasized at the beginning of this week's update, the long-term situation remains inflationary and favorable for the precious metals sector. However, the short-term situation is rather cloudy. In the very recent past, precious metals have taken the general stock market's lead, while the dollar has been trading sideways without a decisive breakout or breakdown from its trading range. The long- and medium-term trends are down for the USD Index, so a breakdown from here is more likely than another counter-trend upswing.
Investors who are already in the market and plan to keep their positions for at least several months don't need to trade the rest of the downswing. Short-term Speculators might want to wait a little longer before opening long position in the precious metals market. I believe that the best approach here is to monitor the technical situation of the market drivers-(USD, SPX) as the PMs move to their support levels. Ideally, the most powerful combination under current conditions would be to see the PMs bottom along with strength in the general stock market, and a breakdown in the USD Index.
A word of caution to speculators who use derivatives: any sharp sell-off in the general stock market that could drive precious metals much lower on an intraday basis might throw you out of the market (due to the stop loss orders), just before a powerful rally. If you are long on the precious metals futures, you might want to limit your exposure here.
I will be monitoring these markets and report to you if I believe the situation is particularly favorable to enter new trades.
This completes this week's Premium Update.
Thank you for using the Premium Service. Have a great weekend and a profitable week!
Sincerely,
Przemyslaw Radomski

