
In last week's Premium Update I left you with the intriguing thought that gold has a seasonal demand influenced by weather. You expect this of commodities such as corn or soybeans where distinct seasons for planting and harvesting impact their price. But what does any of this have to do with gold?
Traditionally the rule for gold has always been "Sell in May and go away." The phenomenon is called the Indian Summer Doldrums because the demand for gold in India at this time dries up and the precious metals usually spend the summer months grinding sideways in consolidation. The reason is that after May Indian farmers plant their crops and wait for the Monsoon rains. After they harvest in August and September they invest their profits in gold, which is when the demand begins to pick up. India's agricultural sector traditionally accounts for 70% of the country's gold demand. Additionally, autumn also corresponds with the beginning of the auspicious marriage season in India where it is traditional for a bride to receive plenty of gold jewelry from her family as a dowry. Weddings are a passion for Indians, along with Bollywood and cricket, and millions of wedding guests all over India traditionally shower bridal couples with gift of gold.
Let's keep in mind that jewelry accounts for about 75% of total global demand for gold, and of that, a whopping 25% comes from India. This is why this phenomenon is important for gold investors, and since gold and silver usually move in tandem, also for silver investors.
This is a perfect example of how the weather cycle can indirectly influence the price of a commodity. Naturally, there are many reasons why the price of a particular commodity tends to move up or down during a given time frame. While it is impossible to pinpoint clear reasons behind every price swing, it makes sense to analyze the seasonal tendencies, because doing so gives us a valuable point of reference. For instance, if many important indicators suggest that prices is going in one direction, but the seasonal tendencies suggest otherwise, it might means that caution is necessary. Do we take a smaller position? No position at all? Why would the seasonal tendency be different this time around?
There are some compelling reasons to think that this year's summer doldrums effect might be milder than in previous years. Partly due to the seasonal effects, after the June bottom, we could have a rally in July and then the final late-summer correction bottoming in August. Once this pattern is complete, a massive rally could begin (coinciding with the Indian harvest and wedding season) that will run until early next year.
So are we going higher for just one month? That a short time, so prices won't go far.
I am often asked this question during this time of the year, and June 2009 is no exception. I have received several e-mail messages asking why am I suggesting staying in the market now during the summer doldrums.
Tedency is one thing and global events, in particular important technical developments, are another. It is possible for the summer doldrums to remain in place while we might still advance substantially through the summer for other powerful reasons.
Basically, this is possible if the upswings are more volatile than the downswings. If the monthly upswing would take us $200 higher (I'm not saying this will be the case) and then we decline $50 for two months, we would in fact go lower for most of the time, but we would still end up $150 higher.
Another thing to take into account is the massive increase in the amount of money in the system. Please take a look at the chart below (courtesy of http://mises.org )
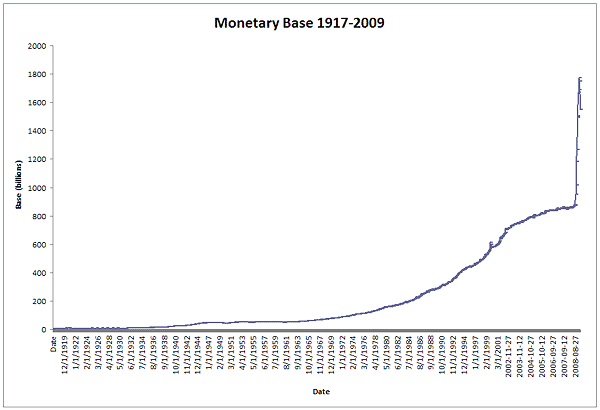
The dizzying vertical line at the end of this chart illustrates the amount of money that has been recently pumped into the system. Since we define inflation as the increase in the prices of goods caused by changes in money supply, this chart is screaming "inflation ahead". Precious metals tend to appreciate during inflationary periods and outperform other assets; therefore, this chart is very bullish for gold and silver. More importantly, precious metals are commonly believed to be the ultimate inflation hedge, so once millions begin to realize the implications of the government's printing of so much money, the prices of metals will vault much higher. This is the perfect example of an instance where important economic developments could pick up the winds blowing on the sails of gold prices negating the effects of the summer doldrums (The term for the summer doldrums comes from the 18th century when sailing ships were dependent on the "trade wind" to make their voyage. In the summer, the winds usually died down.)
In other words - after the first look at the seasonal effects on gold one might think it is prudent to wait through the summer in hopes of entering the market at lower prices. However, after considering important fundamental factors such as the increase in the money supply, it is clear that it is not a good idea to wait until summer's end to enter a market that sooner than later is heading higher. Naturally, there will be pullbacks along the way, but the potential cost of being completely out of the market is too steep.
Please don't get me wrong, it is perfectly fine to try and time the local tops/bottoms with a part of one's capital - in fact it can improve one's overall risk/reward ratio, if the sizes of the positions are appropriate.
The technical side of the market helps us estimate the most probable direction and range of the next move. So, moving on to the technical side, I will begin with gold. (charts courtesy of http://stockcharts.com).
Gold
In the June 6th Premium Update I included a chart that featured non-USD gold. Several weeks have passed since then and I believe an update on this topic will be helpful, especially for my subscribers who cover their living expenses in currencies other than the dolar.
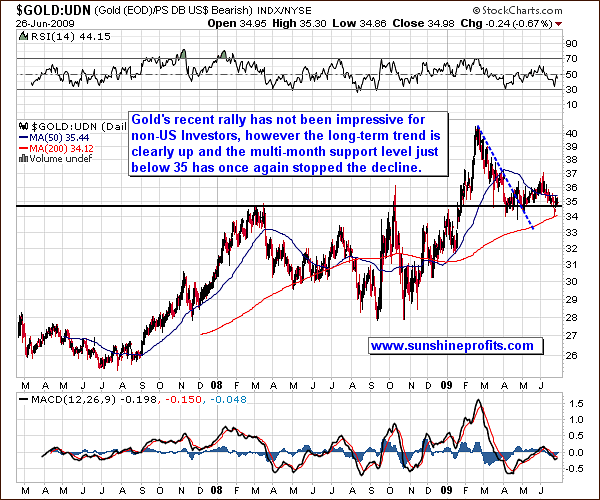
This chart features the gold to the UDN ratio. The latter is the symbol for PowerShares DB US Dollar Index Bearish Fund, which moves in the exact opposite direction of the USD Index. Since the USD Index is a weighted average of the dollar's currency exchange rates with world's most important currencies, we may use the gold:UDN ratio to estimate the value of gold prices in "other currencies".
The June downleg in the precious metals is visible also in other currencies, but the price reversed very quickly once it briefly broke below the multi-month support level (ratio below 35) and touched its 200-day moving average The very temporary breakdown and rapid comeback above the support level is a bullish development.
This means that the buying pressure was very strong indicating potent demand that will prevent gold from going much lower right now. Additionally, since the breakout above the previous highs (corresponds to the abovementioned 35 level) has been verified twice and took several months, it seems that we are now ready to advance further. (In the USD the price of gold did not break though its previous highs earlier this year.)
We need to zoom in to see more details.
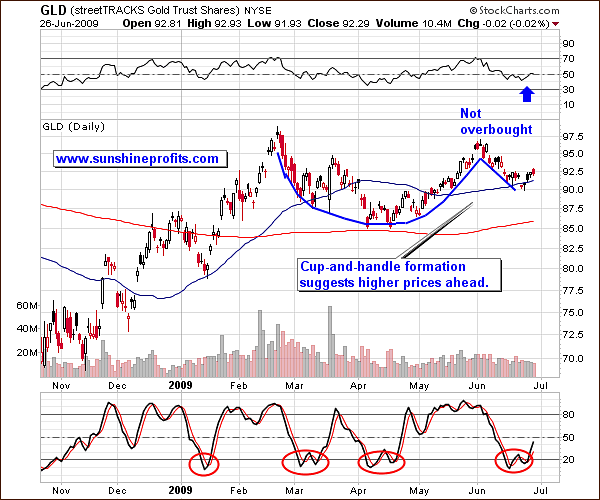
Using the GLD ETF as a proxy, medium-term gold looks bullish. The local bottom that I predicted in past updates has materialized and both visible indicators (Relative Strenght Index and the Stochastic Indicator) suggest higher prices are likely. The Stochastic Indicator has put in a bottom and the RSI is at levels that do not suggest a plunge. Therefore, anyone holding gold right now should sleep rather well.
The cup-and-handle formation, to which I referred several times in the past, seems to be completed, and the handle, which formed during June, is now clearly visible. Ideally, I would like to see the volume shaped similarly to the way price shaped during the mid-Feb to June time frame, as this would perfectly confirm this bullish formation. But this is not the case. The volume was much higher in the middle of the February top than it was at the beginning of June.
Still, the lowest values of volume were in the mid-April during the bottoming process, and the volume declined during the "handle" phase, so I decided to include this formation in my analysis.
Summing up, volume is not ideally confirming this bullish formation, but it is also not invalidating it. I mention this because it helps to put things into perspective on the short term chart.
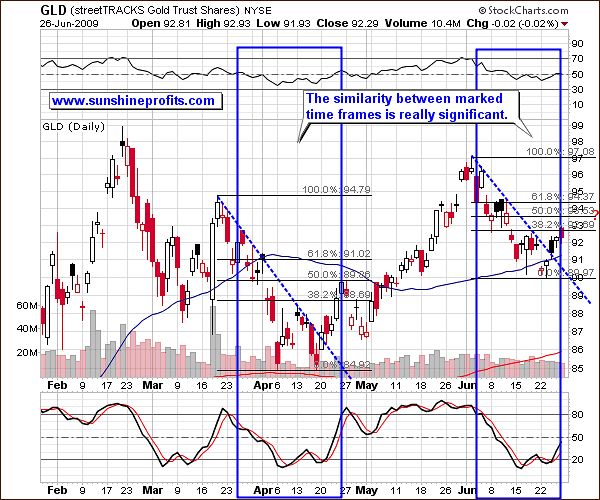
Also in the short term, the technical picture for gold is rather bullish, although a pause is not out of the question. As you can see, the areas marked with blue rectangles look alike. Generally, it is common to see certain patterns on a particular market repeat themselves in a different scale (the so called fractal nature of markets.) This may be the case here. If this scenario is to play itself out similarly, we could see the GLD ETF go to the 50% Fibonacci retracement level, which corresponds to another interesting level.
This level is created by analyzing how much gold "broke out" of the previous (declining) trend. In other words - in the past, about one third of the initial upswing took place below the dashed line. Applying this to the curent situation also provides us with the same level - about 93.5 in GLD, which corresponds to about $952 in gold. The intraday high was $948.40 on Friday -- very close -- so it would not surprise me to see gold take a small breather.
I realize that investors might be concerned that volume has been declining during this week's rise. However, please note that we are now forming the "handle"|part in the cup-and-handle pattern, and thus lower volume is to be expected. So, I believe it should not overly concern us that we moved higher on slightly declining volume.
Summing up, gold is likely to take a small pause here, which will also correspond to the summer doldrums, but based on the current charts, it seems that this move will be insignificant, so I do not plan to trade it for myself.
Silver
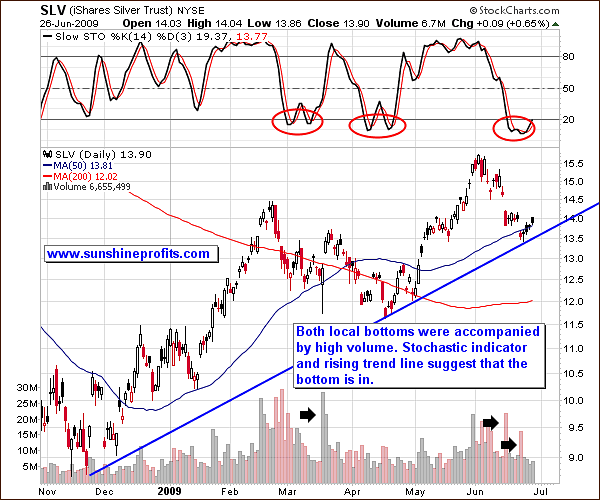
The silver market appears to have bottomed as well. We saw the pattern in the Stochastic indicator, which is usually visible during bottoms, and we touched the support level on high volume. The silver chart confirms the points raised earlier - the most probable direction for price to go is up.
Gold Stocks
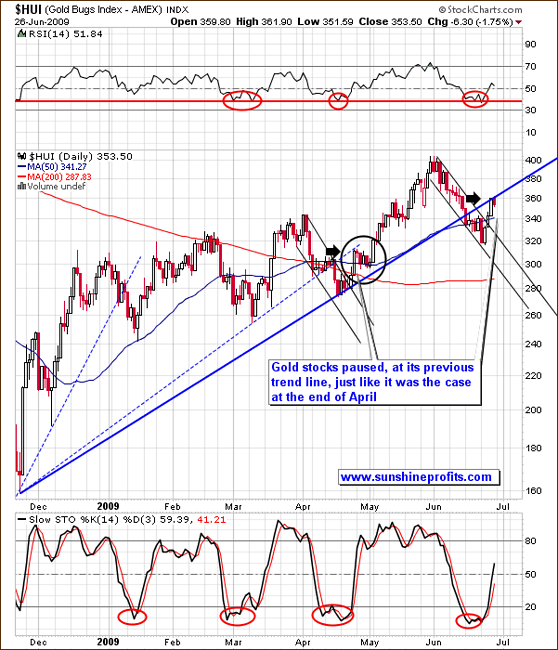
Gold stocks appear to have bottomed as well. Both the RSI and the Stochastic, which proved particularly useful in the past, confirm this assumption. The above HUI chart reveals an interesting pattern - the last time gold stocks were stopped by the previous trend line (just like the case on Friday), it resulted in a very temporary breather barely visible from a multi-month perspective.
Since the situation is similar to the end of April in gold and silver, we may expect it to be the case also for gold stocks. Indeed, the price patterns are alike, which makes it probable that a similar price pattern will follow in the next several days. At the moment, it would mean a consolidation around the 340 level. Please note that it is also approximately the level at which we currently have the 50-day moving average - which was also the case at the end of April.
Correlations
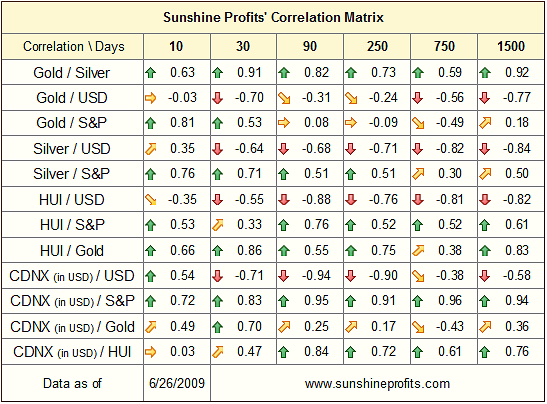
As indicated a week earlier, the correlation between USD Index and the precious metals market has weakened recently and for the past few weeks they have been trading somewhat independently from each other. Since I first wrote about it, the correlation has become even weaker. Although that is a short period on which to base any conclusions, it might tell us that uncertainty about the short-term outcome in the USD market does not automatically need to translate into uncertainty in the gold market.
The precious metals sector is still in a favorably technical and fundamental situation and it does not "require" the dollar to plunge in order to move higher.
Summary
Summing up, the historical tendencies favoring the summer doldrum scenario may not play out this year, as many significant developments, such as the tremendous increase in the money supply, suggest higher prices ahead. The traditional negative correlation between the dollar and precious metals has become barely visible in the past two weeks, but that does not seem to matter much, as gold, silver, and mining stocks are likely to rise even without significant influence from the USD Index. We may experience a pause in gold prices, but most probably not a significant correction.
This completes this week's Premium Update.
Thank you for using the Premium Service. Have a great weekend and a profitable week!
Sincerely,
Przemyslaw Radomski

