
Last week's analysis of sentiment and how you can use it to gain advantage over other market participants has proved to be so popular, with so many positive letters from readers, that I decided to start this week's Premium Update by further elaborating on it.
I mentioned last week some of the most common indicators that can help gauge sentiment, for example, the S&P Energy Sector Bullish Percent Index and Gold Miners Bullish Percent Index. From our point of view, as precious metals investors, it is the Gold Miners Bullish Percent Index that is particularly interesting. Charts are courtesy of stockcharts.com.
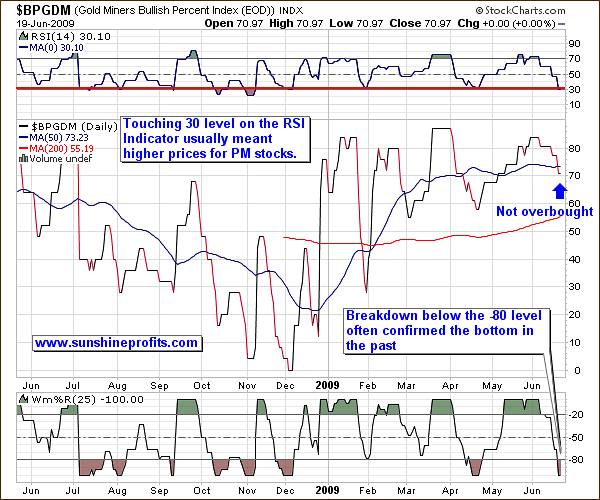
The Gold Miners Bullish Percent Index is a market breadth/momentum indicator and is calculated by dividing two numbers: the amount of gold stocks on the buy signal (according to the point and figure chart, which emphasizes strong moves while ignoring small ones) and the amount of all gold stocks in the sector. If every gold stock is rising, then the value of the index will be at 100%, which raises a red flag as everyone interested in the market is already in, and the top will soon emerge. If we're looking at sentiment, substantial momentum usually corresponds to investors eager to jump in at quickly rising prices because they believe prices will continue much higher and are afraid of being left behind. If we said that at 100% the indicator shows overbought conditions, then you can see on the above chart that at the current 70% level the indicator is not extremely overbought, nor is it oversold. The Gold Miners Bullish Percent Index is no longer signaling that lower prices are to be expected, which was the case several weeks ago. Since the value of the index does not need to be at the oversold levels for a local bottom to form (still it is helpful in timing the major bottoms), we might need to look for additional tools to help us.
If you look closely you will notice two such additional tools in the above chart. The RSI (Relative Strength Index) is a technical momentum indicator that compares the magnitude of recent gains to recent losses in an attempt to determine overbought and oversold conditions.
The RSI also ranges from 0 to 100 with an asset deemed to be overbought once the RSI approaches the 70 level, meaning that it may be getting overvalued and is a good candidate for a pullback. Likewise, if the RSI approaches 30, it is an indication that the asset may be getting oversold and likely to become undervalued. If you look at the RSI indicator in the above chart, you can clearly see that it in fact just touched the 30 mark.
Another indicator on this chart is the Williams %R, also a momentum indicator that is especially popular for measuring overbought and oversold levels during horizontal trends. Bullish percent indexes take values from 0% to 100% and obviously cannot rise above that level, so it can be viewed as a horizontal trend. Named for its developer, Larry Williams, the scale ranges from 0 to -100 with readings from 0 to -20 considered overbought, and readings from -80 to -100 considered oversold. What I find particularly interesting here, is that the %R indicator has signaled a "temporary oversold" territory only once in 2009 - and that corresponded to the long-term buying point (also signaled by the SP Gold Bottom Indicator), and a powerful rally. The last time the %R indicator for Gold miners Bullish Percent index hit the -100 level was on April 17th when gold closed at $869. A powerful rally followed which took gold to $989 in about six weeks. The same signal has just appeared in the recent days, which suggests that we will see PMs higher in the not too distant future.
Please keep in mind that none of this is a "sure bet" that we will immediately go higher - there are no certainties in any market. However, in my opinion this scenario is likely and it seems that it will be profitable to bet on higher precious metals and mining stocks prices and to position yourself accordingly.
Moving on to the technical analysis of the precious metals sector, I will begin with the gold chart.
Gold
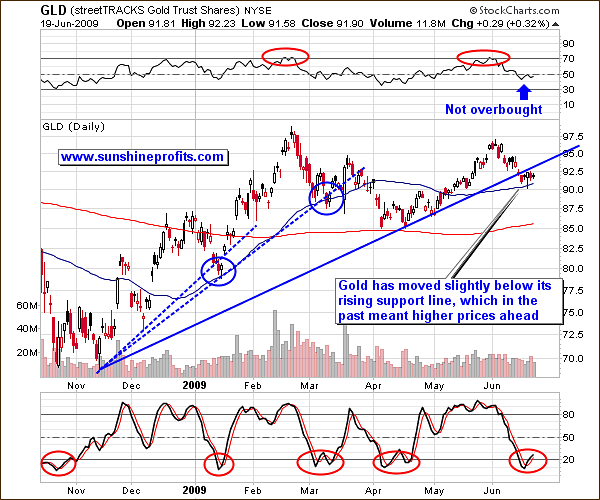
Gold has indeed moved slightly below its rising support line, which (along with similar levels in the RSI and Stochastic indicators), suggests higher prices ahead. I wrote about the stochastic indicator last week. It is a momentum indicator that shows the location of the current close relative to the high/low range over a set number of periods. Closing levels that are consistently near the top of the range indicate buying pressure and those near the bottom of the range show selling pressure. It has crossed its moving average (red slope) and is now moving higher. This suggests higher gold prices ahead. Still, there is a possibility that we will have a double bottom before moving higher.
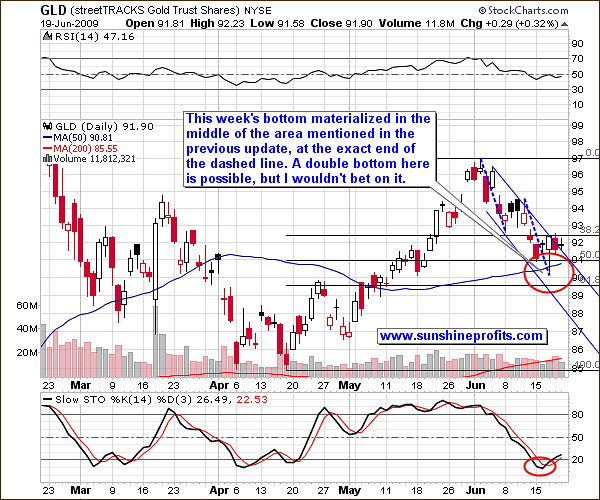
Analysis of the short term chart confirms the conclusion I reached from its long-term counterpart. The bottom materialized within the predicted area, and it has been confirmed by the "buy" signal from the stochastic indicator. One more test of this week's low is not out of the question, but I don't view such a drop as highly probable.
Silver
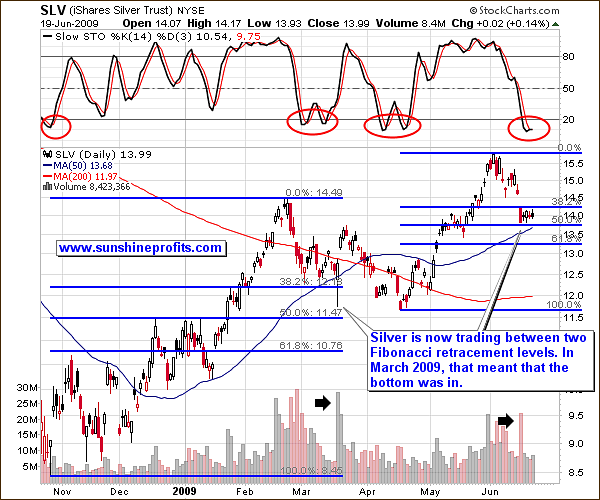
Silver has also moved to the levels mentioned last week. The Fibonacci levels are similar to what happened in March. The action in the stochastic indicator suggests that we may in fact see a double bottom here. However, please remember that technical signals on the silver market are less meaningful than in other markets.
Additionally, please note that the March bottom took place on very high volume. The Monday low when silver closed at 13.83 also was characterized by very high volume, which suggests that this bottom was a significant one. While it's true that history does not always repeat itself, it does so frequently enough to use this principle in one's trading.
Precious Metals Stocks
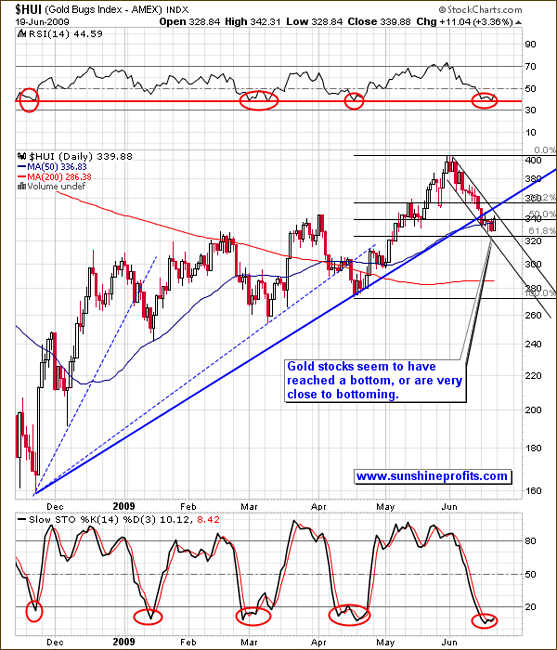
Last week I mentioned that although PM stocks have not yet reached their support line, they are likely to follow gold lower. This has been the case, and it currently seems that we have just reached a local bottom, or are very close to it. While the RSI indicator is not very helpful in estimating bottoms in the precious metals, it is more useful in the case of PM stocks. During past several months, each time the RSI touched the 40 level, an important bottom formed. I believe it is likely that this is also the case this time.
Further confirmation comes from the stochastic indicator. Naturally, a quick intraday spike to the 61.8% Fibonacci retracement level (slightly above the 320 level) is possible, but I would not bet on it. There are too many factors pointing to higher prices to be considering closing one's long positions in order to catch such a small move.
USD Index
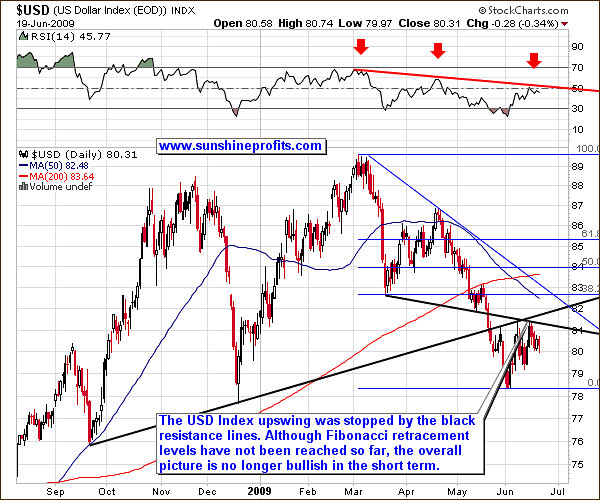
The above chart is no longer bearish in the short term. The rising black resistance line has been tested twice, and each time the USD Index failed to break it. The declining black line also has contributed to stopping the recent rally. One of the factors that previously suggested higher prices - the Relative Strength Index - is no longer in the oversold territory. In fact, it is now at the 50 level, which is not significant, unless one takes recent history into account. Since March 2009, the RSI used to signal tops on lower levels. Once we extrapolate this tendency to the current situation (marked with a red, declining line on the chart), we get an interesting outcome - this week's top corresponds exactly to the level that the RSI is likely to take during the next local top.
Still, since this is not the main way in which the RSI indicator is used, the bearish signal is not very strong. Other factors not yet completely "in place" are the Fibonacci retracement levels. So far even the lowest Fibonacci retracement level has not yet been reached, so it would not surprise me to see USD Index go higher in the short term and reverse slightly above the 82.5 level (at the 38.2% retracement), as these levels proved to mark significant targets for rallies and declines in the past. Still, many more factors suggest that lower prices are likely, so the overall picture for the USD Index is bearish.
Additionally, even if USD Index were to rally, it is not certain that PMs would plunge as a consequence. In the latest Market Alert, I wrote:
Since the precious metals sector has been recently strongly correlated with the dollar, I would ideally like to see the USD Index close to a strong resistance line (making further gains unlikely), but almost every other factor points to higher gold and silver prices ahead, so the overall risk/reward ratio is favorable here.
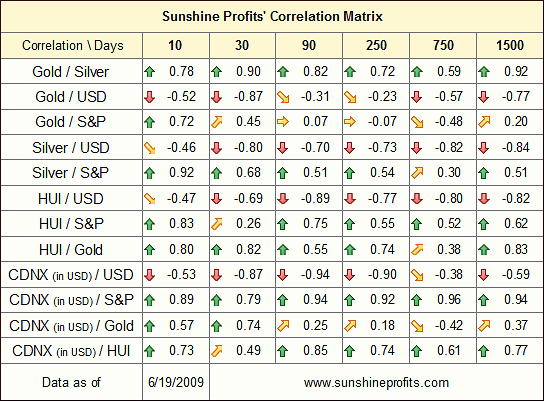
However, those of you who follow the changes in our correlation matrix have noticed an interesting change in the 10-day column. It appears that the correlation between the USD Index and the precious metals sector has weakened. In other words - the tendency for these two markets to move in opposite direction has not been clearly visible over the last two weeks.
Does it mean that the bearish fundamentals for the U.S. dollar are no longer relevant to the PM market? Of course not. It does however say that from the short-term point of view, viewing the dollar as the main factor for determining the price of gold might be misleading. The long-term direction in which the U.S. Dollar is heading is down and I believe exactly the opposite future awaits the precious metals sector.
The implication of this brief analysis of the short-term column in the above table is that although the technical picture of the USD Index is unclear, it is not of a great importance from the point of view of the precious metals investor / speculator. A move in the USD Index will not necessarily be accompanied by a similar (opposite) move in the precious metals sector.
This is a psychological phenomenon - investors usually associate gold with safety and stability, but from time to time some still act as if the U.S. Dollar is the safest asset of them all. Obviously this is an "emotional" judgment, as it defies the bleak fundamental situation of gargantuan deficits, dramatically rising money supply and other gloomy factors that are causing many Americans to toss and turn in their sleep. But in the short run, markets are not rational, they're emotional. Therefore, even if we only consider "the flight for safety" demand, we can still get various results - the gold and USD Indexes may move up or down together, move in opposite directions, or even trade completely independently from each other.
With so many factors influencing the markets, it is feasible to expect that at times the USD Index and PMs will move in synch and sometimes not. With day-to-day volatility it's really hard to estimate the market's current mode. The above correlation matrix has been designed to provide you with a quick overview on this situation.
It is telling us that USD Index and gold, silver and mining stocks have been trading rather independently from each other for the past 10 days. . Although such a short period is not a big enough dataset to make any conclusive calls, it is still a fairly valuable indication that our uncertainty about the short-term outcome in the USD market does not automatically translate into particular uncertainty in the gold market.
Other Factors
In the previous weeks I have written about the SP Short Term Bottom Indicator, and the way it helped to time the previous bottoms in the precious metals market. This week I would like to point your attention to additional indicator that proved to be a valuable tool for PM traders - the Gold Stock Bottom Indicator.
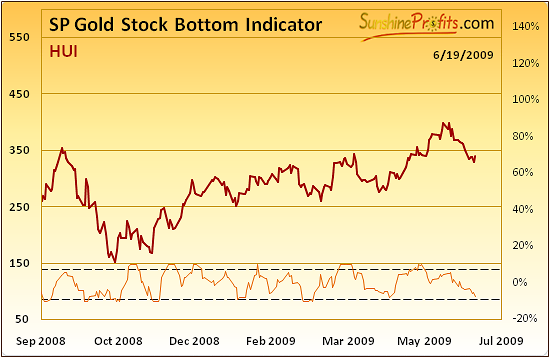
Although it is not uncommon to see several indicators to signal bottom at the same time, I assure you that the calculations behind them are not necessarily similar. The above indicator is based on a different dataset than the one mentioned in the previous updates (thus they have not much in common in technical terms), but the signals that stem from it are similar. While it has not crossed the dashed horizontal line (thus signaling a bottom in PM stocks), it is certainly very close to it. Most times it was the case in the past, it meant that the bottom is in or will be in very shortly. Therefore, we have another confirmation that higher PM prices are to be expected from here.
Summary
Precious metals have declined this week, as indicated in the previous Premium Update. The sector has been falling for 3 consecutive weeks, since the beginning of June, and that alone suggests that at least a breather is to be expected. Still, there are many factors that suggest that a bottom has been already put this week. While this may turn out to be the first bottom, of the double-bottom formation, this is not very likely. Obviously, it can happen, but if it does, it likely will be a temporary phenomenon. I will be monitoring markets closely and report to you if there are clear signals that this may not be the case.
An interesting factor that you may not be aware of is that gold has seasonal demand influenced by weather. You expect this of commodities such as corn or orange juice where there are times that are appropriate for planting and harvesting. But what weather does that have to do with gold? I will cover this intriguing question in next week's Premium Update.
This completes this week's Premium Update.
Thank you for using the Premium Service. Have a great weekend and profitable week!
Sincerely,
Przemyslaw Radomski

