
This week we have seen precious metals and mining stocks peak, just as I've indicated in the previous Premium Update. In the summary of last week's update I wrote that although prices of gold, silver and mining stocks are reaching their own resistance levels, such a correction will most likely be caused by some kind of catalyst, probably a strong move in the U.S. Dollar, or in the general stock market. It turned out that the catalyst was in fact the U.S. Dollar, however I will get back to this issue later in this update.
I will start explaining my opinion on the current situation on the precious metals market, by covering one of our indicators (from the Charts section). It has been particularly useful in determining bottoms during the big comeback of the precious metals sector (approximately since October 2008). The SP Short Term Gold Stock Bottom Indicator has signaled virtually every important local bottom in the previous 8 months, and thus it is definitely worth including in this update. Please take a look at the chart below for details.
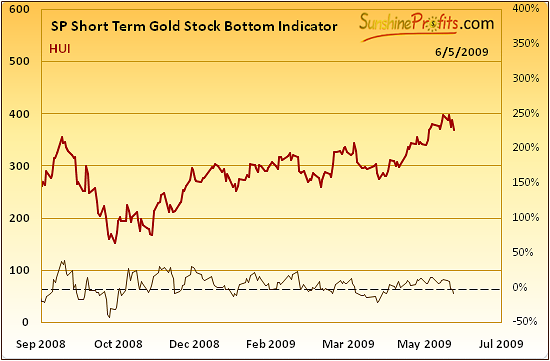
For those of you, who are not yet familiar with our Charts section - the buy signal is given, when indicator is below the dashed line and starts to rise (when value of the indicator has been falling for 3 consecutive days and then the next day is higher). It is based on data from more than one market (it's much more complex than ratios), so it really is available to you on an exclusive basis.
It was at the end of March 2009 when this indicator flashed the last "buy" signal. The reason that I mention this indicator today is not because of what it has just signaled, but because of the fact that it did NOT signal anything so far, and this situation is likely to change in the near future. Naturally, just as this indicator's name suggests, I have designed it to help us determine particularly favorable moments to add to our long- and/or close/limit short positions in PM stocks. Since this indicator's performance has been so impressive in the recent months, it makes sense to take a closer look at the way it works.
As I mentioned above, the first condition that needs to be met in order for this indicator to signal a speculative buying opportunity is that it needs to be below the dashed line. This line corresponds to the 0% level in the right vertical axis. Once the indicator goes below the dashed line, it will flash "buy" as soon as it turns up. Right now we have just seen this indicator break below the 0% level, so the "buy signal" is rather near. Of course, it may continue to fall for an additional week or two, but the history shows that it turns up rather quickly after going below the dashed line.
The implication of the above analysis for anyone interested in PM stocks is that we may soon have a favorable buying opportunity, as this indicator turns up. Naturally, many factors need to be considered (definitely more than one indicator), but given the extraordinary performance of this particular technique, one should not ignore it.
Similar thing can be said about physical metals, as they usually move together with the mining stocks (usually lagging behind them, but there are many exceptions from this general rule). In other words - gold and silver are positively correlated with mining stocks.
Speaking of correlation - our correlation matrix confirms the assumption made in one of the previous Premium Updates - that USD Index is once again an important factor influencing the direction in which the PM sector is heading in the short term. Please take a look at the below table for details.
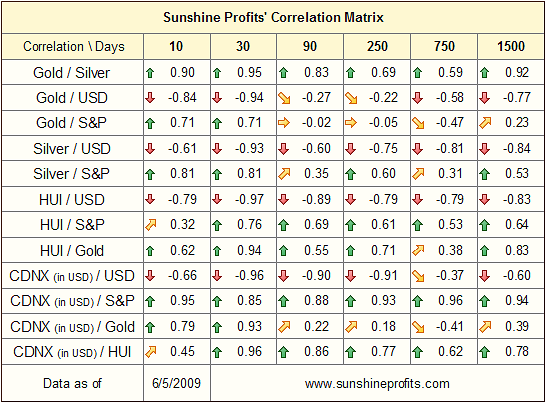
The value of the correlation coefficients between USD Index and every part of the precious metals market (gold, silver, mining senior and junior stocks) has been very close to -1 (respectively: -0.94, -0.93, -0.97, -0.96) during the previous 30 trading days. Based on these values, we may infer that in the past several weeks the main factor that attributed to the rise in the value of PMs has been the U.S. Dollar.
Practically every part of the precious metals sector (gold, silver, mining senior and junior stocks) has been very strongly (negatively) correlated with the USD Index in the previous month. In other words, the remarkable symmetry that has been visible between U.S. Dollar and the precious metals in the past is back. Please compare the column from the previous 30 trading days (recent data) and the 1500 day column (long-term data). The values of all correlation coefficients are similar in both time frames, thus suggesting that the overall situation in the market is once again "normal".
Several months ago (during the plunge in the general stock market) there were many voices complaining that gold stocks have decoupled from gold by declining much more on a percentage basis. Many investors stated that gold is no longer a hedge against depreciation of the U.S. Dollar, and the bull market in gold and silver is over. In the past I have emphasized that the fundamental outlook has not changed much and is still favorable for the PM sector, and that the situation will once again go back to the "normal" mode once the "deleveraging effect" subsides.
This is exactly what our correlation matrix suggests - that the abovementioned phenomena are no longer present. In other words, gold is once again acting as a hedge against weakness in the USD and other tendencies are in place as well. Gold and PM stocks move together, just as it was the case in the past (1500 day column). This is good news for anyone, who believes that the USD is going lower, as this is likely to translate into higher prices of every part of the precious metals market.
There is one more thing that I would like to cover this week and that is gold's performance in other (non-USD) currencies. Like I mentioned above, the precious metals market has been lately driven mostly by changes in the value of the U.S. Dollar. This fact is meaningful from the point of view of investors located in the U.S. (who use mostly dollars to cover their expenses), but it absolutely crucial from the point of view of non-US investors (who use other currencies). The reason is naturally that gold is by default priced in USD but since non-US investors use other currencies, what they are interested in is the value of gold in their own currencies.
Since the previous rally in the precious metals was accompanied by a sizable plunge in the value of U.S. Dollar, the value of gold in other currencies might have not risen so dramatically. In order to get the value of gold in a given currency one must also take the currency exchange rate (between USD and that particular currency) into account. Therefore, if dollar's value declined against a currency (CAD for instance) more than gold gained in USD, then price of gold in that particular currency (CAD) would decline. In other words, investors based outside of the U.S. have not been really impressed by the recent rally, as the price of gold in other currencies (i.a. Canadian Dollar) barely moved.
To put this into perspective, I have prepared chart with a rather unknown ratio - gold to UDN. The latter is the symbol for PowerShares DB US Dollar Index Bearish Fund, which moves in the exactly opposite direction to the USD Index. Since USD Index is a weighted average of dollar's currency exchange rates with world's most important currencies, we may use the gold: UDN ratio to estimate the value of gold priced in "other currencies". What we feature on the chart below is not the price of gold in one particular currency. It is a weighted average price of gold that we calculate based on the price of gold in world's most important currencies. Charts are courtesy of stockcharts.com.
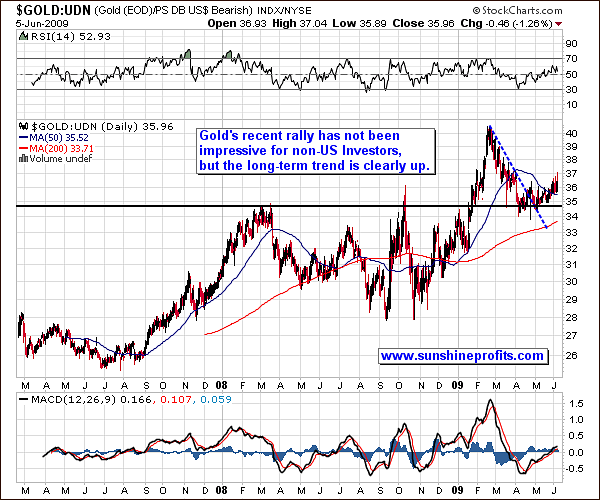
Generally, the May rally in the precious metals is rather insignificant outside of the U.S., but in my opinion this does not change the overall bullish outlook for the sector. I agree that price of gold did not move much higher during the past two months, but on the other hand please note that it rose to new highs in 2009.
After topping in February, 2009, the non-USD price of gold declined to its previous resistance level (black, horizontal line) and bounced. It stayed above this level and at the end of April (approximately, when we suggested completing purchasing long-term investments) it has moved above the declining short-term trend line (blue, dashed line). Quickly after that, at the very beginning of May, non-USD gold has once again verified both resistance lines (blue and black), and moved modestly higher. All of this means that the breakout above the previous (2008) highs has been meaningful.
In sum, the technical situation on this chart is very bullish in the long term - the price of gold in other (non-USD) currencies has on average outperformed the price of gold in USD. Gold priced in USD is still yet to break into four digits, thus surpassing its previous important high, while gold in other currencies has on average already broken through this important resistance level and (what's even more important) has verified this breakout.
USD Index
Last week I mentioned that USD Index is in the oversold territory and bound for a quick bounce. This week that pullback materialized.
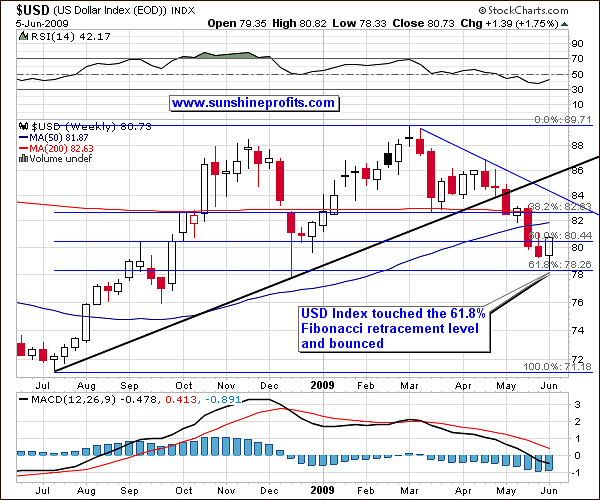
USD Index briefly touched the 61.8% Fibonacci retracement level and bounced. The question here is whether this was the ultimate bottom (unlikely in my view), a correction that is already completed (more likely), or the beginning of a several-week correction (even more likely). For more details we might need to take a look at USD Index from a much broader perspective.
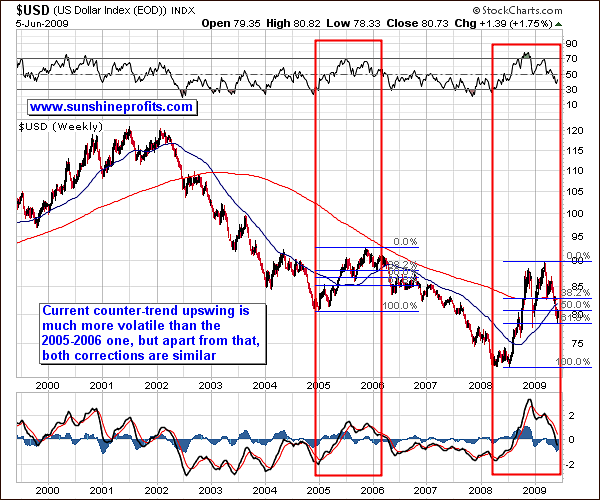
This is not the first correction in the USD Index during this bear market that started 7 years ago. This fact alone suggests that there may be similarities between past corrections and the current one. After taking a closer look, one sees that prior to 2008 there has been only one noteworthy correction, which took place mostly in 2005.
Both (2005 and the current one) corrections began with a double-bottom and took about one year to complete. Their shape has been remarkably similar up to date, taking into account the fact that the most recent correction has been much more volatile. The same can be stated about the way indicators were/are shaped. Swings have been wider recently, but this can be attributed to the increased volatility in the past several months.
Since history tends to repeat itself, we may expect this correction to end in a way that is similar to the end of the 2005-2006 correction. Back then USD Index tested its previous highs by rising to the $91 level. This time, an analogical rise would need to take USD to the 86-88 level, which is considerably higher than we are today. For more detailed signals we need to consider a short term chart.
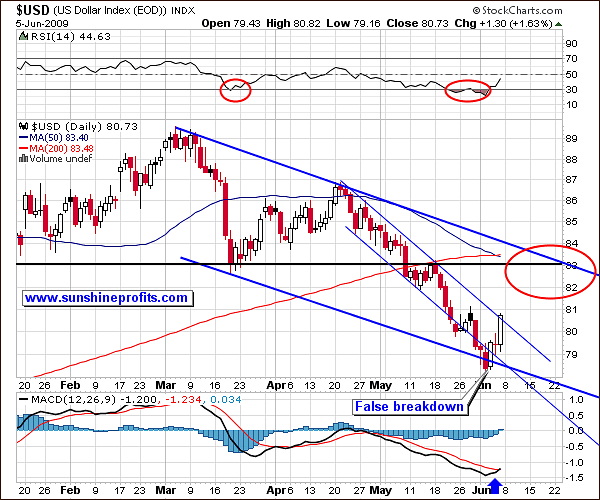
The short-term chart gives us additional resistance levels that might stop this rally, but none of them provides one decisive resistance level. Rallies that begin with a fake breakout or fake breakout tend to be stronger than those, who begin in a different way, so I expect this rally to continue in the following days. It's too early to say where exactly this rally will end, but nonetheless I've marked the most probable topping area with a red ellipse. This corresponds to approximately 82-83 level, certainly much below levels mentioned in the last paragraph (86-88).
In sum, the USD Index appears to have put a local bottom. It is too early to say where and when this rally may end, but many factors suggest that it will go above the 82 level.
Gold
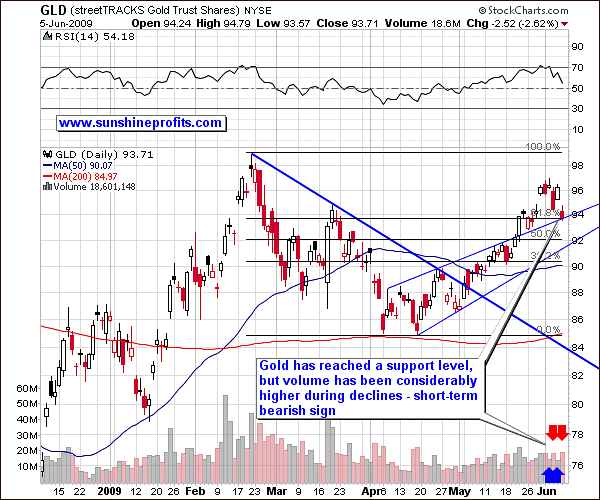
This week gold has moved lower along with rise in the value of USD Index. As I mentioned above, U.S. Dollar is likely to move higher in the following days/weeks, we may see gold move even lower on a short-term basis. This is confirmed by the high, negative correlation between USD and gold, and the way volume shaped during the previous week.
If you looked at the volume from a broad perspective, you would not see anything extraordinary - the average value of volume has been neither exceptionally high, nor low. However, once you consider details, the outlook becomes rather bearish in the short term. The point here is that volume has been declining while gold has been rising and it rose along with declining gold price. Volume usually confirms the direction in which the market is headed, and this time it points to lower prices in coming days. Naturally, a day or two of pause are possible (and also quite likely), as gold is currently just at its support level, but still - it is likely that gold will move lower in the short term.
Silver
Similar analysis can be applied also to the silver market
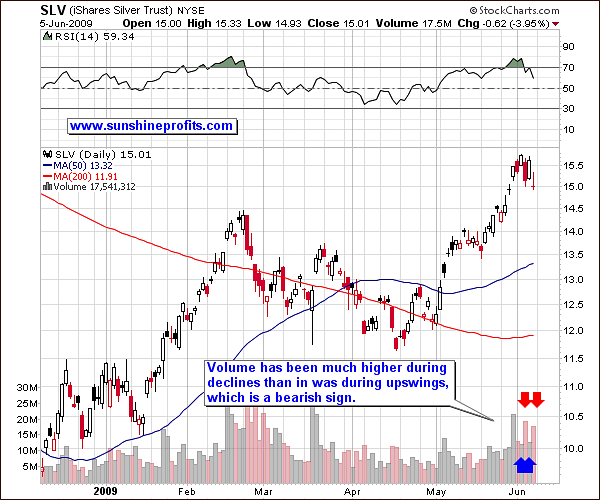
As mentioned above, from the short term point of view, the situation on the silver market is currently similar to the one on the gold market. Moreover, the volume gives much clearer signals, as the difference between days when price of silver rose and days when it fell, is even more evident. Therefore, the silver market may also experience a correction from here.
Precious Metals Stocks
With every part of the precious metals market so highly correlated to the USD Index in the past 30 days, it's natural to expect also PM stocks to be in the "correction has begun" mode.
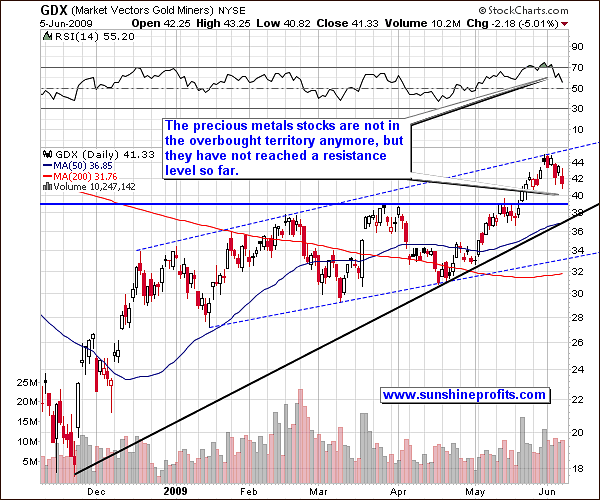
The above chart confirms this theory. We have seen a substantial rally in May (along with declining USD) and the price has now reversed (along with a rise in the U.S. Dollar). Since the correlation between the HUI Index and USD has been very significant recently, we will need to monitor the situation on the dollar market for additional clues. For now, the very-short-term trend is down, and there are two support lines marked on the chart around the $39 level. Should they be broken, we might see the GDX ETF (proxy for PM stocks) go back to the $34 level. Although possible, this is currently not likely in my view.
Summary
The precious metals market seems to be back to its long-term status. Gold, silver and corresponding equities are once again moving against the U.S. dollar, also from the short-term perspective. During the past few weeks this has caused gold's rally to be rather insignificant from the point of view of investors, who cover their expenses using other currencies. The USD Index has just bounced after having declined for a month, which lead to lower values throughout the whole PM sector. Taking into account dollar's previous correction and the technical situation in gold, silver, and mining stocks, we may expect this correction to continue for the next few days/weeks. Once this "breather" is complete, we will most likely have a favorable buying opportunity, which will most likely be confirmed by the indicators from our Charts section.
Naturally, long-term situation still remains favorable for the whole PM sector.
This completes this week's Premium Update.
Thank you for using the Premium Service. Have a great weekend and profitable week!
Sincerely,
Przemyslaw Radomski

