
- The taperie is here
- USD and Euro Indices
- General Stock Market
- Correlation Matrix
- Gold
- Silver
- Palladium
- Mining Stocks
- Letters from Subscribers
- The economic slowdown in China. Negative factor for gold?
- Owning gold in yen terms
- Summary
The taperie is here
2013 was no doubt quite a bad year for gold investors. The huge sellout was a primary reason for this. Yet despite this major change in long positions, the outlook for gold does not seem bad. In the second part of 2013 a big debate about the central bank’s policy was initiated. It was all about Bernankish interventions in the financial market, which resulted in the explosion in the Fed’s balance sheet from billions to trillions of dollars. Since 2008 it was no doubt a huge transformation, and one that had a long lasting influence until the present day.
As we last presented our Market Overview the Fed decided to adjust its activity in the financial markets. As we’ve also seen the decision was much in the spirit of “how much do we have to change in order not to change anything?” The very serious issue to be discussed was the so called “tapering”. And apparently it finally happened. The Fed decided to back out from its policy of expansionary buying programs. What does this seeming backing out look like today? We can read in the Federal Open Market Committee statement in December 2013: “Beginning in January, the Committee will add to its holdings of agency mortgage-backed securities at a pace of $35 billion per month rather than $40 billion per month, and will add to its holdings of longer-term Treasury securities at a pace of $40 billion per month rather than $45 billion per month”.
In other words, every month the Fed will print 5 billion dollars less than in the past to buy additional government securities, and 5 billion dollars less each month to buy additional private assets. That gives us total of 10 billion each month less than in the past, 120 billion less printing every year. “What a great sum of money, what a major shift in policy” – one would be inclined to say, wouldn’t he? Now the Fed is going to print 75 billion dollars, not 85 billion dollars as it used to. But wait a minute…
That’s like saying that a bath tub is getting empty, because the water is coming in at a 10 percent slower pace. Which would obviously be nonsensical. A reduction in future buying of government and agency assets can be considered as some form of reduction, but let us not be misdirected. The Fed is still promising to print and will print 75 billion dollars each month in order to bid the prices of government securities and private assets. That will give us a total of 900 billion dollars for the whole year – those additional green backs being churned out in order to stimulate the economy. This is no tapering at all. This is a very small friendly creature, which should rather be called “taperie”.
The above is based on the January 2014 Market Overview report by Matt Machaj, PhD entitled “Fed and Gold: Outlook for 2014”. Now let us move to short-term analysis (charts courtesy of http://stockcharts.com).
USD and Euro Indices
Quoting our previous Premium Update:
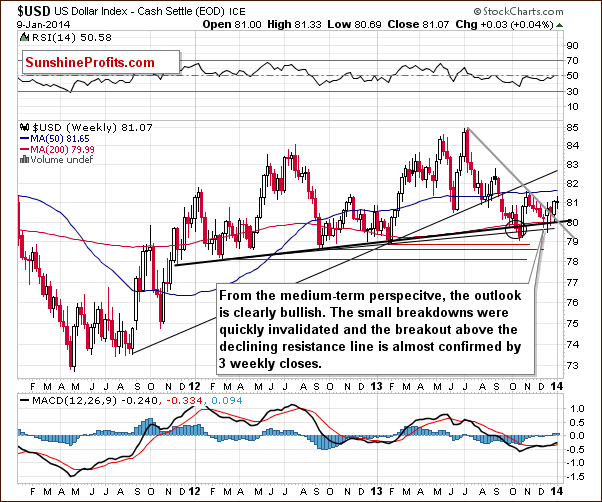
(…) the USD Index broke below the medium-term support line based on the February 2012, September 2012 and January 2013 lows (a bold black line), but (…) quickly rebounded and invalidated the breakdown (…), which is a sign of strength and a bullish factor. (…) the USD Index didn’t decline to the lower medium-term line based on the September 2012 and the January 2013 lows (a thin black line), which confirms the strength of the buyers.
Looking at the above chart, we see that after an invalidation of the last breakdown below the medium-term support line, the U.S. dollar rose and climbed above the short-term support/resistance line based on the July and November highs. From this perspective, we see that the breakout above this line is almost confirmed by three weekly closes, which makes the outlook clearly bullish.
Let’s check the short-term outlook.
In our last Premium Update we wrote the following:
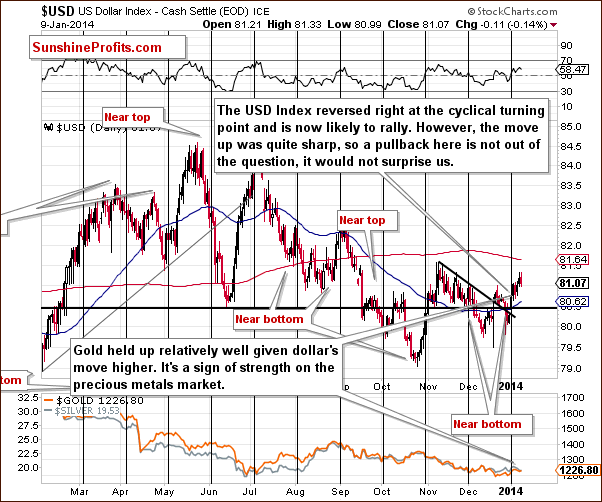
(…) the U.S. dollar moved below the declining short-term support/resistance line only very temporarily, without a breakdown in terms of daily closing prices, which is a positive signal. On top of that, this decline materialized right before the cyclical turning point. This combination of factors creates a particularly bullish outlook and it could be the case that another rally in the U.S. dollar is just starting.
As you see on the above chart, the greenback reversed right at the cyclical turning point and is now likely to rally. Taking into account the fact that the recent upward move was sharp, a pullback here should not surprise us.
At this point, we would like to take a moment to compare dollar’s performance in the recent days with the performance of the precious metals sector (lower part of the above chart). As you see, gold held up relatively well given dollar’s move higher, which is a sign of strength on the precious metals market.
Let’s now take a look at the medium-term Euro Index chart.
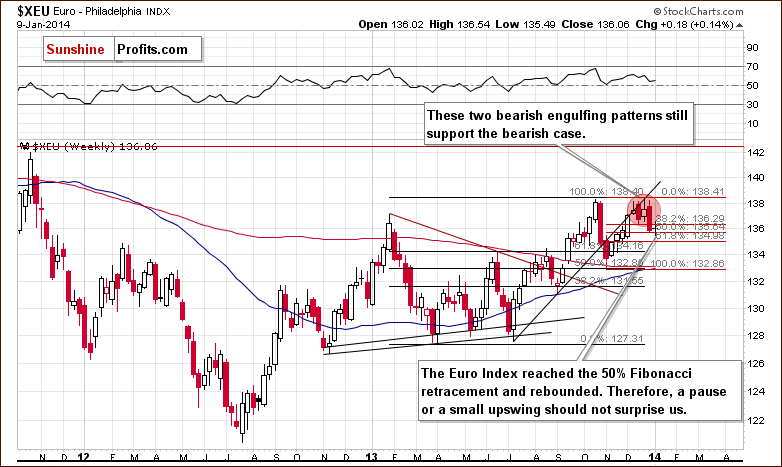
On the above chart, we see that after a sharp decline that we saw in the previous week, the euro extended its decline and reached the 50% Fibonacci retracement level based on the recent Nov.-Dec. rally. After that, the European currency rebounded; therefore, a pause or a small upswing (before further deterioration) should not surprise us. Additionally, please note that the two bearish engulfing patterns still support the bearish case.
Summing up, we are likely to see further improvement in the USD Index as the U.S. dollar almost confirmed the breakout above the short-term support/resistance. Looking at the current situation in the Euro Index we see that although the European currency rebounded after reaching the 50% Fibonacci retracement, two bearish engulfing patterns will likely trigger further deterioration in the medium term. Nevertheless, before we see such price action it seems that a pause or a small upswing in the euro (a pullback in the case of the dollar) on the short-term basis should not surprise us.
General Stock Market
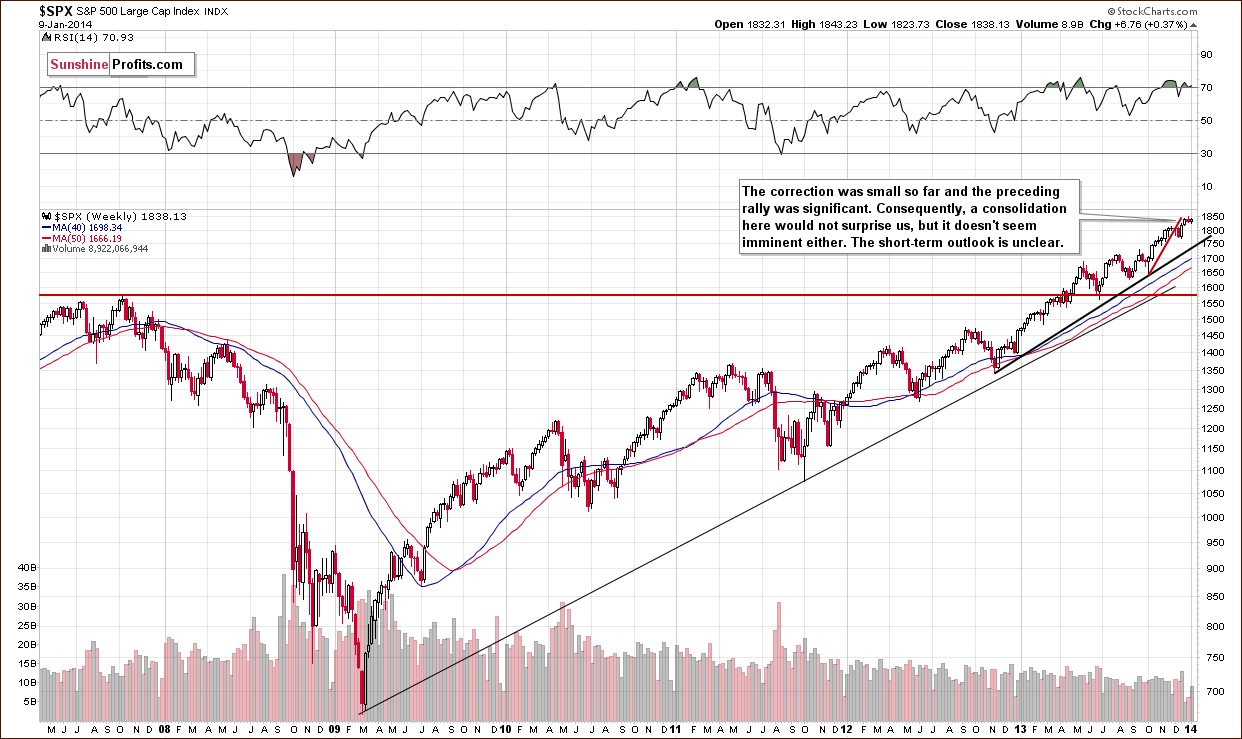
On the above chart, we see that the S&P500 Index extended its gains in the previous week and hit a new all-time high at 1,849. Despite this growth, the buyers didn’t manage to break above the short-term rising support/resistance line that was broken in December. These circumstances in combination with the position of the RSI indicator, which was overbought (and actually still remains above the level of 70), triggered a correction.
Taking into account the fact that the recent corrective move was small so far and that the preceding rally was significant, a consolidation here would not surprise us. However, it doesn't seem imminent. All the above provides us with is the conclusion that the short-term outlook is unclear.
Summing up, although the long-term outlook for the general stock market is bullish, from the short-term perspective it is unclear; we may see a consolidation here.
Gold & Silver Correlations
Let’s take a look at our Correlation Matrix to find out how can the above translate into precious metals and mining stock prices.
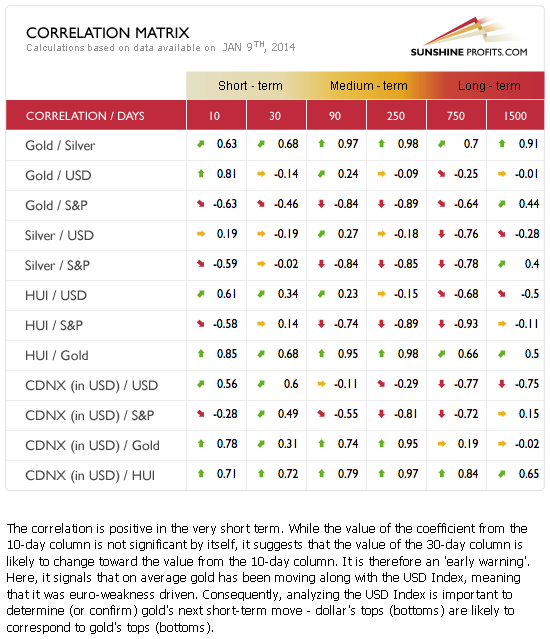
The values of the correlation coefficients have changed since we previously commented on them. Right now we see little correlation between precious metals and the “usually related markets”: USD and the stock market.
In the case of the stock market it doesn’t say much, as the situation with respect to it is rather unclear. However, in case of the USD Index, it is at this time a sign of… strength (on a short-term basis, but still…). Since gold, silver, and mining stocks didn’t plunge in light of dollar’s strength (they only declined insignificantly), we can expect to see more strength on a short-term basis. This doesn’t mean that the 2-year decline/consolidation in gold is over, but it does mean that we could see higher gold, silver and mining stock prices in the coming days.
Gold
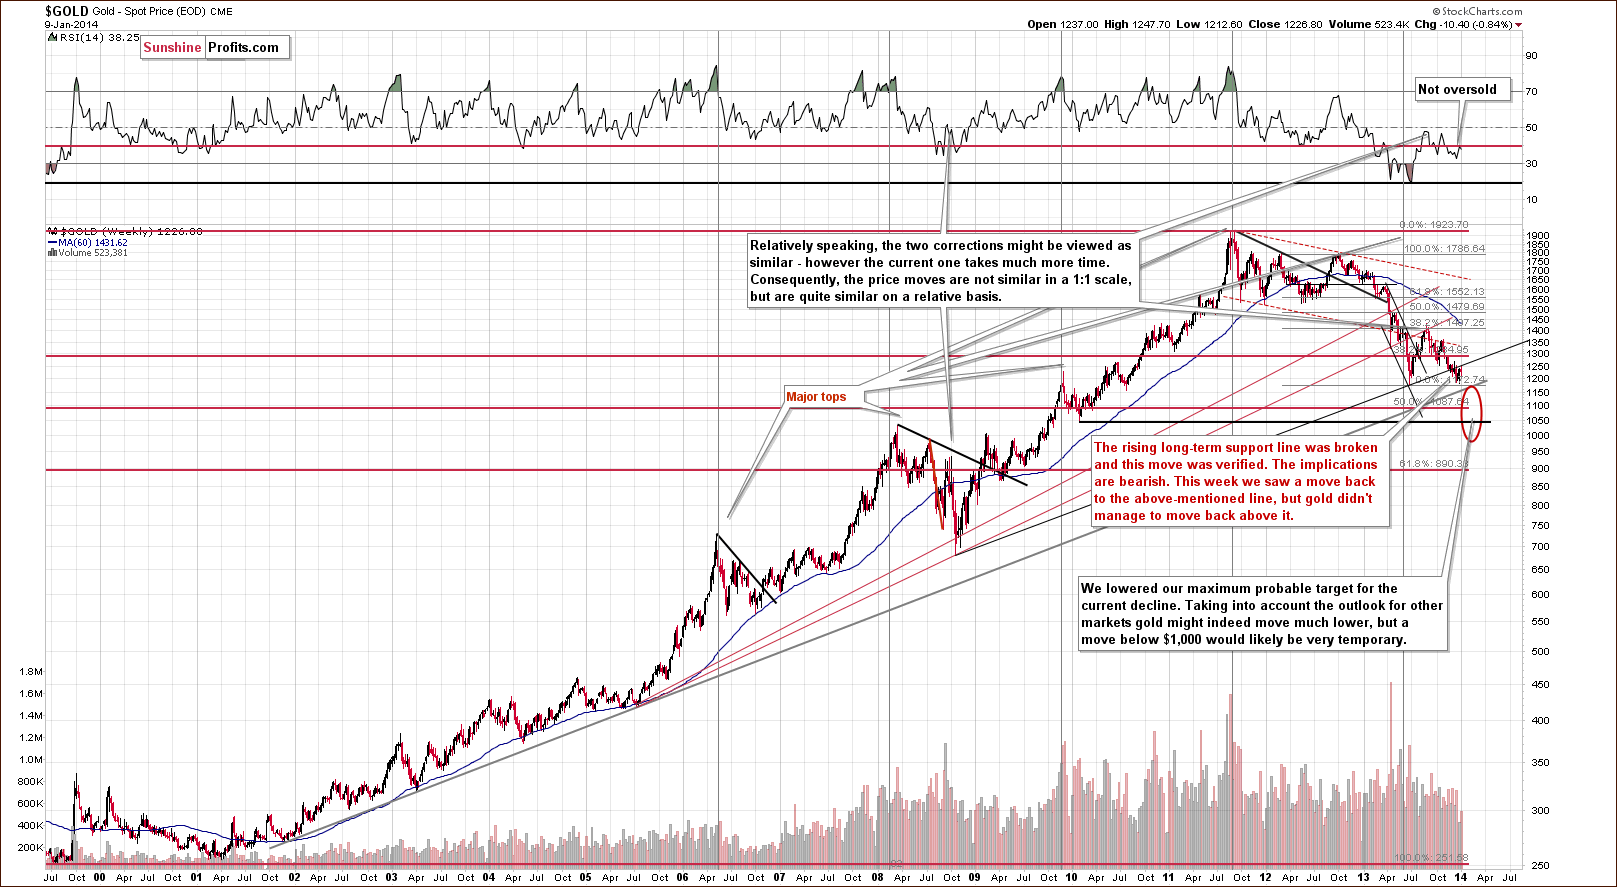
Even though a lot happened last and this week, from the long-term perspective not much changed on the gold market.
We saw a move back to the rising long-term resistance line, but gold only touched it, only to decline once again. At this time the medium-term outlook remains bearish. Any additional rally is not likely to move significantly above this level (from this perspective significantly means not more than $50 above it, which takes significant intra-day volatility into account).
Our previous comments about price targets remain valid:
Please note that the exact target for gold is quite difficult to provide. In the cases of silver and mining stocks there are respectively: combinations of strong support levels, and a major support in the form of the 2008 low. In the case of gold, there are 4 support levels that could stop the decline and each of them is coincidentally located $50 below the previous one starting at $1,150: $1,150, $1,100, $1,050, and $1,000.
Let’s move on to the short-term chart to see the recent price moves more clearly and estimate the short-term outlook.
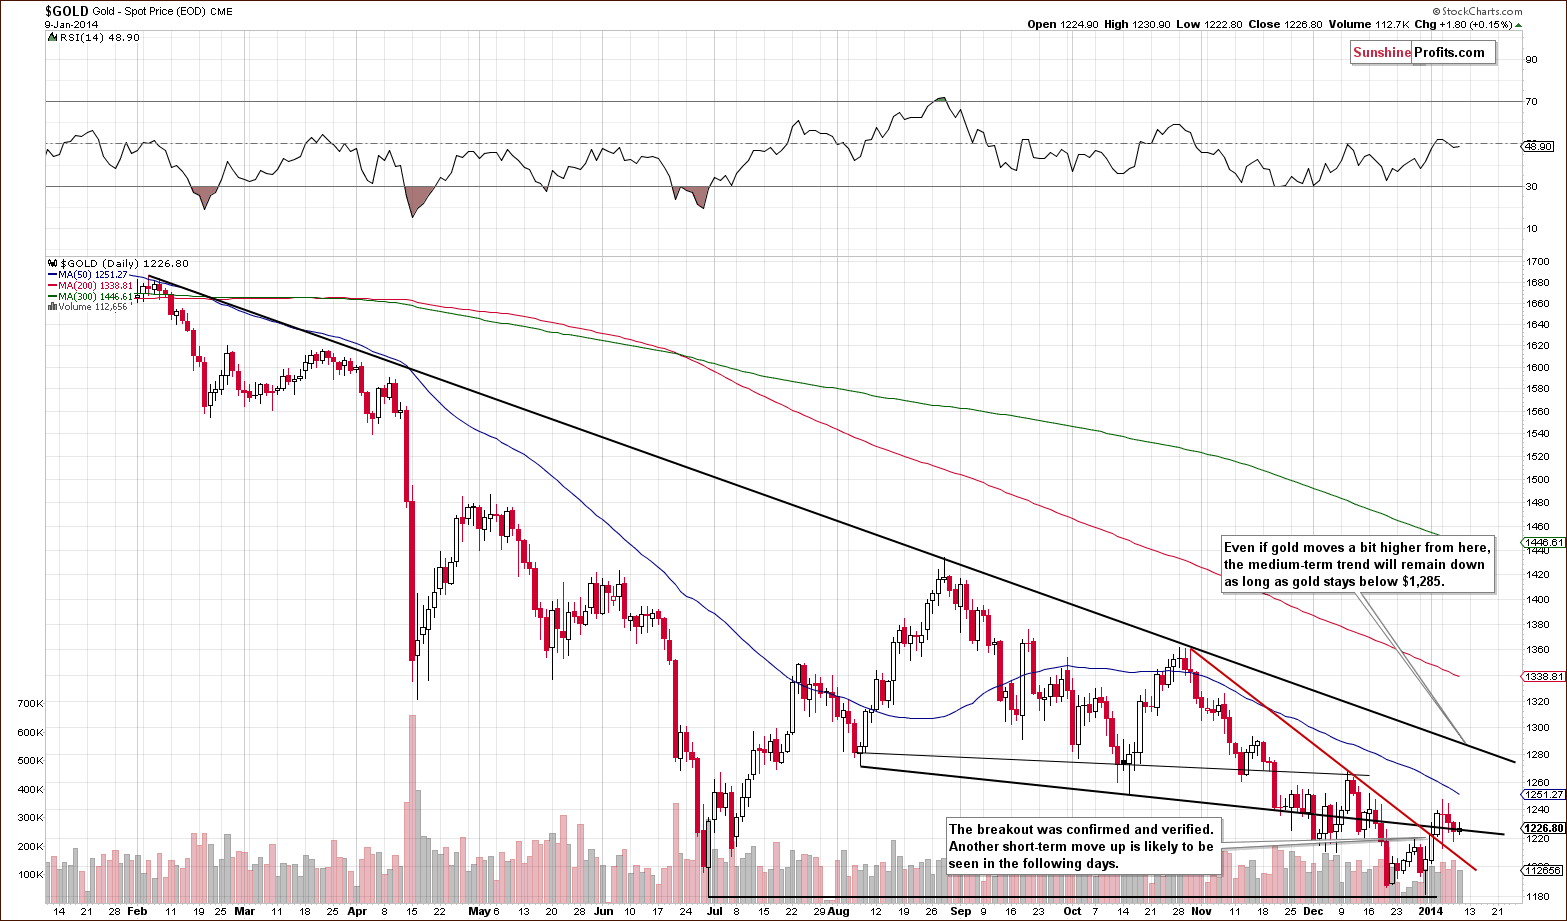
On a short-term basis gold showed strength. It rallied above two resistance lines – black and red visible on the above chart. The breakout was confirmed, which suggests that we are likely to see another move higher.
Again, this is a short-term chart, we saw strength on a short-term basis, and bullish implications are also for the short term. This means that the above doesn’t imply the start of another powerful up-leg, it simply means that we are likely to see higher gold prices in the coming days, without saying what’s likely to happen weeks from now.
Let’s take a look at the chart featuring gold’s price from the non-USD perspective.
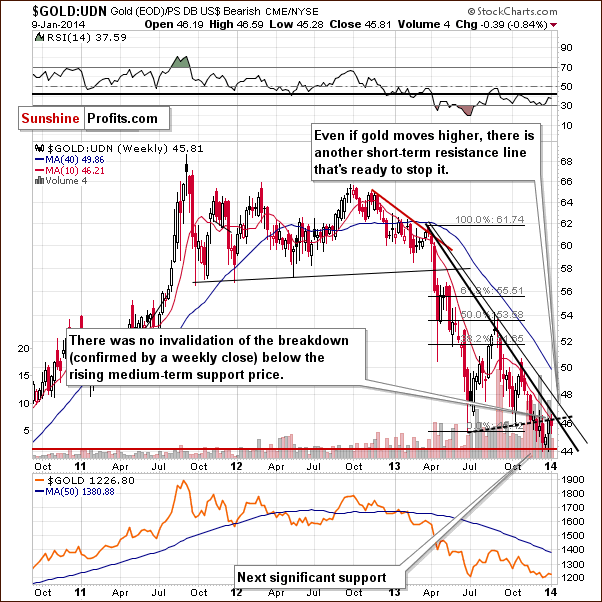
Unlike the previous chart, this one above doesn’t provide us with bullish implications. From the non-USD perspective, gold simply moved back to the previously broken support line and verified it as resistance. There was only an intra-week move above it, but the price is already back below the line, and it seems that it will close the week below it as well. Please note that in the final part of 2013 we also saw one intra-week move back above this line and this move was even more significant than what we saw this week. It too didn’t invalidate the breakdown. In fact, it was followed by a significant downswing. We can expect the situation to be quite similar shortly, if gold does indeed rally. The move higher could be temporary, and unless we have a weekly close above the rising support line (dashed line, currently close to 46), we will not have any bullish implications whatsoever.
Even if we see some strength, the ratio would have to move above 48 (where the upper declining resistance line is currently located) in order for the situation to become bullish.
Consequently, some short-term strength is clearly possible, but we don’t think that the medium-term downtrend will be invalidated.
Finishing this section, let’s take a look at the Dow-to-gold ratio.
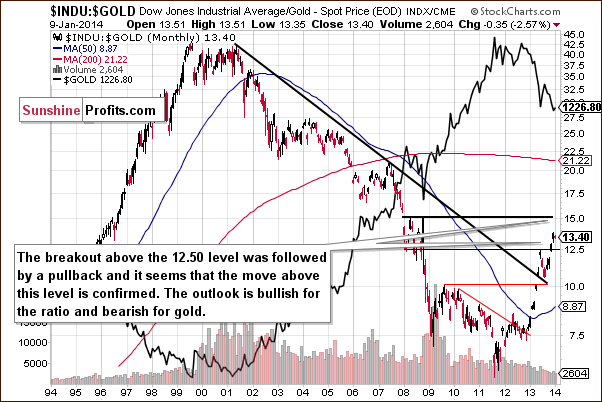
Comments on the above ratio that we made in the previous Premium Update remain up-to-date:
This ratio is one of the most important things to keep in mind when estimating the big price moves. Please note that it did a great job at predicting where the first major bottom would form this year – it corresponded to the moment when the ratio reached its strong resistance at 12.50. Gold is falling once again and likely to form a major bottom in the coming weeks. Is there a level in the ratio that could give us some guidance here? There is – the 15 level – which is where the ratio topped in 2008.
Summing up, the outlook for gold remains bearish from the medium-term perspective, but on a short-term basis we can expect to see a temporary move higher based on the breakout above the declining, short-term resistance line in spot gold. It doesn’t seem that gold will move above $1,250, and even if that happened, it would not be likely to move above $1,285 and change the medium-term trend.
Silver
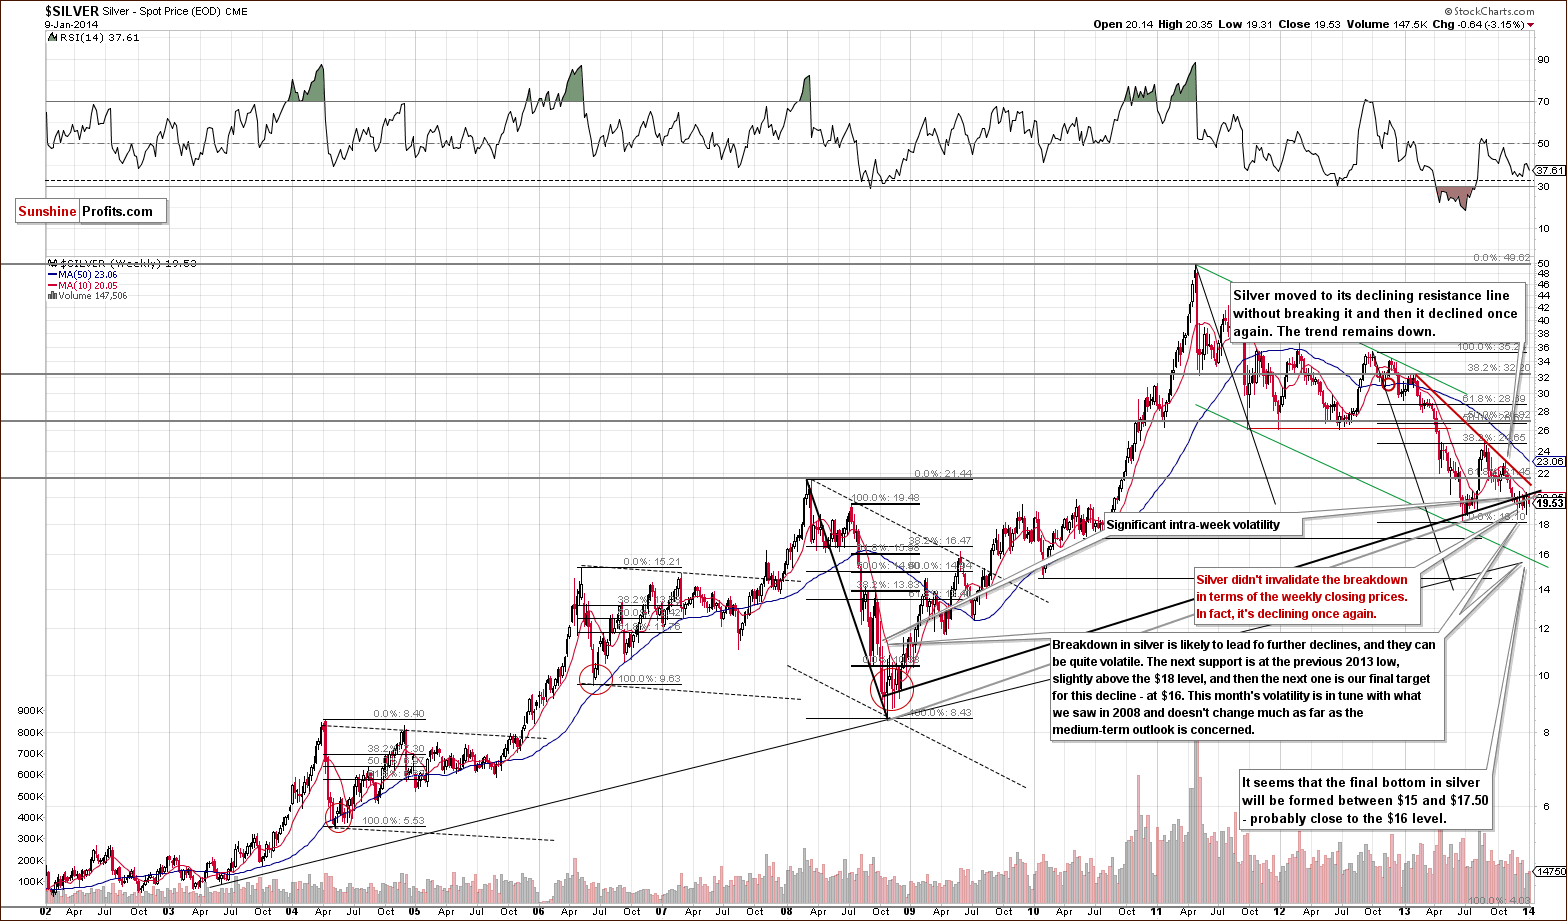
It is often said that history repeats itself (or that it rhymes) and it surely applies when we look at silver’s recent performance.
In the previous Premium Update we wrote that silver moved temporarily back above the rising support/resistance line, but didn’t manage to hold this level (…) silver gave up the gains and dropped below both long-term support/resistance lines, which triggered further deterioration.
This week, the white metal made another attempt to move back above the resistance lines, but failed to move above the upper of them and ultimately the breakdown below these lines was not invalidated.
The next downside target is the previous 2013 low, slightly above the $18 level. Once we see silver below it, the next (and probably final) stop will likely be close to $16. Overall, the trend remains down.
Let’s move to the short-term chart to see the very recent price moves more clearly.
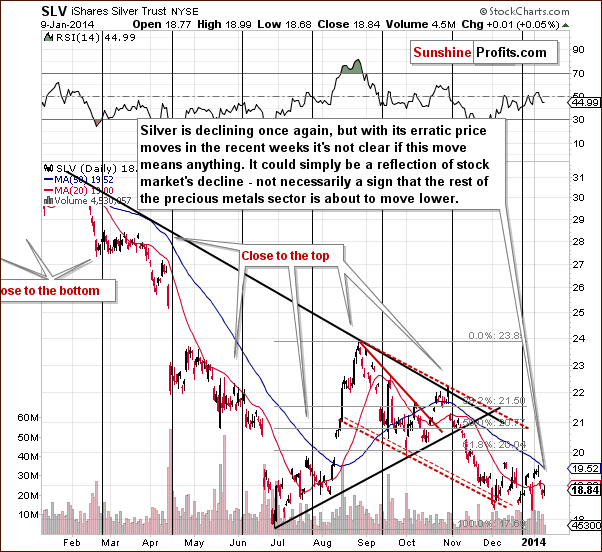
We have previously mentioned silver’s proximity to its cyclical turning point. We have indeed seen a sharp drop right after silver was at this point, but it was followed by another rally, and then by another decline. Overall, silver’s performance is quite erratic – it moves higher and lower in a volatile fashion, but without a clear direction.
Please note that one of the description boxes on the long-term chart mentions white metal’s volatility in the final part of the downswing. There’s no doubt that what we have been seeing in silver recently can be described as significant volatility.
Summing up, silver didn’t invalidate the breakdown below the key resistance lines, and thus the medium-term trend remains down. However, given silver’s back-and-forth performance in the recent weeks, we can’t rule out another move higher before the next big move down materializes.
Palladium
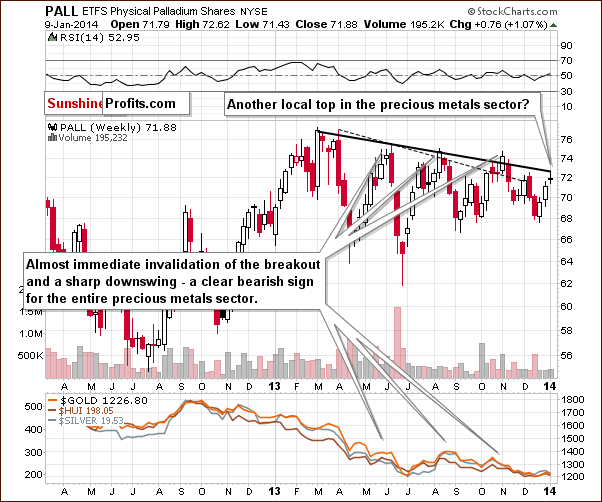
Earlier this week we commented on palladium’s performance as something that was giving us clues regarding the next significant move in the precious metals sector. In the January 7 Market Alert we wrote the following:
Palladium is approaching its declining support [resistance] line. It moved to or slightly above this line 2 times in the past several months: in August and late October. It meant that a local top was very close in both cases.
On the above chart you can see just that. Palladium is at its resistance line once again, and since this has previously meant that a local top is in or quite close to being in, we can expect the next significant move in the precious metals sector to be down.
Gold & Silver Mining Stocks
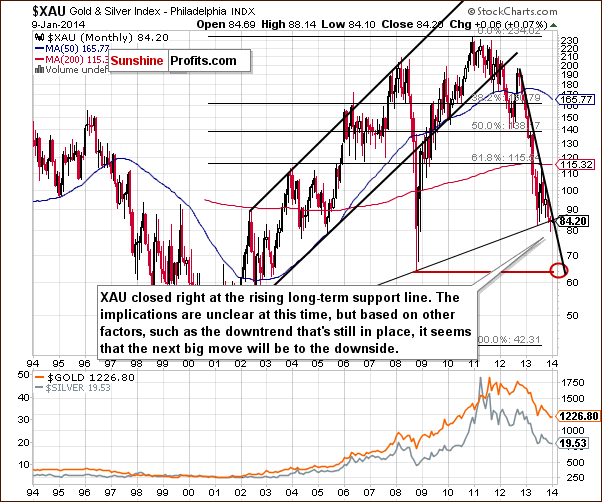
Just like a week ago, we will start the mining stocks section this time with the XAU Index chart (proxy for gold and silver mining stocks). After a major breakdown below two critical support levels: the long-term rising support line and the 2013 low and unsuccessful attempts to move back above these levels, mining stocks moved not only back above their previous low measured in intra-day extremes, but also above the rising long-term support/resistance line.
Was the breakdown below the latter invalidated? Not really, as the XAU Index closed right at this line, and the previous move higher was tiny. Moreover, the declining resistance line (thick, black line) was not invalidated, so the downtrend remains in place.
Overall, not much changed on the above chart, though it seems that a lot has happened. The medium-term outlook remains bearish.
Let’s move on to the HUI Index chart to see if we can spot any meaningful bullish indications there.
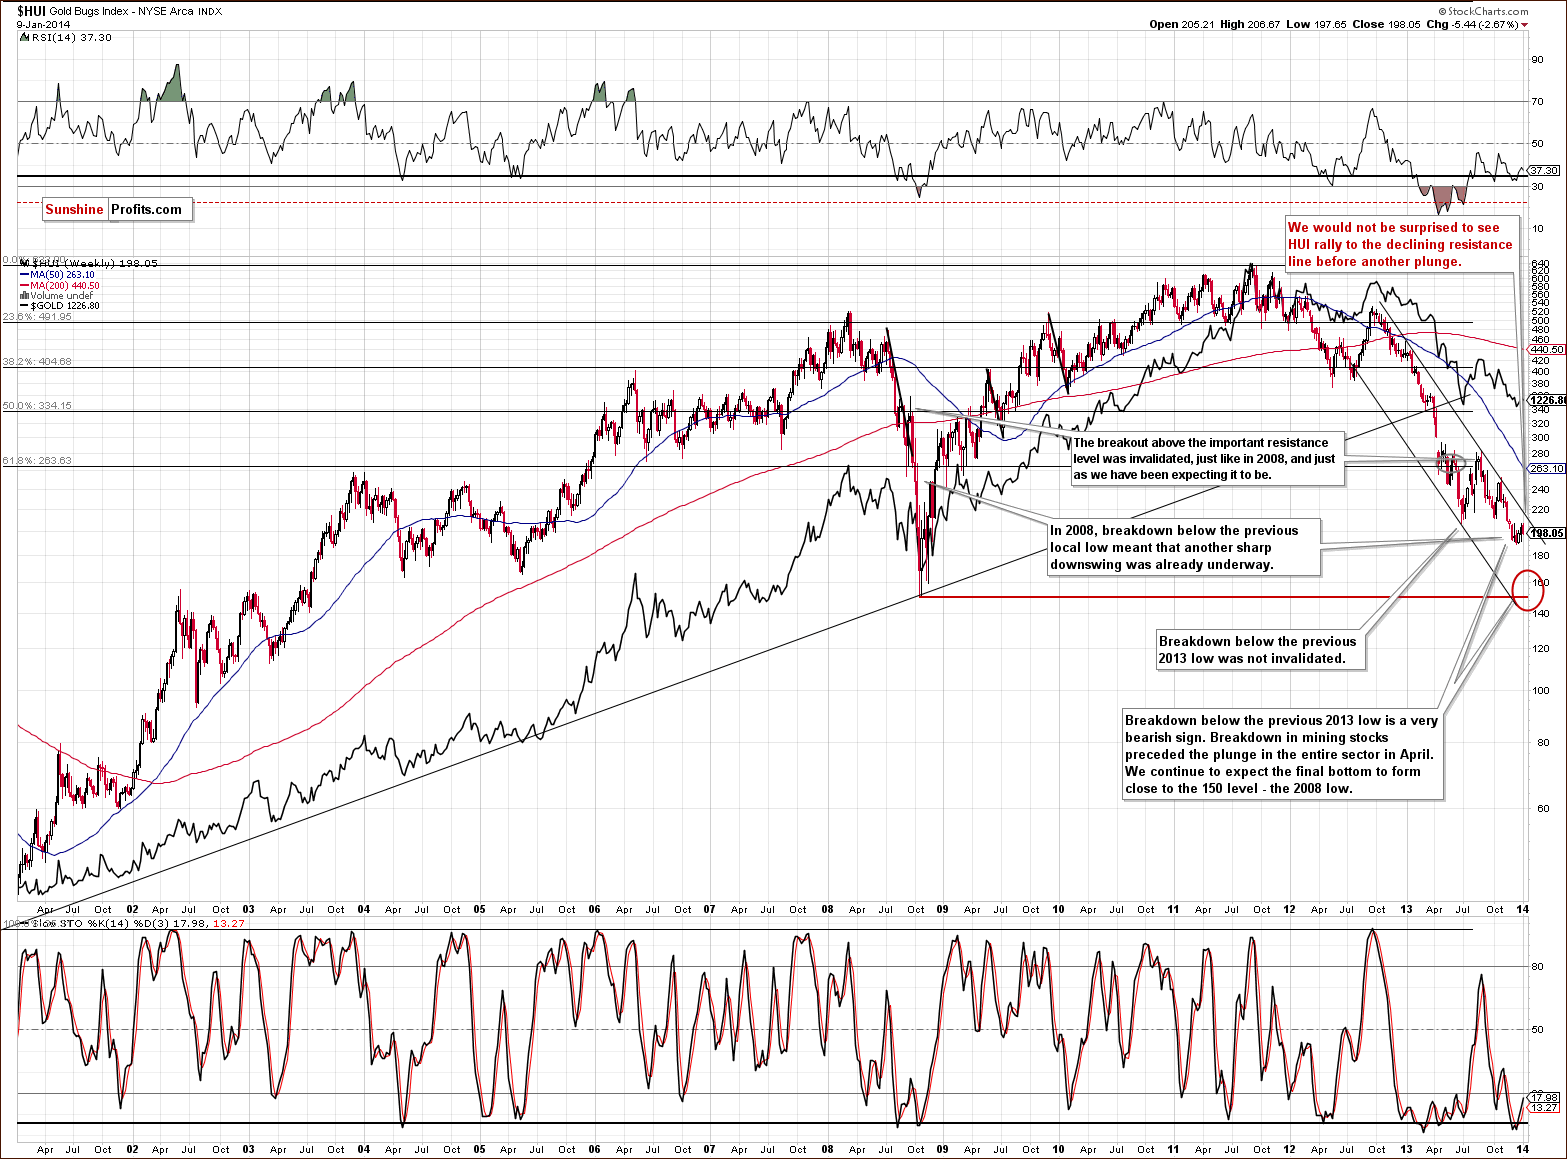
Gold stocks are very close to their mid-2013 low, but they remain below the declining resistance line – something similar to what we saw on the previous chart featuring the XAU Index.
Consequently, we could see a move higher here, up to the resistance line (currently close to 215) and still remain in a medium-term downtrend. A short-term move higher is possible, but we don’t expect a major move up just yet.
As mentioned previously, we expect the final bottom to be seen close to the 150 level. Please note that, approximately, it would only take a repeat of the October – December decline from the current levels for the above-mentioned target level to be reached (approximately).
Let’s examine the short-term GDX ETF chart.
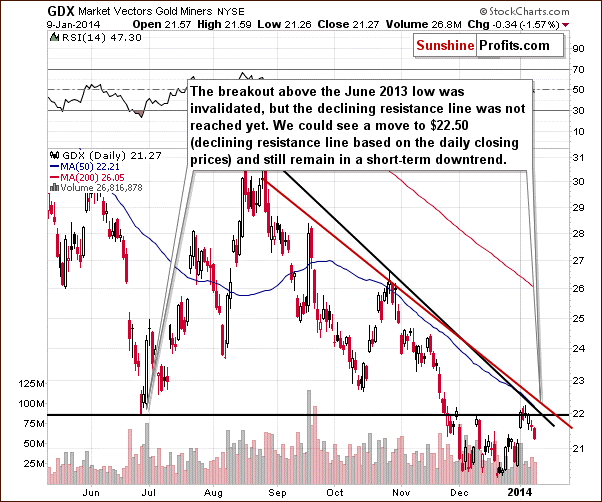
The GDX ETF, a proxy for the mining stocks sector, declined recently, but it has done so after rallying sharply on significant volume. Consequently, the move lower that we saw recently, seems to be a correction, and not the beginning of another decline – at least not yet.
However, another move higher is not likely to take miners a good deal higher. The declining resistance lines will likely keep the rally in check and the upper of them is currently close to $22.50, which means that we could see a $1 move higher without invalidating the downtrend. Even if this level was invalidated, the next significant resistance would be just around the corner in the form of the October 2013 low.
Overall, the above chart seems to be saying similar things to what the other charts mentioned previously are saying – that we could see a small move higher, but that this would not likely change much.
Finally, we would like to discuss the current situation on the gold stocks to gold ratio.
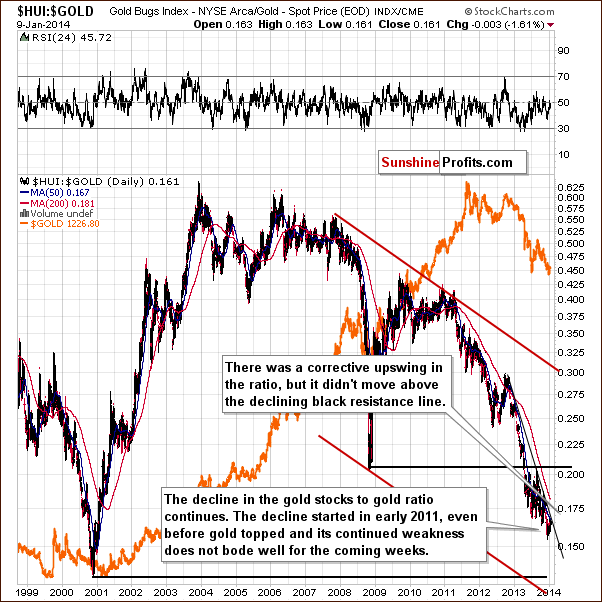
Similarly to what we saw last week – the trend simply remains down and suggests that the next big move will be to the downside.
The ratio moved higher in the past weeks, but it remains below the declining resistance line. We would like to stress that it’s not at this line, so there is some room for the ratio to rally without invalidating the downtrend.
Summing up, the medium-term trend remains down, but it seems that another rally is quite likely to be seen. The rally is not likely to change the medium-term trend, though, which remains down.
Letters from Subscribers
Q. What potential impact does the situation described in this article have on precious metals prices?
A. The economic slowdown in China would be a negative fundamental factor for the precious metals prices, but it seems to us that investors are already discounting such scenario and that's why we're still seeing a prolonged consolidation on the market.
However, if China's economy suffers and it becomes official, more investors will be inclined to sell precious metals as the above would mean less demand for PMs. Companies seeing less demand for their products would decrease purchases of the raw materials, such as gold and silver.
On the other hand, if there is a sudden crisis in China, then it could push prices of precious metals higher - people would likely buy them as a safe haven.
Overall, the above doesn't invalidate the analysis based on the long- and medium-term trends.
Q&A: We were once again asked to comment on Dennis Gartman's 2013 idea to "buy gold in terms of yen", so here we are.
As far as the gold trade is concerned, yes "owning gold in yen terms" was better than "owning gold in dollar terms" (but it was even better to be out of the market). However, we stick to what we wrote about this trade earlier. Gold is the same piece of metal regardless of what currency you decide to value it in. It has the same physical properties, and it has the same monetary history.
The only thing the phrase "in yen terms" implies is entering a forex trade on the USD/JPY market. It's not a gold investment. It's limiting your gold investment and diversifying it with a forex investment. We have no problem with that - in fact diversification is the way to go, but this should not be framed as a special type of gold investment on its own.
Think about it: if you had $10k for this trade, you could either buy gold for $10k, or buy gold for $5k and enter a $5k forex trade. Of course, you could lever it up using futures, but that's not the point. The point is that you would limit your exposure to the gold market by 50%.
Consequently, while holding "gold in yen terms" (= holding gold and entering a forex trade) was better than owning gold in dollar terms, we think it was not a good thing to do for those who were willing to invest in gold (please remember to ignore the benefit of hindsight when estimating whether it was a good idea or not since the outcomes were uncertain - the forex trade was not a sure bet back then).
Of course, the above regards the long-term investment capital - a significant position. With short-term trades, or with speculative capital, managing your cash positions is a different story, and we think it’s generally a good idea to diversify into forex. However, we think that forex transactions should be viewed as "cash management" (and in terms of our suggested portfolio structure are part of the "speculative/trading capital"), not as "gold investment".
Summary
Gold, silver and mining stocks showed great strength recently, and the recent decline seems to be a correction or consolidation before the next move higher. However, the key thing to remember here is that the medium-term trend remains down and that the key medium-term resistance lines are not very close to where we see metals and miners right now.
This means that another rally could be seen and that a relatively small one would not invalidate the bearish outlook. This is the scenario whose attributes have the highest probability of being realized in the coming days.
It seems that gold will not go above $1,250, and that the HUI Index will not go above 215 (it’s difficult to provide analogous price levels for the rest of the precious metals market), and even if the yellow metal moves higher, we don’t see it moving above $1,285 before another significant drop.
To summarize:
Trading – PR: No positions.
Trading – SP Indicators: No positions: SP Indicators suggest long positions, but the new self-similarity-based tool suggests short ones for the precious metals sector. We think that overall they cancel each other out.
Long-term investments: No positions.
| Portfolio's Part | Position | Stop-loss / Expiry Date |
|---|---|---|
| Trading: Mining stocks | None | - |
| Trading: Gold | None | - |
| Trading: Silver | None | - |
| Long-term investments: Gold | None | - |
| Long-term investments: Silver | None | - |
| Long-term investments: Platinum | None | - |
| Long-term investments: Mining Stocks | None | - |
This completes this week’s Premium Update. Our next Premium Update is scheduled for Friday, Jan 17, 2013.
Thank you for using the Premium Service.
Sincerely,
Przemyslaw Radomski, CFA

