
- Lessons for the Future
- The Gold Market – Investors' Sentiment
- USD and Euro Indices
- General Stock Market
- Correlation Matrix
- Gold
- Silver
- Mining Stocks
- Scenarios
- Letters to the Editor
- Triggers that would make us go back in with the investment capital
- Additional information
- Summary
Lessons for the Future
In the last Market Overviews (and also to a considerable extent in the last several Premium Updates) we have discussed in detail differences between tapering and tightening. As we have stated, a personal change of the Fed’s chairman will not change the essence of its policy. Now we hear that some form of tapering will indeed happen. Despite this we have three varied tools to consider about some forms of backing out from its expansive policies:
- Federal funds rate
- Government bond purchases
- MBS purchases
The history since 2007 tells us that the short-term interest rate is lying safely at the bottom. All Fed’s press releases since the end of 2008 indicate to us that they will stay that way. Since Fed’s officials finally got bored with giving dates that are constantly prolonged, we finally received some precision: interest rate hikes may come if the unemployment is below 6,5 percent, and/or the official inflation rate is over 2 percent. Let us emphasizes again the word "may". Those conditions are not here, and even if they were, still it does not automatically mean that the hikes would happen.
Before the interest rates are raised, the asset purchases tool will be settled. First, let’s contemplate government securities purchases. Will they be permanently reversed? With all those nice programs extended and initiated by president Obama, we doubt that. The history since 2009 tells us that purchases were slowed down, but not reversed. The public spending tells us that they probably won’t be completely reversed in the near future. The public debt tells us that they will not be stopped. One thing that could indicate decreases of government bond holdings are yields on government bonds. At least this was the case until May of 2013. In the last testimony of the Fed we learned that purchases are to be slowed down from 45 billion to 40 billion. Not a sparkling change, really.
In terms of bond returns the policy of boosting government bonds holdings has been a major “success”. The monetary pumping worked – the newly created money went indirectly into the Treasury. For the 10-year government bonds, yields were brought down from 5 percent in 2009 to 2.6 percent in May of 2013. Then the reversal in yields happened, probably because of possible “tapering” hanging in the air. Under these circumstances we are back at levels similar to mid-2011. And in mid-2011 the Fed was holding on to government assets. Since the yields of over 3 percent are back we do not expect to see major shifts in this part of Fed activity, even if number “5” is to be seen somewhere (that is a difference between 45 and 40 billion of asset purchases).
Another likely candidate for tapering were asset purchase operations performed on MBS. Here the Fed decided to buy 35 billion each month instead of the previously declared 40, to thus slightly reduce the holdings. Yet as all Fed representatives signaled to us, these are not to be major changes but minor adjustments.
But, most importantly, this will not mean the reversal of the easy money policy. Easy monetary policy is still the only option on the table. All that is being debated by Fed’s officials are the ways and means of easy monetary policy. Not the essence.
The above is based on Matt Machaj’s, PhD, Dec 2013 Market Overview report.
The Gold Market – Investors' Sentiment
We would like to discuss more thoroughly something that we have been mentioning from time to time – gold investors’ sentiment. It’s bad, but is it bad enough to strongly suggest that the bottom is already in? Let’s take a look.
More precisely, we would like to comment on two reports that came out recently that are likely to impact the precious metals market: World Gold Council's Q3 Gold Demand Statistics and the results of the 2014 CFA Institute Global Market Sentiment Survey (as a CFA Charterholder, your Editor was one of the professionals that were surveyed).
In short, these reports confirm what we have been writing from time to time. The investor sentiment toward the gold market is very bad, which indicates that the final bottom might be near. It's generally wise to establish long-term positions when everyone hates a given asset. Gold, silver, and especially mining stocks are definitely good candidates. There are some details that might point us in the right direction as far as estimating the price range for the final bottom is concerned.
There are two things that we would like point out in the World Gold Council report: the continued shift in demand from West to East and the dynamics in the investment demand.
Historically, investors in the East tend to buy at low prices and sell at high prices – the above suggests that we are moving close to the bottom in gold. This is a very general and imprecise trend that doesn't provide us with much insight as far as timing is concerned.
When it comes to the investment demand, we saw an improvement over the previous quarter (please see the page 14 of the report for details), but it's not necessarily bullish, as we should have seen even greater improvement based on how the demand increased from the second quarter of 2012 to the third quarter of 2012. It increased by 48.4% and since the investment demand amounted to 129 tonnes in Q2, we should see 129*1.484 = 191.436 tonnes in the third quarter just to make the increase the same. We saw 185.5 tonnes – slightly less. Consequently, not only is the improvement from the last quarter not bullish info, but it can be viewed as bearish one as the increase was smaller than it was just a year ago.
What does the above tell us? That the investor sentiment is already bad and therefore – as contrarians – we should focus on timing the bottom with the long-term investment capital, as it's probably close. Again, this doesn't provide us with many details, just a general overview of the current trend.
Now, as far the outcome of the CFA Institute's survey for investment professionals is concerned (this survey was conducted from 2 to 17 October 2013. 6,561 CFA Institute members filled the survey), there is one particular question for which we find the replies particularly interesting. The question was what asset class is expected to provide the highest return in 2014. The choices were: equities, commodities, precious metals, cash, and bonds. Here are the results:
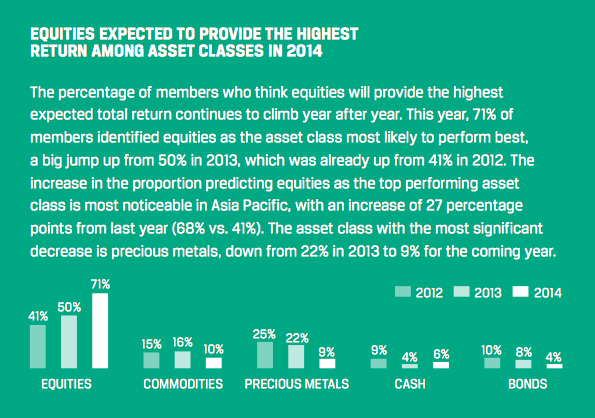
The outlook became very optimistic for 2014 – 71% of professionals think that stocks will provide the highest return. Every other asset class (except cash, which didn't change much) got fewer votes. The most dramatic decline in the outlook was seen for the precious metals market. There number of professionals that expect PMs to outperform decreased by more than half. In fact, last year, when there was an analogous question about 2013, these professionals voted for precious metals as the second asset class of their choice. Last year, the portion of professionals who thought that stocks would outperform was only a little more than twice as big as the number who thought that precious metals are likely to outperform. This year there are almost 8 times more professionals who think that stocks will outperform.
Let's keep in mind that people who filled out this survey are quite often responsible for managing substantial capital and/or can influence others to take action. Consequently, the above numbers are quite likely representative and tell us about the attitude of a large number of market participants. The price move in 2013 was quite significant and it convinced 22% – 9% = 13% of pros to change their mind about the precious metals sector. This number can go down only to 0, theoretically – when too many people become bearish about a given asset class this indicates that we are at a major bottom and a powerful upswing will be seen (regardless of whether it marks the beginning of a big new uptrend or not).
The gold price dropped about $400 between when pros took the survey in 2012 (the question about the outlook for 2013) and in 2013 and 13% of them changed their mind about gold's outlook. The relationship doesn't have to be linear, but in case it is, that's (400 / 13) one percent every $31 or so. If the bottom is to be formed when, say only 3% of pros view gold as the likely-to-outperform asset, then we might need another $186 decline that would correspond to a 6% decrease (again, assuming a linear shape of the relationship, which is a very rough approximation). Gold was close to $1,280. When answers to this year's survey were collected, they would imply a move to $1,100 or so before the final bottom is reached.
As mentioned above, the linear shape of the relationship is a big assumption here, and another one is that the bottom would be formed when 3% of pros remain very bullish. If it was to form when only 1% of them are bullish and the relationship was more negative than implied by the linearity assumption, then we would have gold close to $1,000 at the final bottom.
Consequently, the final bottom is not yet in, but it's not that far away either.
On a side note, only 4% of professionals see bonds outperforming other asset classes, but this doesn't necessarily imply that this market is about to move much higher. The key thing to keep in mind is the inverse relationship between bond prices and interest rates. With the Zero Interest Rate Policy in place in the US along with already open-ended Quantitative Easing programs it's no wonder that the general consensus is that the rates will not move even lower and thus that bonds are unlikely to move much higher – and even if, they are not likely to outperform the stock market.
Summing up, the sentiment toward gold among professionals and the general investment public is bad and suggests that we should see a major bottom not far from where we see gold today. There are some approximate indications that gold should bottom (at least temporarily and ignite, at least a temporary, yet significant, upswing) in or close to the $1,000 - $1,100 range. This confirms what we can infer based on the technical analysis of the long-term gold chart, which further increases the credibility of this estimation.
Still, on a short-term basis, anything can happen. Consequently, let’s examine the charts and see what’s likely to take place in the coming days and weeks (charts courtesy of http://stockcharts.com).
USD and Euro Indices
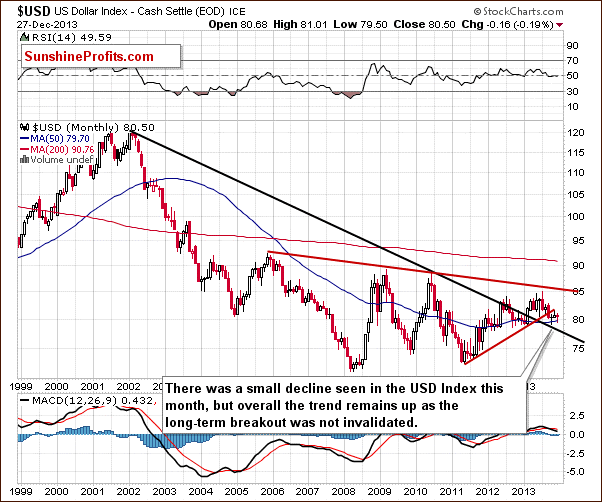
On the above chart, we see that the situation hasn’t changed much since our previous Premium Update was published and what we wrote at that time remains up to date.
Despite a small decline that we have seen since the beginning of the month, the uptrend remains in place as the breakout above the declining long-term support line was not invalidated.
Now, let’s examine the weekly chart.
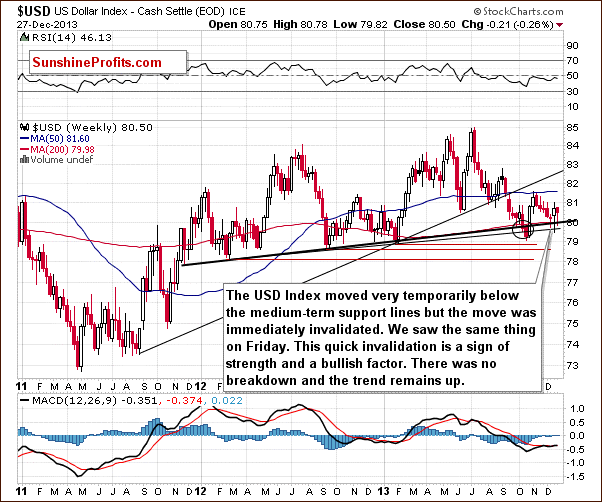
Looking at the above chart, we see that at the end of the week we had a similar situation to those that we saw earlier in December. Like a week ago, the USD Index broke below the medium-term support line based on the February 2012, September 2012 and January 2013 lows (a bold black line), but once again this deterioration was only temporary. The dollar quickly rebounded and invalidated the breakdown below this medium-term support/resistance line, which is a sign of strength and a bullish factor. At this point, it’s worth mentioning that this time the USD Index didn’t decline to the lower medium-term line based on the September 2012 and the January 2013 lows (a thin black line), which confirms the strength of the buyers. From this perspective, there was no true breakdown and the trend remains up.
Let’s check the short-term outlook.
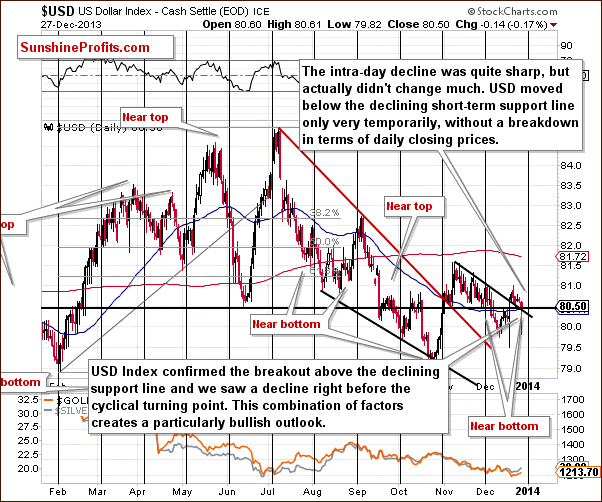
Looking at the above chart, we see that the USD Index extended its rally and moved higher breaking above both resistance lines (the horizontal support line based on the June low and the declining short-term resistance line) after our previous Premium Update was published. Although, the greenback gave up the gains and declined in the following days, it confirmed the breakout above the declining short-term support/resistance line. At this point we would like to draw your attention to the fact that although Friday’s intraday decline was sharp, it actually didn’t change much. The U.S. dollar moved below the declining short-term support/resistance line only very temporary, without a breakdown in terms of daily closing prices, which is a positive signal. On top of that, this decline materialized right before the cyclical turning point.
This combination of factors creates a particularly bullish outlook and it could be the case that another rally in the U.S. dollar is just starting.
Let’s now take a look at the long-term Euro Index chart.
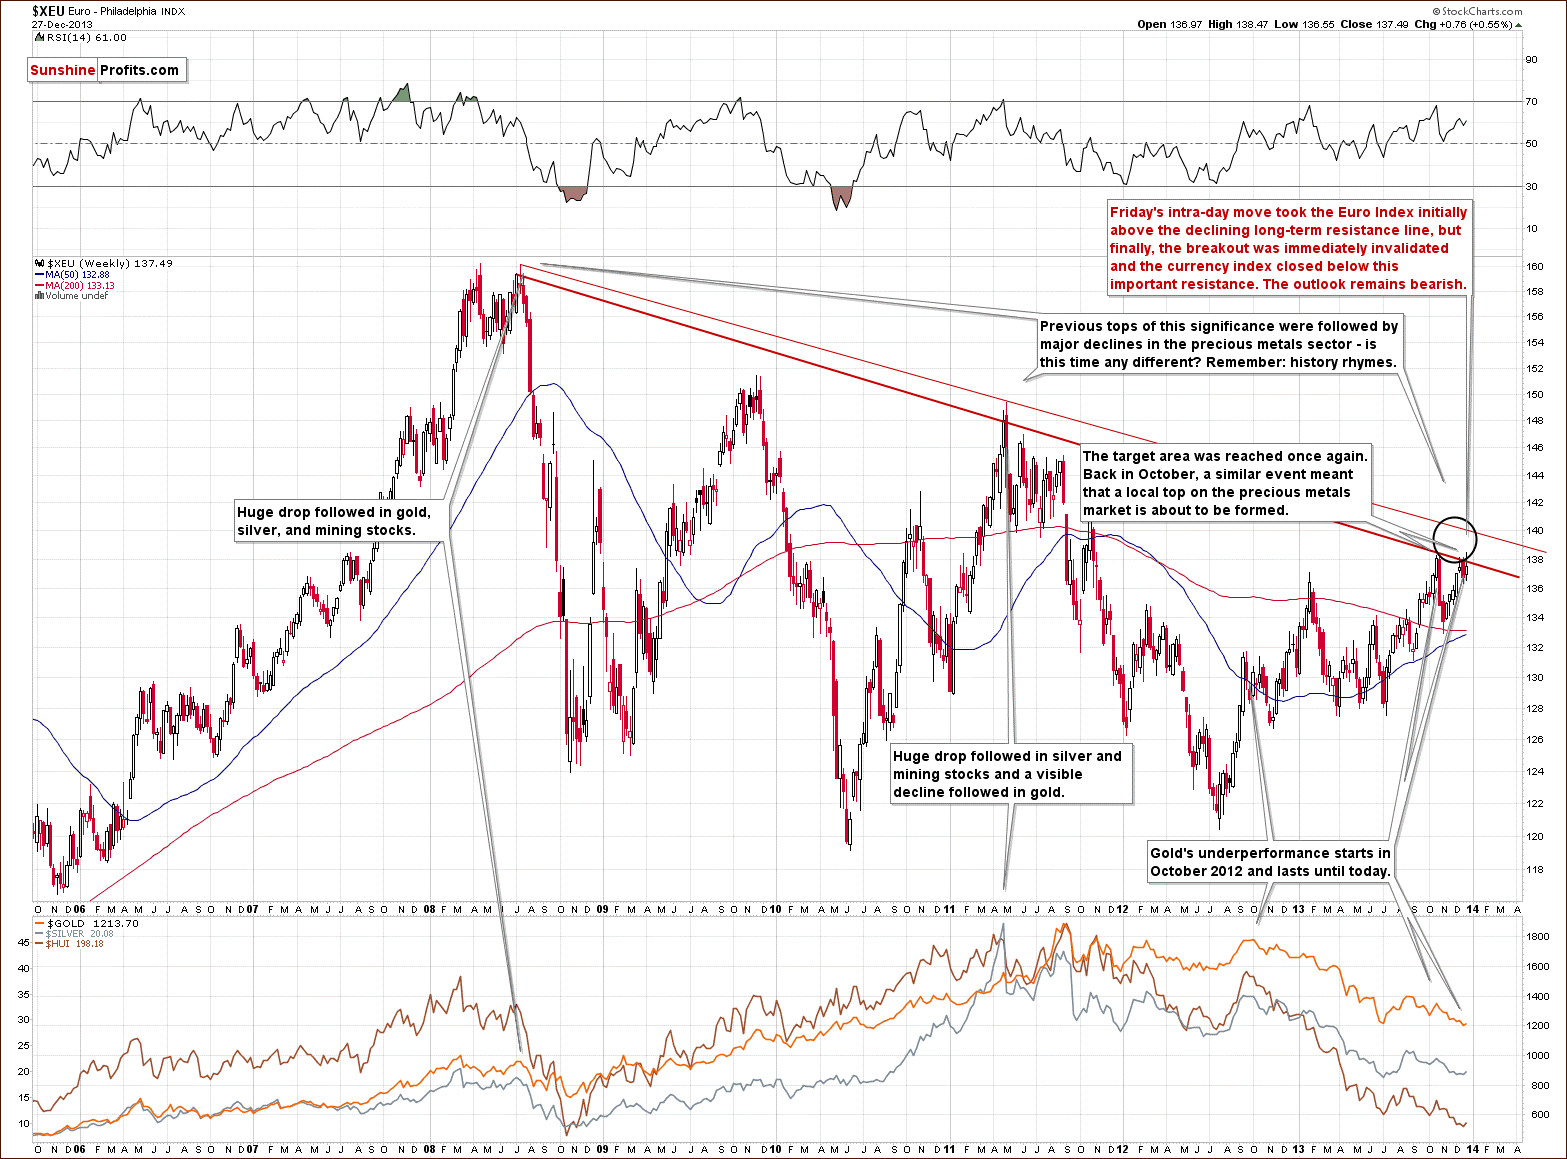
The first thing that catches the eye on the above chart is the target area, which was reached once again. As you can see on the above chart, Friday’s intraday move took the Euro Index not only above the October high, but also the long-term declining resistance line based on the 2008 and the 2011 highs (in terms of weekly closing prices). However, as it turned out in the following hours, this improvement was only very temporary and finally, both breakouts were immediately invalidated. The currency index closed below these important resistance levels, which is a bearish signal and the outlook remains bearish.
What’s most interesting, gold didn’t follow that rally, which suggests that we’ll likely see further deterioration– similarly to that seen in the past.
In our previous Premium Update we wrote the following:
(…) a similar situation preceded a local top in precious metals. On top of that, previous tops (in 2008 and then in 2011) were followed by major declines in the precious metals sector. If history repeats itself we may see similar price action in this situation.
Please take a moment to compare euro’s performance in the past few weeks with the performance of the precious metals sector (lower part of the above chart).
Summing up, looking at the current situation in both currencies, we are likely to see further deterioration in the Euro Index and improvement in the USD Index in the near future. As mentioned earlier in this section, the euro almost immediately invalidated both breakouts, which is a bearish signal. Additionally, the USD Index reversed course after a drop below the medium-term support lines (to be precise: similarly to what we saw last week, there was no true breakdown overall) and it seems that the bottom for this decline might already be in. On top of that, gold's lack of will to really (!) react to positive news – like dollar's huge intra-day drop is a bearish piece of information on its own and an indication that gold is likely to move lower in the short run – it seems that all it needs is a rally in the USD Index, which – as you can see above – will likely be seen shortly.
General Stock Market
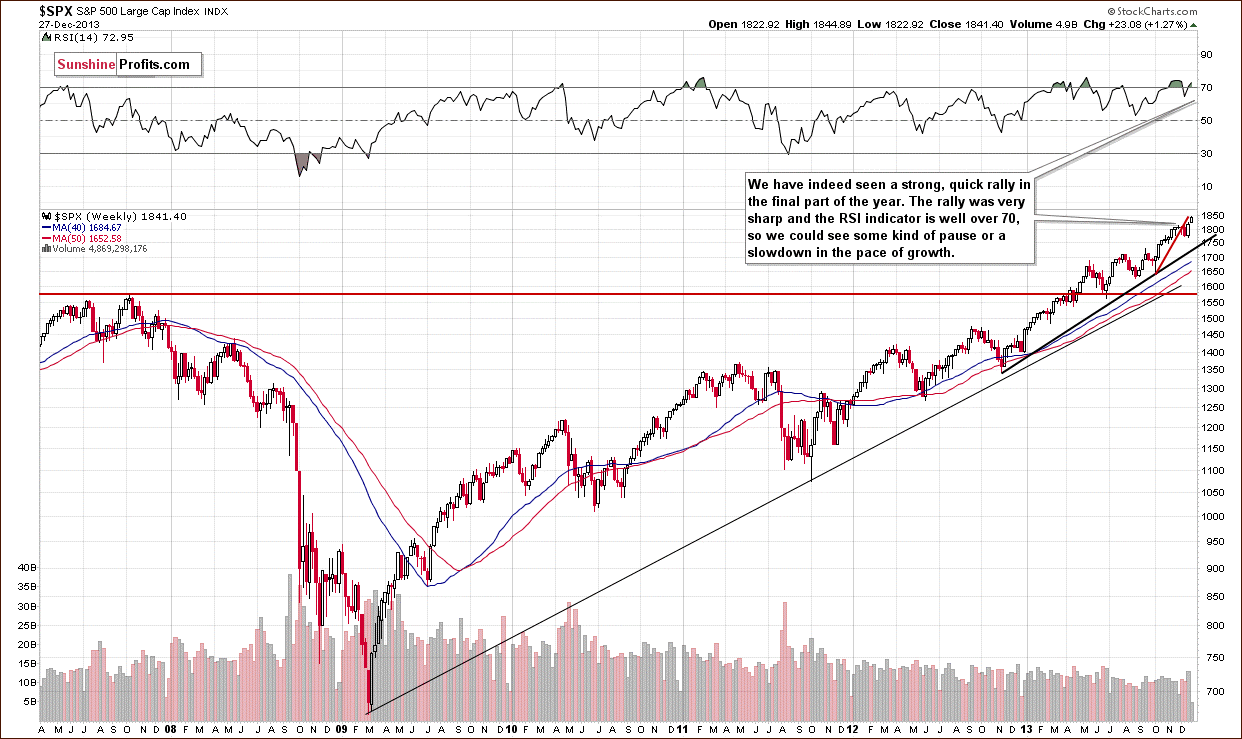
Quoting our previous Premium Update:
(…) after a consolidation, the S&P500 Index rallied strongly after Fed’s announcement and came back above the psychological barrier of 1,800. These circumstances may mean that another rally in stocks is just around the corner even though the index remains below its short-term rising support line that was broken earlier this month.
On the above chart, we see that we did have such a price action in the previous week. Since the beginning of the week, the S&P500 Index has rallied strongly and quickly. With this upward move, the index hit a new all-time high at 1,844. The rally was very sharp and as you can see, the RSI indicator is overbought (well above the level of 70). Therefore, we could see some kind of pause or a slowdown in the pace of growth – especially when we factor in the proximity to the previously-broken short-term rising support line.
Let’s move on to the short-term chart.
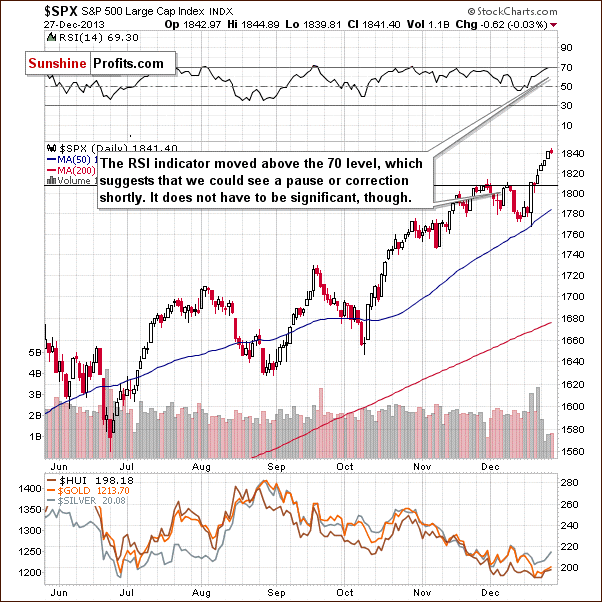
In our previous Premium Update we wrote the following:
(…) stocks broke and closed above the previous closing prices. Although the breakout is small and not really meaningful without a confirmation (we prefer to wait for 3 consecutive closes above a given level for the breakout to be verified) we notice that it materialized on a large volume, which suggests that the next move will also be to the upside and the breakout that we saw on Wednesday will be confirmed.
Looking at the above chart, we clearly see that the index rallied sharply in the previous week. Day after day we saw higher closing prices and the above-mentioned breakout was quickly confirmed, which was a strong bullish sign. These circumstances encouraged buyers to act and resulted in a four consecutive white candlesticks and, as mentioned earlier, a new all-time high.
When we take a closer look at the above chart, we see that the RSI indicator moved above the level of 70, which suggests that we could see a pause or a correction in the coming days. However, it doesn’t have to be significant.
Summing up, the outlook for the general stock market is bullish, but we may see a pause or a correction shortly.
Gold & Silver Correlations
Let’s take a look at our Correlation Matrix to find out how the can above translate into precious metals and mining stock prices.
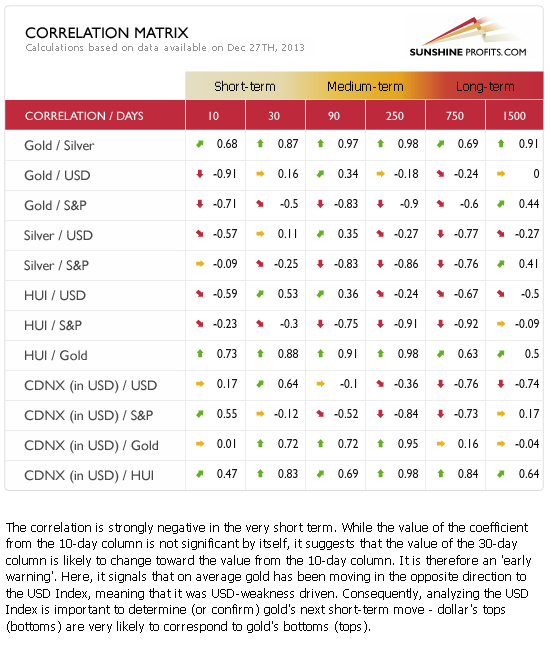
The values of the correlation coefficients are basically unchanged from last week, so we will quote our previous comments – they are up-to-date:
Basically, the short-term numbers don’t tell us much at this time when we look at them directly, but can tell us something if we look a bit beyond them.
The correlation between the USD Index and the precious metals sector is slightly positive in the 30-day column (and even moderately significant in the case of the mining stocks), which tells us that in the past 30 days PMs and the USD Index moved on average in a similar direction. However, this was the case when they both declined – and when USD moved higher (this week), metals and miners declined even more. This is a very bearish combination – whatever USD does, the precious metals sector seems to either decline modestly or strongly.
We can see a similar relationship in the case of the general stock market. Precious metals and mining stocks rather ignore positive news, but react strongly to negative information.
Overall, the implications for the precious metals sector are bearish.
Gold
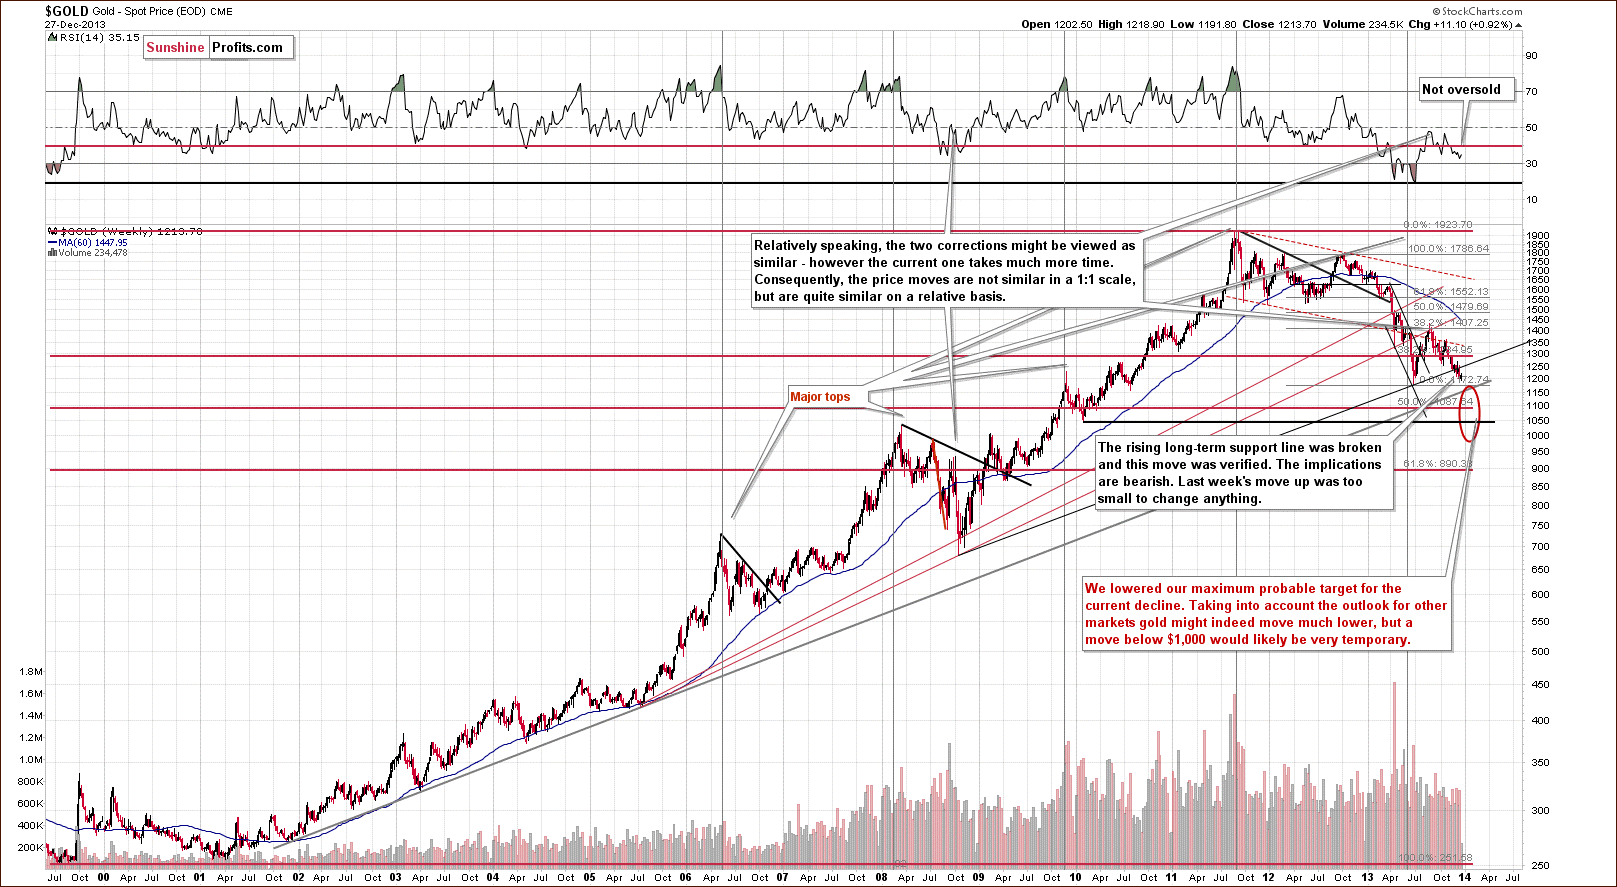
Generally, from the long-term perspective not much changed on the gold market. What we wrote in our previous Premium Update remains up-to-date:
Gold didn’t manage to successfully climb above the rising long-term support line (not to mention staying above this line), which triggered a sharp decline. With this downward move, the yellow metal not only declined below last week’s low, but also slipped below the level of $1,200. These circumstances clearly show the weakness of the buyers and it seems that the previous 2013 low will be reached quite soon.
(…)
Please note that the exact target for gold is quite difficult to provide. In the cases of silver and mining stocks there are respectively: combinations of strong support levels, and a major support in the form of the 2008 low. In the case of gold, there are 4 support levels that could stop the decline and each of them is coincidentally located $50 below the previous one starting at $1,150: $1,150, $1,100, $1,050, and $1,000.
Let’s move on to the short-term chart to see the recent price moves more clearly and estimate the short-term outlook.
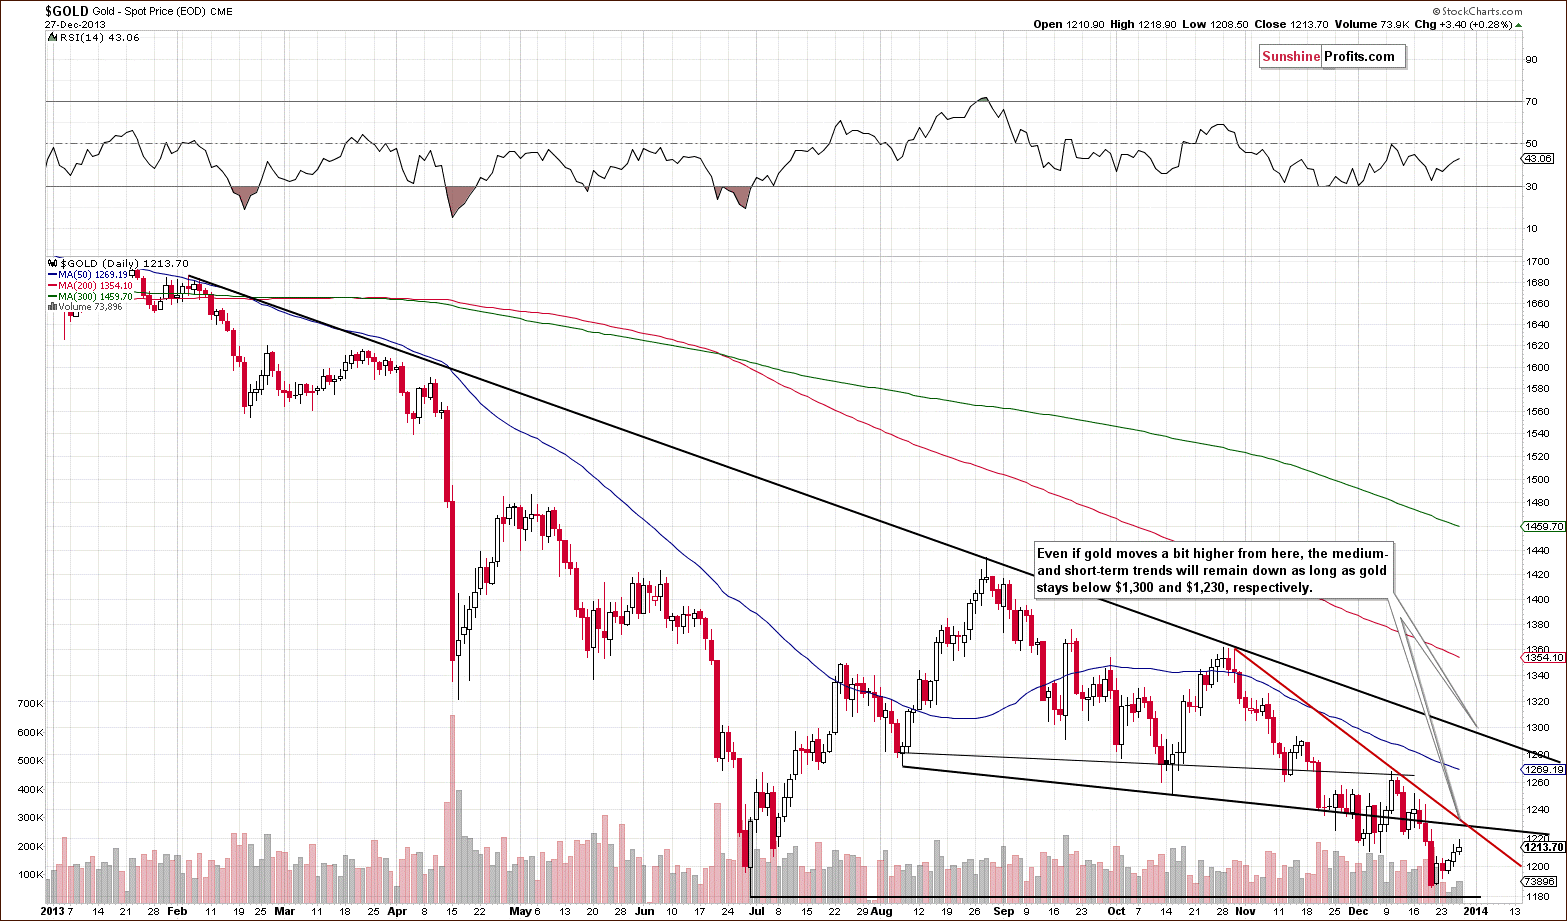
Last week we wrote that the decline that we had seen materialized on the rising volume, which confirmed the strength of the sellers. Taking this fact into account, we wrote that we were likely to see another significant move shortly. At the same time we warned that once we move to the previous 2013 low, we could see some kind of correction or a pause.
It looks like that’s exactly what we saw this week – a correction. Gold didn’t move above any meaningful resistance line, and thus the outlooks (short-, medium-, and long-term) didn’t change. The move materialized on relatively low volume, which might be partly explained by the fact that exchanges were not open in some parts of the world, but still, it's hard to view a move higher as bullish when so few investors contributed to it.
Please note that while gold is quite close to the June 2013 low, the RSI indicator is much above its June 2013 levels. Back then, this indicator signaled a heavily oversold situation and now it is quite close to the middle of the trading range – far from suggesting an oversold condition. In other words, another sizable decline here should not surprise us.
Let’s take a look at the chart featuring gold’s price from the non-USD perspective.
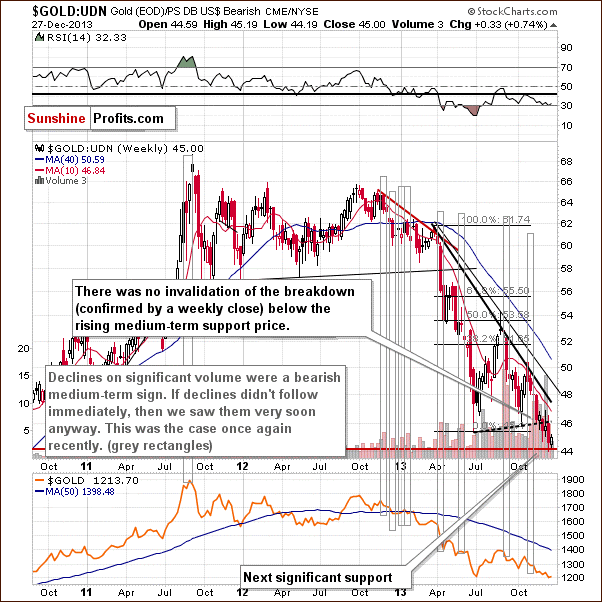
Basically, this week’s move up was not present from the non-USD perspective. Generally, it was not really the case that gold rallied, but rather that the US Dollar, in which gold is priced, moved lower. The trend in gold remains down.
Let’s move on to the chart of gold priced in the British pound and in terms of the euro.
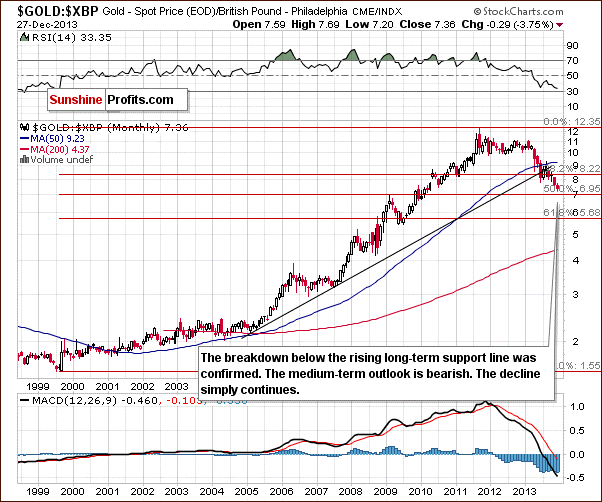
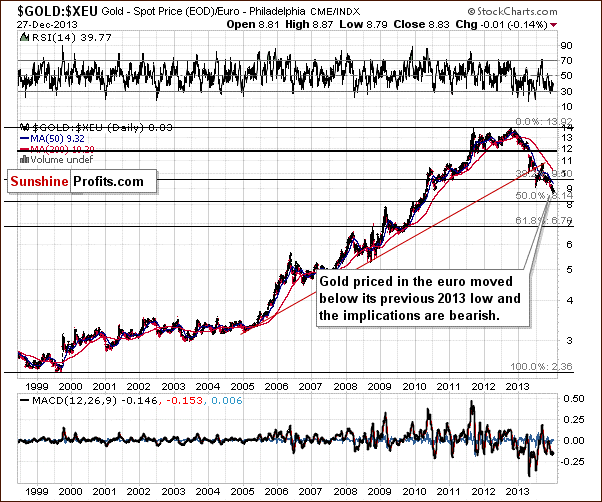
From both perspectives, the decline in gold simply continues. There was no significant move up to speak of recently. Downtrends remain in place and the outlook remains bearish.
Finishing this section, let’s take a look at the Dow-to-gold ratio.
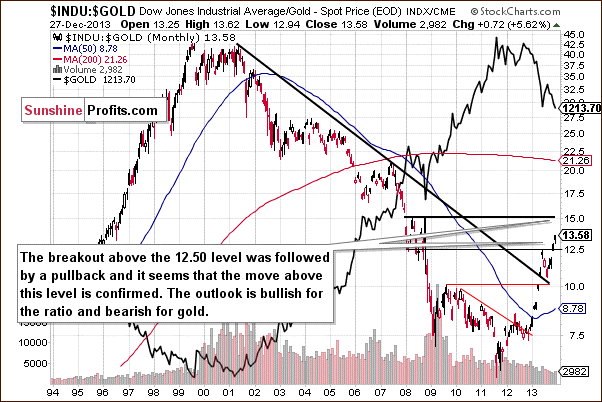
Last week’s comments on the above ratio remain up-to-date:
This ratio is one of the most important things to keep in mind when estimating the big price moves. Please note that it did a great job at predicting where the first major bottom would form this year – it corresponded to the moment when the ratio reached its strong resistance at 12.50. Gold is falling once again and likely to form a major bottom in the coming weeks. Is there a level in the ratio that could give us some guidance here? There is – the 15 level – which is where the ratio topped in 2008.
Summing up, the outlook for gold remains bearish from the medium- and short-term perspective. Gold was likely to correct after moving to its previous 2013 low, and it has. It now seems that the move up is already over or quite close to being over. At this time it’s still hard to give the exact target for gold itself, but it seems that gold will bottom when it’s 15 times less expensive than the value of the Dow Jones Industrial Index (Dow to gold ratio moves to 15) – probably with gold close to the $1,100 level.
Silver
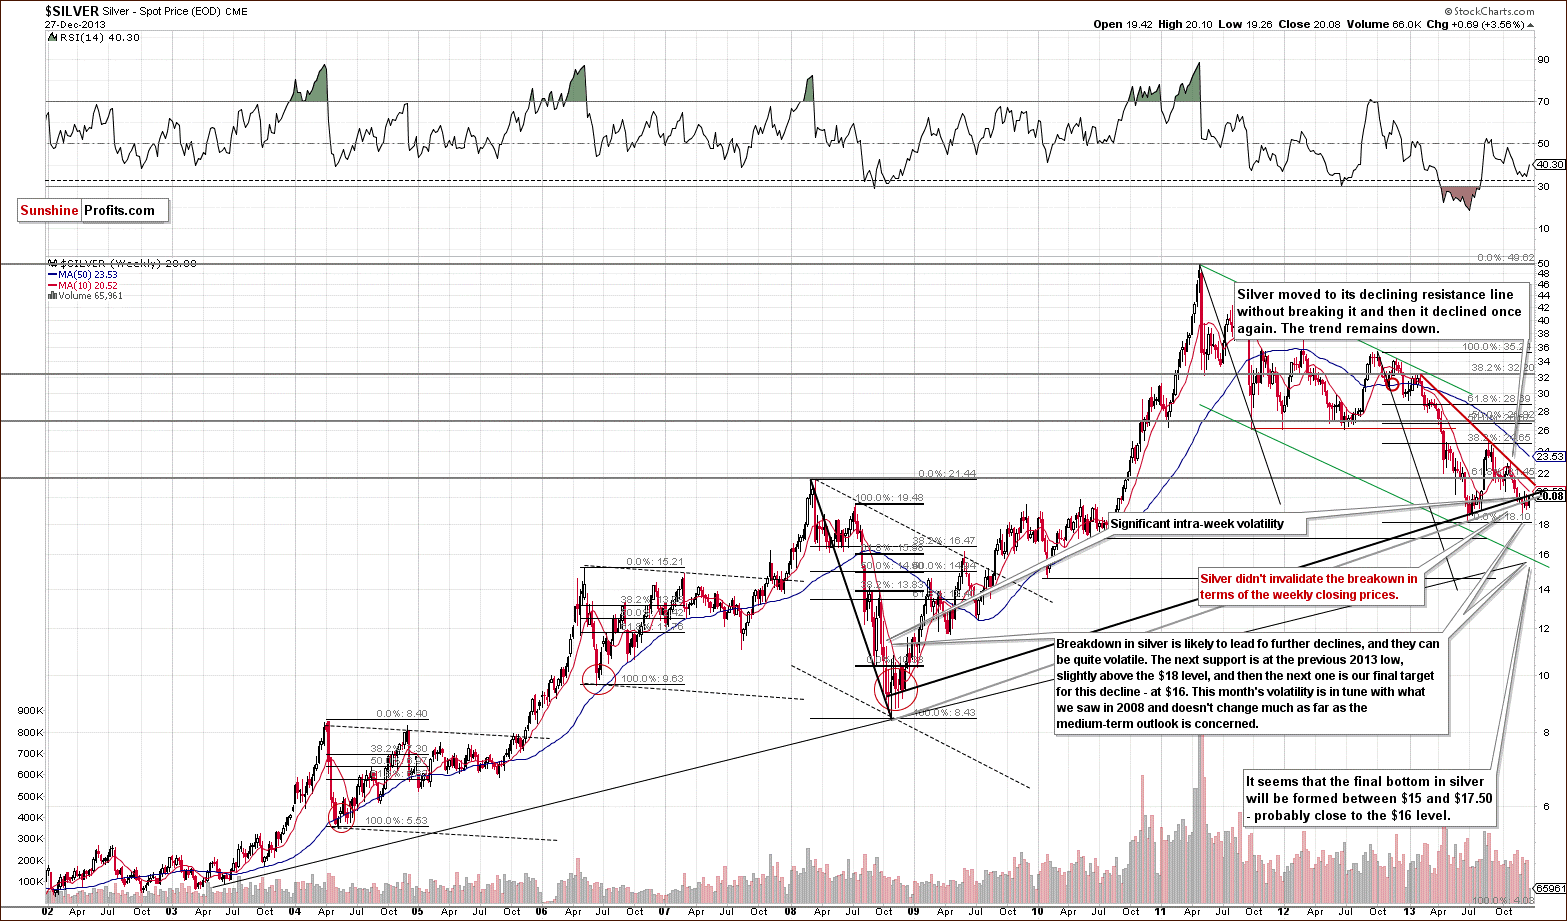
In the previous Premium Update we wrote that silver moved temporarily back above the rising support/resistance line, but didn’t manage to hold this level – similarly to what we saw in the case of gold. Just like the yellow metal, silver gave up the gains and dropped below both long-term support/resistance lines, which triggered further deterioration.
Last week, the white metal made another attempt to move back above the resistance lines, but failed to move above the upper of them even given USD Index’s intra-day decline on Friday.
The next downside target is the previous 2013 low, slightly above the $18 level. Once we see silver below it, the next (and probably final) stop will likely be close to $16. Overall, the trend remains down.
Let’s move to the short-term chart to see the very recent price moves more clearly.
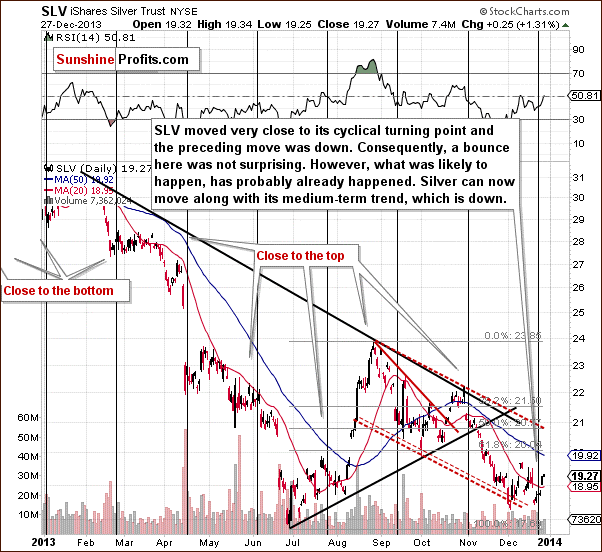
The most important thing that we can discuss from the short-term perspective is silver’s proximity to its cyclical turning point. Last week we commented on it by writing that a pause or bounce (meaning a move higher) should not surprise us. It didn’t and since it’s already a fact, we can expect the trend to continue. The trend is down, so big surprises should still be to the downside.
Summing up, the move higher that was likely to happen based on the cyclical turning point is probably already behind us. There was no invalidation of the breakdown below the long-term support/resistance line based on the weekly closing prices – even despite this week’s move up. While silver is still the least predictable on a short-term basis of the gold, silver and mining stocks trio, the medium term trend seems to be down and thus positioning yourself not to be hurt by significant declines seems to be a good thing to do.
Gold & Silver Mining Stocks
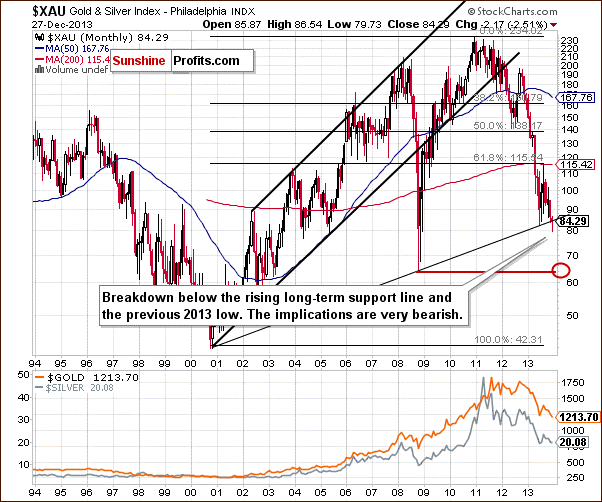
Just like a week ago, we will start the mining stocks section this time with the XAU Index chart (proxy for gold and silver mining stocks). After a major breakdown below two critical support levels: the long-term rising support line and the 2013 low and unsuccessful attempts to move back above these levels, mining stocks moved back above their previous low measured in intra-day extremes.
This doesn’t change much since the breakdown below the rising long-term resistance line was not invalidated and the latter is a much more important resistance.
Let’s move on to the HUI Index chart to see if we can spot any meaningful bullish indications there.
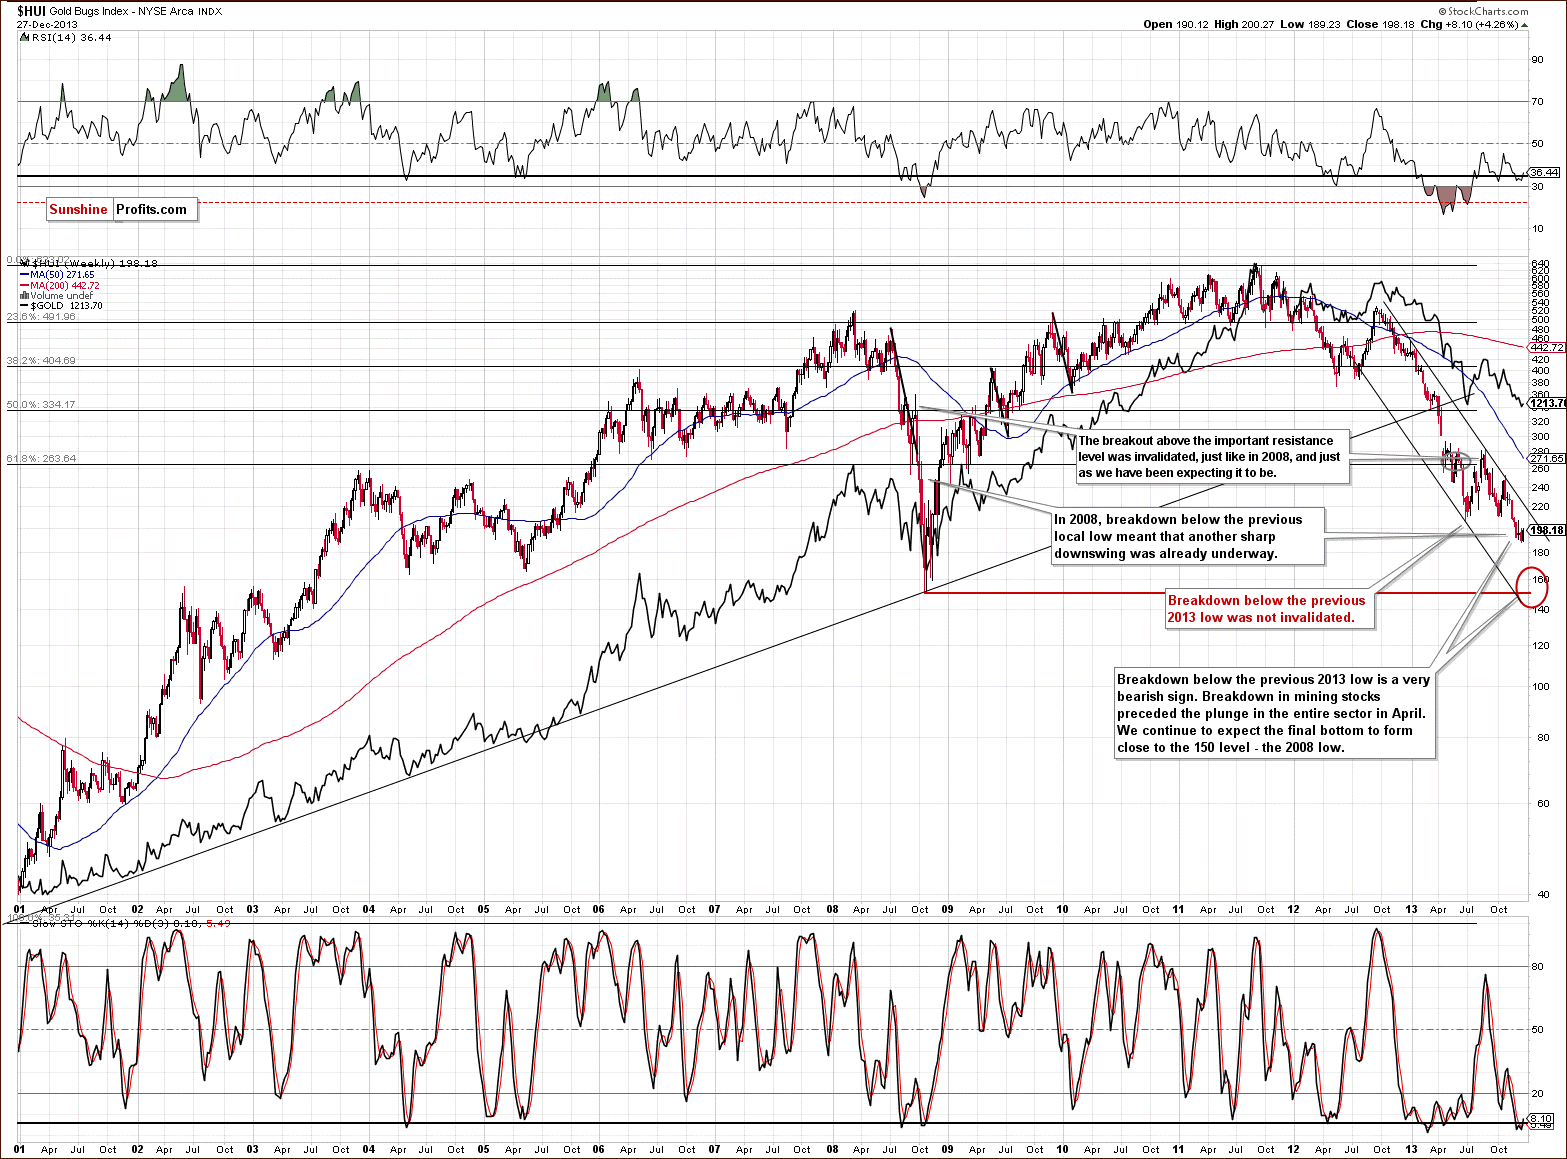
There are none. The move higher that we saw last week didn’t manage to take the HUI Index above the previous 2013 low, which is the decisive level in this index. Taking into account this fact, further deterioration should not surprise us, as the downtrend remains in place.
As mentioned previously, we expect the final bottom to be seen close to the 150 level. Please note that, approximately, it would only take a repeat of the October – December decline from the current levels for the above-mentioned target level to be reached.
Let’s examine the short-term GDX ETF chart.
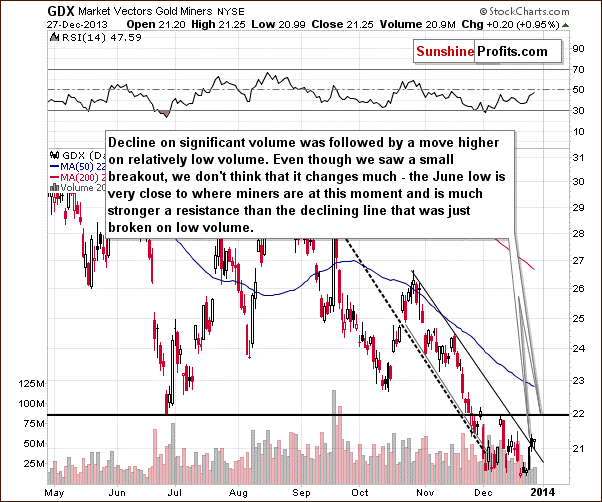
Last week we saw a tiny breakout short-term resistance line based on the November and December highs (which is also the upper line of the declining trend channel). However, this move took place on very low volume, which suggests that this breakout will not be confirmed and that an invalidation will follow.
The most interesting thing about this move is that miners didn’t manage to rally even though the USD Index moved rather visibly lower on Friday. That is a sign of weakness and we would actually not be surprised to see miners plunge even if the USD Index just moves back to its last week’s level.
Moreover, even if we see another move up, then the next – much stronger resistance is just around the corner – in the form of the June 2013 low. That’s why we put the stop-loss order for the current speculative short position in the mining stocks above the $22 level (at $22.20) – the outlook will not change as long as miners remain below their previous 2013 low. However, it seems likely that miners will not even manage to move that high – they look like they are about to invalidate the rally even above the declining resistance line.
Finally, we would like to discuss the current situation on the gold stocks to gold ratio.
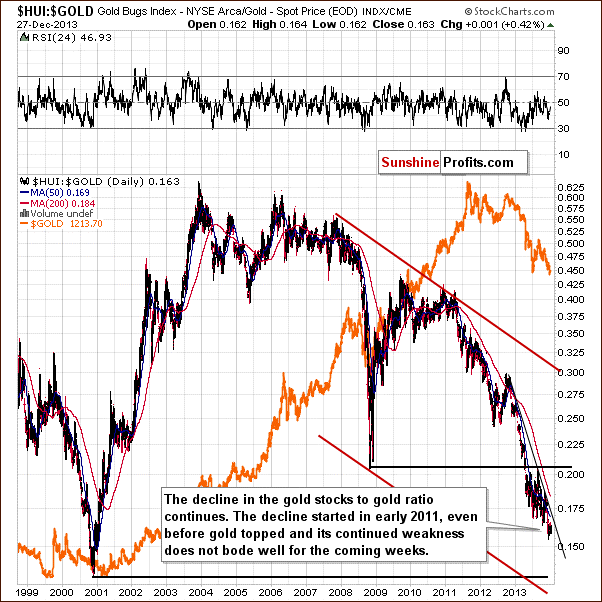
Similarly to what we saw last week – the trend simply remains down and suggests that the next big move will be to the downside.
However, it is true that the miners to gold ratio moved higher last week. Let’s examine this move on a short-term chart.
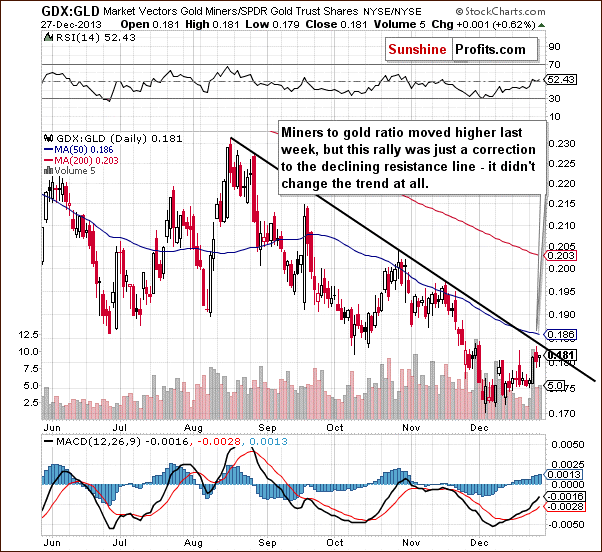
In reality, last week’s strength was just a correction to the declining resistance line. Without a breakout – and without an attempt to break out – we are not likely to see a change in the trend neither in the ratio, nor in the case of the mining stocks. Consequently, last week’s strength might have seemed encouraging, but it’s not really meaningful.
Summing up, the medium-term trend remains down, the decline is quite likely to accelerate shortly and the outlook for the mining stocks sector is very bearish. It seems that the final bottom in the precious metals sector will form when HUI and XAU Indices move to their 2008 lows and the HUI to gold ratio moves to its 2000 low.
Last week’s strength, also relative to gold, didn’t change anything as far as the trend and outlook are concerned. The only bullish factor – the small breakout in case of the GDX ETF – was very insignificant and materialized on low volume – and thus we don’t give much weight to it.
Scenarios
As promised earlier, we are letting you know in advance what kind of events would make us change our mind regarding the currently opened positions and the fact that we don’t suggest being in the precious metals market with one’s long-term investment capital. What would have to happen for us to change our mind (and in what way)? Let’s take a look.
- If silver moves to $16.30, go long (full position) gold, silver, platinum, and mining stocks
- If the HUI Index moves to 156, go long (full position) gold, silver, platinum, and mining stocks
- If the XAU Index moves to 65, go long (full position) gold, silver, platinum, and mining stocks
- If the Dow to gold ratio moves to 15 (meaning that the Dow Jones Industrial Average will be 15 times more expensive than an ounce of gold), go long (full position) gold, silver, platinum, and mining stocks
- If gold moves to $1,010, go long (full position) gold, silver, platinum, and mining stocks
- If the HUI to gold ratio moves to 0.14, go long (full position) gold, silver, platinum, and mining stocks
Any of the above would likely indicate that we are at or very close to a major bottom in the precious metals sector. It seems likely that when one of the above is triggered, other ones, or at least some of them, will also be triggered or be close to being triggered.
The above represents the scenario in which precious metals decline (the direction is likely, but it’s not likely that we will see moves to these levels this week – but we want you to be prepared anyway).
In case the precious metals market moves higher, the question remains how high would they need to move for us to suggest getting back on the long side of the market in order not to miss the next significant upswing.
- If silver moves to $26.30, go long (full position) gold, silver, platinum, and mining stocks
- If the HUI Index moves to 260, go long (full position) gold, silver, platinum, and mining stocks
- If the Dow to gold ratio moves to 9 (meaning that the Dow Jones Industrial Average will be 9 times more expensive than an ounce of gold), go long (full position) gold, silver, platinum, and mining stocks
- If gold moves to $1,340, go long (full position) gold, silver, platinum, and mining stocks
- If the HUI to gold ratio moves to 0.24, go long (full position) gold, silver, platinum, and mining stocks
Any of the above is even less likely to be reached than points from the previous list (less than 5% probability) this week, but again, we want you to be prepared should we see exceptional volatility on the market very soon.
Unless any of the above points is realized (taking both sets of points into account), we don’t suggest taking any action with one’s long-term capital – meaning staying out of the precious metals market.
Trading (speculative) capital:
This part of capital and conditions regarding it will remain just as we described in the previous Market Alert – using stop-loss levels for gold and GDX, and using only gold to determine profit-take levels.
Stop-loss orders for the speculative short position:
- Gold: $1,240
- GDX ETF: $21.60
Profit-take level (close both positions – in gold and mining stocks and take money off the table at this level)
- Gold: $1,160
Letters to the Editor
Q: I imagine the targets (e.g. HUI 150, etc.), while they have stayed the same for a while, are not set in stone, and may change as they are approached.
So long as you see no threats to the secular bull, please be conservative in your estimation of when to resume long with the long term. As you often say, the danger is being out of the market. I am always happy to lose the first and last 15% of a gain and take the middle, and I suspect I have a lot of company.
A: Yes, that’s true in the case of the long-term investment capital and, as you have read, we listed multiple triggers that would make us go back in with the investment capital. At this time, however, it seems that the market “doesn’t want” to move higher without declining first, and the move will not be that small. In our opinion it might be worth it to wait for the bottom, but if you feel better with limiting the risk of missing the next big rally even further and buy perhaps $100 or $150 from the bottom, then you are free to do so. We are not at a major top right now and buying now (or perhaps buying half now and half later) is not a very bad idea. It’s just a matter of individual preference – with a more passive approach to investments, one can enter the position earlier.
Our point here is that the price of gold is low enough for this to be a matter of preference – the most risk-averse investors might consider getting long at this time, but that’s not our official suggestion. It seems to us that there will be a better opportunity to do so.
Additional Information: Bitcoin Trading Alerts and Forex Trading Alerts
In the recent survey (thank you for participation) you told us that (among other things that will contribute to the way we provide our services sooner or later) you are indeed interested in the bitcoin and forex trading services. We are starting these services today in the “preview mode” and they will be fully launched in one week. During this week, you will have full access to both of these services. Both will take the form of daily trading alerts (+ extra alerts when the situation requires it).
We have an additional surprise for you. During this week, you will also have access to our two other premium services for traders: Oil Trading Alerts and Stock Trading Alerts (you will receive notification only about the first of the latter along with other premium alerts being posted unless you contact us and tell us that you want to receive notifications about all the other Stock Trading Alerts that are posted during the session).
All in all, on Tuesday, Thursday, and Friday (plus an additional message later today) instead of regular Market Alerts, you will receive a message per day which will include links to the latest: Stock Trading Alert, Oil Trading Alert, Bitcoin Trading Alert, and Forex Trading Alert.
Moving back to the new services – Forex Trading Alerts will be authored by Nadia Simmons, who spent countless hours (speaking of thousands) analyzing the currency markets and trading them. As you have read on numerous occasions, Nadia has expertise on the crude oil market and everything that relates to it. However, Nadia actually has even more experience in the forex markets than in the crude oil market (by the way, the only reason we started with Oil Trading Alerts, and not Forex Trading Alerts several months ago was that crude oil got more votes than currencies in our previous survey as far as providing additional services was concerned) and you will now be able to utilize and profit from this experience.
Bitcoin Trading Alerts will be authored by Mike McAra. Even though this name might sound new to you, you have already read or used multiple features of our website to which Mike contributed. You will find Mike’s short bio below:
Mike is a quantitative analyst passionate about finance and economics, particularly interested in the topics of uncertainty, investor behavior and portfolio management.
He holds two master’s degrees, the first in quantitative methods and the second in finance; he is always more interested in the reality around him than the model itself. His investment approach is grounded in empirical evidence without rejecting common sense.
With Sunshine Profits since 2009. Prior to 2014, Mike was developing innovative investment tools, verifying the usefulness of popular techniques and providing thorough internal research, contributing to many of the company’s successful ventures. His quantitative and financial background, along with experience in the gold market and a personal interest in bitcoin, naturally led to the launch of the Bitcoin Trading Alert service.
Currently, he is studying towards the CFA charter, having already passed the first exam with the highest calculated percentage range in the following areas:
- Alternative Investments
- Corporate Finance
- Derivatives
- Equity Investments
- Ethical & Professional Standards
- Financial Reporting & Analysis
- Portfolio Management
- Quantitative Methods.
During the “preview week”, new services will be posted in the Articles section on the website, and then they will be published in their own sections, respectively.
Summary
The precious metals market moved a bit higher last week, but this move seems to be rather meaningless. It was expected based on the fact that gold moved very close to its previous 2013 low and because the preceding rally in the USD Index was very sharp. Silver had its own technical reason for a rally in the form of its cyclical turning point.
We have already seen the corrective moves in both: USD Index, and the precious metals sector. These moves once again revealed precious metals’ weakness. Metals and miners didn’t move higher by as much as the USD declined and moreover, there were no significant invalidations of previous breakdowns on the precious metals market. If a significant intra-day decline in the USD Index is not enough to trigger such an invalidation, then it is quite likely that we will not see one before another big drop in metals’ and miners’ prices.
The medium- and short-term trends remain down for the precious metals sector.
In last week’s Premium Update we had suggested taking profits off the table by closing the short positions when gold was at $1,190 and we re-entered them last week, with gold at a higher price. This way we are not only positioning trades along with the medium-term trend, but are also taking advantage of the very short-term corrections (of course it would be ideal to go short at the exact top, and exit the position at the exact bottom, but as we all know it’s not possible, and we think moving back on the profitable trade at an even better price is a very good result).
Those who subscribe to our crude oil analysis are profiting from the shifts in the gold:oil ratio while being more neutral to the commodity sector in general (with short positions in gold and mining stocks based on these publications and a long position in crude oil based on Oil Trading Alerts and Updates)
The key question is how low the precious metals market can go before the final bottom is in.
Usually, the situation with price targets is quite clear in the case of gold and less clear for other markets, but right now, the opposite seems to be the case. There are several price levels at which gold could stop, but it seems that there are single most probable targets for silver ($16), HUI Index (150) and the Dow to gold ratio (15). Consequently, it seems best to monitor all the markets and key ratios and use them as a confirmation for timing the final bottom in gold. If we’re lucky, all the above-mentioned targets will be reached simultaneously and we will have a very good probability to enter the market very close to the bottom.
As promised, today’s update includes the scenarios (in the form of triggers) that would make us change our mind regarding the currently opened speculative short positions and regarding the long-term investment capital. It seems quite likely that none of them will be take place this week, but it’s better to be a little overprepared than underprepared.
To summarize:
Trading – PR: Short position in gold and mining stocks.
Trading – SP Indicators: No positions: SP Indicators suggest long positions, but the new self-similarity-based tool suggests short ones for the precious metals sector. We think that overall they cancel each other out.
Long-term investments: No positions.
| Portfolio's Part | Position | Stop-loss / Expiry Date |
|---|---|---|
| Trading: Mining stocks | Short (half) | GDX: $22.20 |
| Trading: Gold | Short (half) | $1,240 |
| Trading: Silver | None | - |
| Long-term investments: Gold | None | - |
| Long-term investments: Silver | None | - |
| Long-term investments: Platinum | None | - |
| Long-term investments: Mining Stocks | None | - |
This completes this week’s Premium Update. Our next Premium Update is scheduled for Friday, Jan 10, 2013.
The markets will be closed on New Year's Day and your Editor will take 3 days off, which means there will most likely be no Market Alerts / Premium Updates from Tuesday to Friday this week (we might be able to send/post them, but we can't guarantee it for these 3 days). You will receive an Alert on or before Monday, Jan 6, 2014 and then you will receive them normally on each trading day (plus Premium Updates every Friday). As promised earlier, today’s Premium Update includes possible scenarios and our preferred actions in each case, so that you are prepared for the upcoming price moves.
On behalf of the whole Sunshine Profits Team, I would also like to thank you for staying with us in 2013 and wish you a Happy and Prosperous 2014!
Thank you for using the Premium Service.
Sincerely,
Przemyslaw Radomski, CFA

