
This year's bad economic news overshadowed the aspect of geopolitical risk, which again reared its ugly head over the past few weeks. North Korea has just conducted a new nuclear test and fired short range missiles. Iran has made several moves that in slower news cycles would have dominated the headlines. Israel, worried about the situation in Iran, is conducting a five day drill, dubbed 'Turning point 3," to prepare Israel's rapid response capabilities in the event of simultaneous missile strikes and terrorist attacks. All this is bad enough without mentioning other flash points, such as Afghanistan, Pakistan, Nigeria and Venezuela.
Yes, geopolitical risk is back. It never went away, we just overlooked it while being inundated with the worst financial news in recent memory. However, faithful subscribers to Sunshine Profits Premium Service have gold and silver in their portfolios and that makes us feel a bit safer, at least financially. Remember the Golden Rule: he, who owns the gold, makes the rules. Moving on to the technical side of the analysis, I'll begin with the silver market.
Silver
I covered the white metal in the end of April issue of the newsletter in which I wrote that silver formed several cup-and-handle patterns. The implications at that time were that once silver completes this pattern, the following move would be substantial. Since I first wrote about it a month ago, silver did indeed complete a cup-and-handle pattern and did move 30% higher. (There is nothing like a good cup to make a trader happy when proven right.)
On the other hand, since this move has been swift, it is natural to expect some kind of a consolidation. There were signs that a local (short-term) top may have formed during the past several weeks/days, but none proved to be the true top. However, now we are approaching a long-term resistance level, more significant than its short-term counterparts. Charts are courtesy of stockcharts.com.
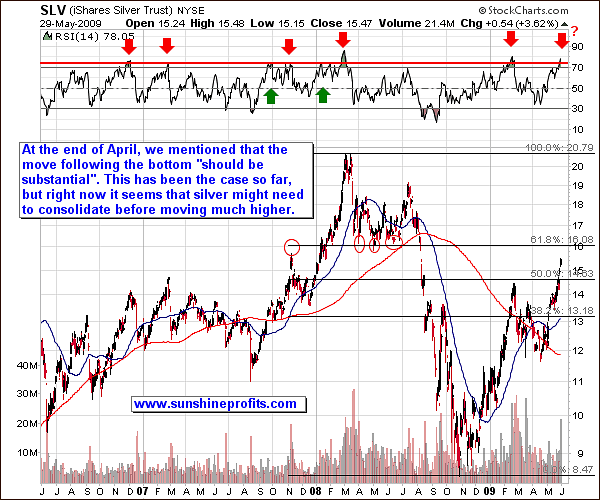
The first thing to notice when looking at the lower portion of this chart, is that silver, always known to be volatile, has grown even more so this past year. This can be partly attributed to the big-pullback effect that we have seen in the entire precious metals sector, and to the plunge in the general stock market which dragged virtually every asset class much lower.
Why did this happen? The answer can be found in terms such as "deleveraging" and "fear." When all hell broke loose last year, massive amount of money were needed to be raised immediately by hedge funds and other financial institutions to cover losses on the stock and futures markets. When in a desperate need for cash to offset gargantuan losses, a hedge fund manager will sell everything in sight, no matter how favorable the fundamental situation might look in a particular asset, such as silver, for example. Once investors see the plunging prices of their favorite investment, they tend to forget the reasons why they bought silver in the first place and that they planned to hold it for a long time. Driven by fear, they sell, sell, sell, usually near the bottom.
It was only several months ago when we experienced a massive plunge in precious metals and mining stocks. Since the plunge was severe while the precious metals market fundamentals remained bullish, we saw a sizable rebound in the entire sector. Those, who sold their holdings began to realize that this was just a temporary downswing and were eager to buy back - as the fundamentals are still intact.
During especially emotional periods in the stock market, we can see every asset class move in the same direction, driven by emotion rather than cold logic and analysis. Once the smoke clears and emotions subside, most investors begin to look at the fundamentals rather than relying on gut-feelings. They get back to the logical side of the market, which in this case, means back to investing in the precious metals.
If we take a look at the silver chart, we see that silver is just about to reach the $16 level. I have used the SLV ETF as a proxy for the silver market. The price of spot silver is about 1% higher than the value of this fund, so the resistance price level is not much affected given the size of the preceding move and the fact that the resistance is "around" the $16 level rather than precisely on it. This situation is caused by the fact that apart from the classic 61.8% Fibonacci retracement level which points to the $16.08 (SLV ETF) level, we have seen several bottoms and tops around this price level. I have marked them on the chart with red ellipses. Please note that price has not stopped precisely at $16, but it has hovered around it many times.
One of the most useful indicators in the precious metals sector - the Relative Strength Index (RSI) is now at the overbought level, which suggests that this also holds true for silver.
I would like to make this clear. No single indicator or technical signal is good enough to stand on its own. There is no perfect crystal ball. Rather, when several indicators signal concurrently, each reinforces the other. Even when that happens, we can only know what is "likely" to take place, but can never be completely certain. That is why it is especially important to estimate the efficiency of a particular indicator or tool. Let's examine the RSI. I marked with red arrows points where the RSI indicator was correct in signaling a local top, and with green arrows, points where it proved to be a false alarm. It turns out that 5 times out of 7, the RSI proved useful for silver investors and speculators. Although looking at only 7 such instances may be too small a sample to enable us to make decisive calls, the 71% efficiency certainly makes it a valuable tool to include as a part of our analysis.
Here the RSI index, used concurrently with other techniques and price levels, is increasing the probability that this signal may be accurate and that silver is overbought and is heading lower in the short- or even very short term.
Similar analysis can be applied to the gold market.
Gold
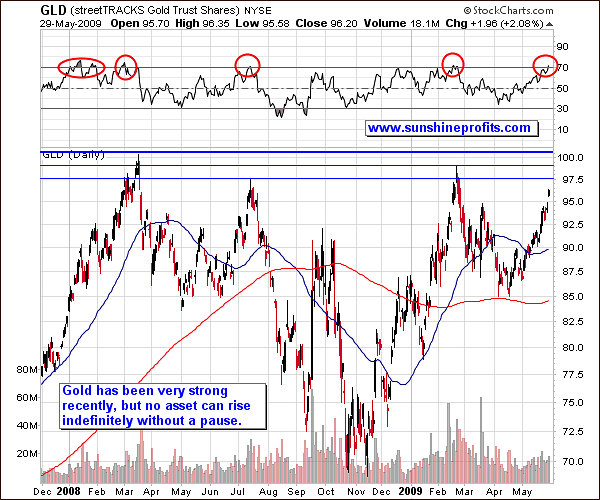
Gold and silver have been on a tear recently as more traders and investors anticipate a loss of faith in government assets and a coinciding return of inflation. The RSI suggests that gold is in the overbought territory right now, and a pullback would be a healthy development. However, as we all know too well, markets can defy logic and turn from overbought to extremely overbought before taking a breather. I always say that prices can go lower than we believe and higher than we can imagine. Still, after a substantial move in a short time, gold is particularly vulnerable to a correction once it hits the "right" resistance line. Which resistance level is the "right" one and most likely to hold soaring gold prices? It's a tough call to make. More details can be found in other markets.
USD
The USD Index is in a similar situation to last week's. It bounced during the week but faltered and closed below the multi-year resistance/support level of 80 that I discussed in last week's Premium Update, and at a five-month low against the euro. Fears about inflation and U.S. deficits helped send the dollar lower. In May, the dollar lost 6.4% of its value against the euro. From a psychological point of view this is a very important level as the USD has bounced near the 80 level many times in the past.
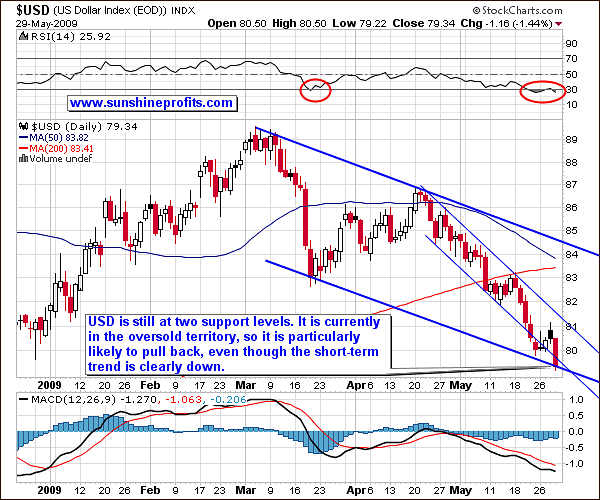
However, taking into account the lower borders of the trend channels, this drop is not a decisive one. The USD Index is still holding at the support level. This implies that what we wrote last week about the dollar being oversold, is still relevant today. To remind you, I said that it would not surprise me to see the USD bounce from here. Another intra-day low and a sharp bounce could be likely.
General Stock Market
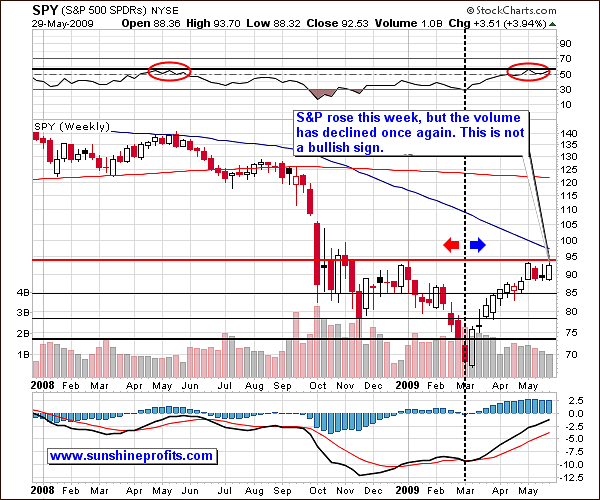
The Dow Jones Industrial Average surged 100 points late Friday as investors decided to take money off the sidelines and jump in. It ended up 1.1% higher and 4.1% higher for the month of May. The S& P index rose 5.3% in May, for a three-month gain of 25%, its biggest three-month gain since August 1938. In the previous Premium Update I stated that "should the S&P close lower next week on higher volume, we may head lower." This did not happen. Instead, we saw the general stock market rise, but on even lower volume than during the previous week. This is not a bullish sign, as it indicates that buying power is weaker, but neither is it a bearish confirmation. In short, the technical picture of the general stock market has not changed much this week. Before we move on, please note that it is also possible that this is a consolidation in the S&P, (volume declines during consolidations.) This theory would be confirmed by a breakout on strong volume above the red horizontal resistance line clearly marked on the chart just below the 95 level.
Gold Stocks
Mining stocks are in tune with other sectors of the precious metals market. An exhausting rally, serious resistance levels and overbought status - all these mean that a correction is likely.
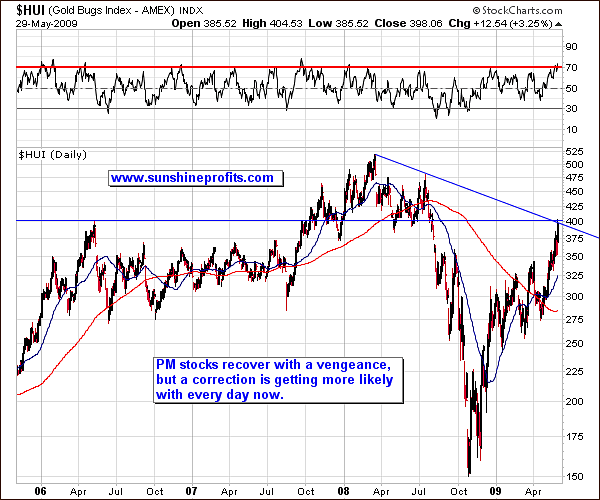
The RSI index is the same for gold stocks as it is for gold and silver. The HUI Index reached a combination of two resistance levels which correspond to the psychological level of 400. This level stopped a massive rally in 2006.
Gold Stocks / General Stock Market
The GDX:SPY ratio measures the way PM stocks perform compared to the general stock market. The ratio can be analyzed technically just like any other chart. By doing so, we can gain additional insight. If we get lucky, we may be able to spot something otherwise not visible when analyzing these markets separately.
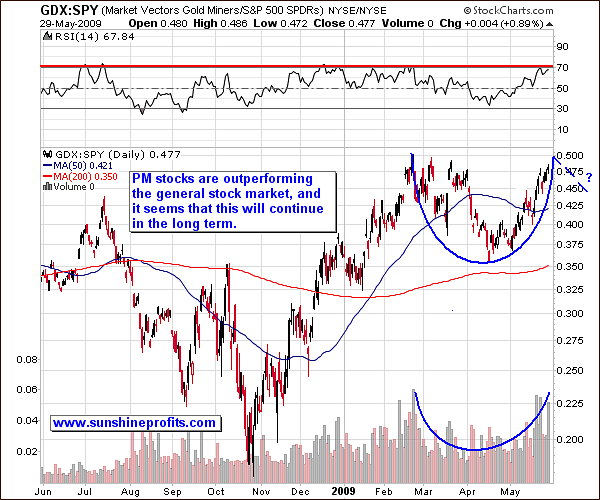
If you recall, I already mentioned earlier in this update that silver has completed its cup-and-handle pattern and moved much higher afterwards. It seems that a similar cup pattern is visible on the GDX:SPY ratio chart. It is not yet very certain that the full formation will materialize, and we are still missing the "handle" part of the formation. In previous weeks I have emphasized that a correction in the PM sector is likely. Should it take place, the GDX:SPY ratio would also most likely decline. In other words, if we get a correction in gold, silver and mining stocks, that event would most likely create the "handle" in the cup-and-handle pattern. Should this cup and handle formation complete, the implications for the PM sector in the medium-term would be important and positive, as the move following a cup-and-handle pattern is often substantial.
The key question is what will happen to the general stock market? Of course, it is much too early to make any calls, but with the correlation table, we'll be ready to take the appropriate action either way.
Summary
The precious metals market has been rallying very strongly in the past several weeks, which has happily contributed to increasing our net worth through our long-term holdings. Still, at the moment, it seems that the prices of precious metals and corresponding stocks have gone too high, too fast, and a healthy correction is likely. Although prices of gold, silver and mining stocks are reaching their own resistance levels, such a correction will most likely be caused by some kind of catalyst, probably a strong move in the U.S. Dollar, or in the general stock market.
If the USD Index bounces immediately, gold, silver, and corresponding stocks could get hammered, as their correlation with the U.S. Dollar is very strong and negative. The general stock market is at a crossroad. Declining volume may mean that we are currently seeing a consolidation and a breakout will follow. Alternatively, the S&P might decline to one of its support levels. I still view the latter as the more probable scenario.
Other information
I am pleased to announce that we have upgraded our Leverage Calculators which you can find at the top of the Tools section. We have added a new row - "Perspective". You will now be able to choose both long-term and short term perspectives in making investment decision. Data is updated on a daily basis. These calculators provide you with a ranking of gold/silver stocks. You may select your favorites, or go with the most popular ones. They are ranked in order of their leverage and exposure to gold/silver - in a way that is most useful to you.
For example: a long-term investor wants to buy 5 gold stocks, with gold being at $950, that give him the "biggest bang for the buck" and have high exposure to gold. After running the calculator, the investor selects "point" prediction type (they don't know when they wants to sell) and they selects the "long-term" perspective. They then "checks all" stocks, enters $950 as the price at the bottom of the page and click the "calculate" button. The result they will get is the ranking of gold/silver stocks that would best suit their needs. Now all they need to do is to check the first 5 stocks on the list and add them to their portfolio.
Here's another example. A speculator wants to profit on rising gold prices, but wants to use mining stocks because of their leverage. They want to buy stocks with gold at $940 and sell them once gold hits $990. After running the calculator, they select "range" prediction type (they know exactly when they want to sell), they select the "short-term" perspective. Then they "check all" stocks, enter $940 as the initial gold price, and $990 as the final gold price. They then click the "calculate" button. The result is the ranking of gold stocks that would best suit their trading needs. The calculator will also tell them how much on average are particular stocks leveraged to gold.
This completes this week's Premium Update.
Thank you for using the Premium service. Have a great weekend!
Sincerely,
Przemyslaw Radomski

