
- USD and Euro Indices
- General Stock Market
- Correlation Matrix
- Gold
- Silver
- Mining Stocks
- Gold and Debt Ceiling
- Letters from Subscribers
- Is gold set for a 20% rally soon?
- When I should purchase Gold / Silver?
- Do we think that the U.S. Gov't is going to default on its debt?
- Gold a slam dunk sell
- A comparison of gold and the dollar
- The Dollar system
- Summary
We all heard about various “bailouts” or the financial wizardry that the American government used after the 2008 crisis. In a two pronged play the government spent public money while at the same time it introduced the “quantitative easing” program, which resulted in huge money printing and increases to the “narrowly defined money supply.” As mentioned in the last reports, even though it was inflationary it was not very, very inflationary-- at least not yet.
Lots and lots of new money was created, huge mountains of the stuff. The biggest question is what happened to this money and how did this affect the stocks and bonds? So besides the quantitative aspect there is also the qualitative aspect – what has happened to the money? Where did it go? How would the Fed’s activity to step back affect the markets? A large part thereof went to the stock market. It doesn’t seem to us that the chart below featuring Federal Reserve assets looks quite similar to main stock indices after 2008. So can everyone be really happy about the rally in stocks if it’s artificial to a considerable extent.
Central banks create money—that’s their job. The interesting side of this process is how they hand that money out. Even though the fundamental story behind those operations is very simple – print the money – the actual mechanism is often a bit technical and complicated. When the central bank creates the money it does not just hand the money out. It hands the money out via specific channels and takes detailed collateral for those gifts.
Recent times were revolutionary for central banks around the world. The American central bank is no different, and is actually the leading example for a revolutionary shift. After the Lehman collapse the central banks started to ominously expand their balance sheets, i.e. they started to buy much more securities than in the past. Here is what happened with the Federal Reserve balance sheet since August 2007 till August 2013, with the value of assets held by the Fed:
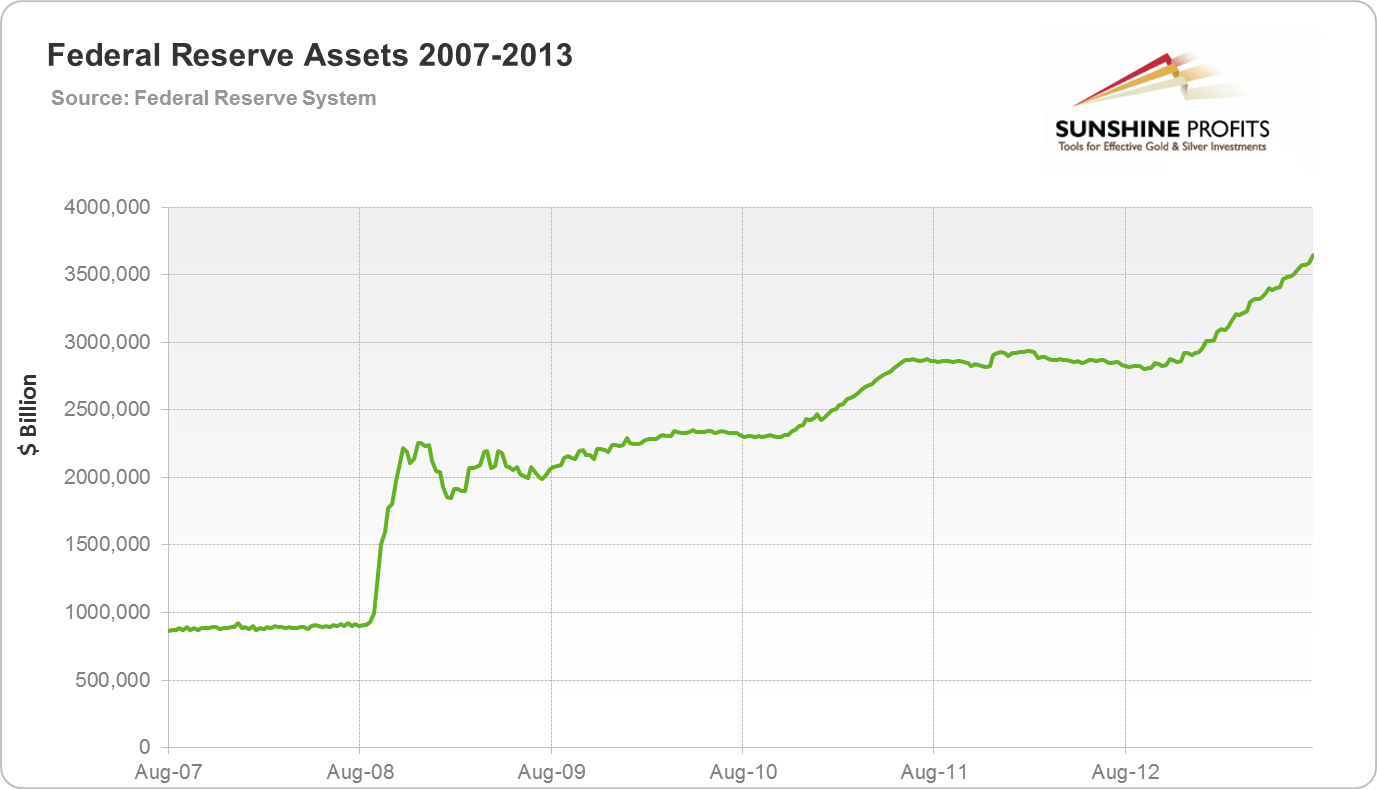
The value of assets before September 2008 was well below 900 billion dollars. The graph shows that the figure has more than tripled in a very short time. Most of the operations before 2008 were conducted on US Treasuries and the Federal Reserve was very passive in its policy. The “Lehman hit” that took place in 2008 changed everything. The Federal Reserve started to take lots of assets on its balance sheet during a modern crisis of unprecedented proportions which hit both the financial and stock markets. Lots of money was being printed in order to bid up the prices of worthless papers. The end result was the end of the liquidity shortage and the saving from unavoidable drowning of many dollar-denominated assets, including agency debt such as the Student Loan Marketing Association (Sallie Mae), Federal National Mortgage Association (Fannie Mae) and Federal Home Loan Mortgage Corporation (Freddie Mac).
Did this influence the stock market? There is no question about that, only the strength of influence can be debated.
We’ve just heard that a new Boss is coming to the Fed. Janet Yellen will soon replace Ben Bernanke, but do not expect changes in Fed’s approach. The same goes for our outlook for gold in the long run – it remains bullish.
Now let us look at short term (charts courtesy of http://stockcharts.com).
USD and Euro Indices
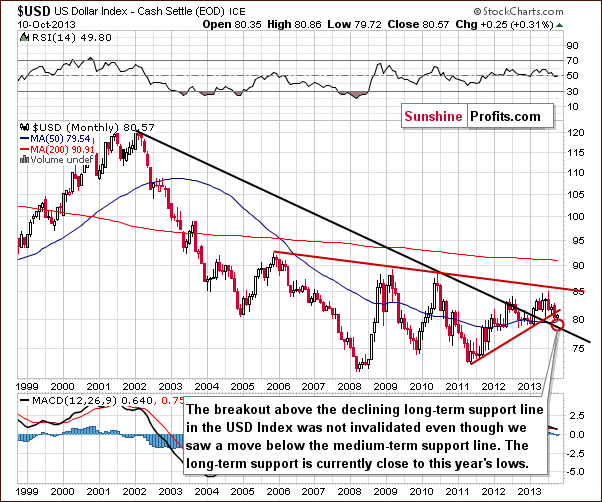
The situation in the long-term chart hasn’t changed much recently, and all of what we wrote in our previous Premium Update is still up-to-date today.
The long-term breakout above the declining long-term support line was not invalidated. (…) However, since the medium-term breakdown (below the support line marked with red) is visible also from this perspective, we could see some short-term weakness anyway. It seems that the long-term support line will stop the decline – that is, if the USD Index gets that low. Therefore, from the long-term perspective, it seems that the downside is still quite limited.
Now, let’s examine the weekly chart.
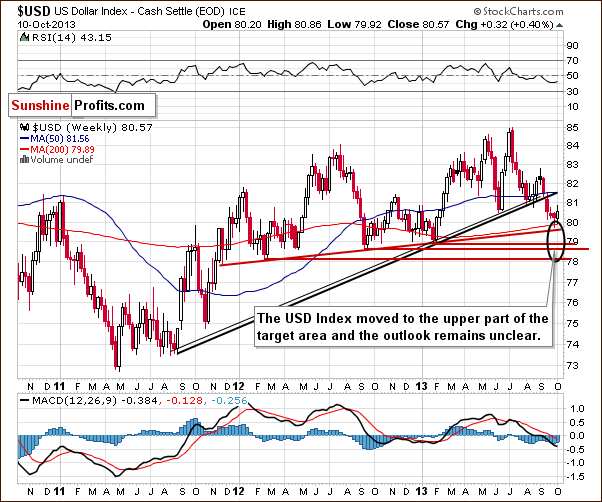
On the above chart, we see that the USD Index reached the upper edge of the target area (marked with a black ellipse) in the past week. Therefore, the bottom of the recent corrective move might be in. At this point, it’s worth mentioning that the breakdown below the rising, medium-term support line is confirmed; however, the situation is still unclear, because even if the dollar moves three index points lower, it still will be in the target area.
Let’s check the short-term outlook.
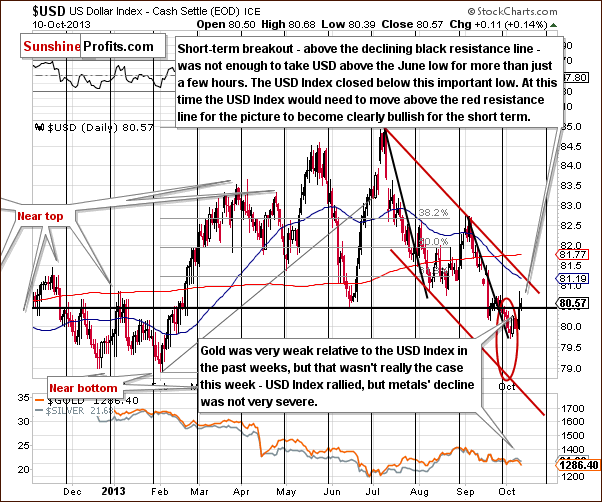
The rally that we saw this week was significant on a short-term basis, but taking closing prices into account, we see that not much has changed. The breakdown below the June low was not invalidated, and overall the situation remains unclear. Technically, the USD Index closed above the intraday June low, but didn’t move above it in terms of daily closing prices and in early Friday (pre-market) trading the index is below the intraday low as well – consequently, we don’t think that we can really speak of an invalidation at this time.
We will need to see a close above the red declining resistance line (currently close to 81.2) for the situation become bullish. Based on what we saw on the medium-term chart, we would have to see a move even higher, above 81.6 or so (the black rising support line seen on the weekly chart) for the outlook become bullish in the medium term.
Another important thing that we can see on this chart is the performance of precious metals relative to the USD Index. While the performance had been very week in the past weeks, it was not really the case this week – that is until Thursday. On Thursday, gold declined significantly ($20+ decline), but we didn’t see a similar price action in the case of silver or mining stocks. The situation is therefore largely unclear, with a bearish bias at this time, mainly based on Thursday’s gold-USD price action.
Let’s now take a look at the Euro Index.
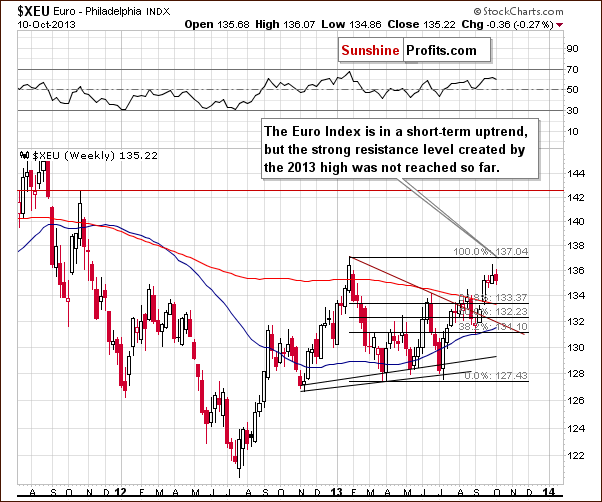
Looking at the above chart, we see that the Euro Index is in a short-term uptrend, but the strong resistance level created by the 2013 high has not been reached so far. This means that another move to the upside should not surprise us.
Summing up, from the long-term perspective, nothing has changed this week, and the long-term trend remains up. The medium-term perspective hasn’t changed either, and we saw only a small improvement in the short-term picture. The short-term outlook remains unclear, and the analysis of the Euro Index tells us the same thing. The euro has just seen a visible, sizable rally, but the strong resistance has not been reached so far. Therefore, further rally in the Euro Index and a decline in the USD Index should not surprise us. The implications for the precious metals sector are rather unclear.
Gold’s move lower, despite the lack of a move up in the USD Index on Thursday is a bearish factor on its own; however that’s the only part of the precious metals sector that really declined that day. Earlier this week, we saw that miners were able to rally despite a move up in the USD Index, which is a bullish factor (for the short term only). Generally, the situation in the USD Index is unclear for the short term, and its overall impact on the precious metals sector is rather unclear as well (with a slight bearish bias).
General Stock Market
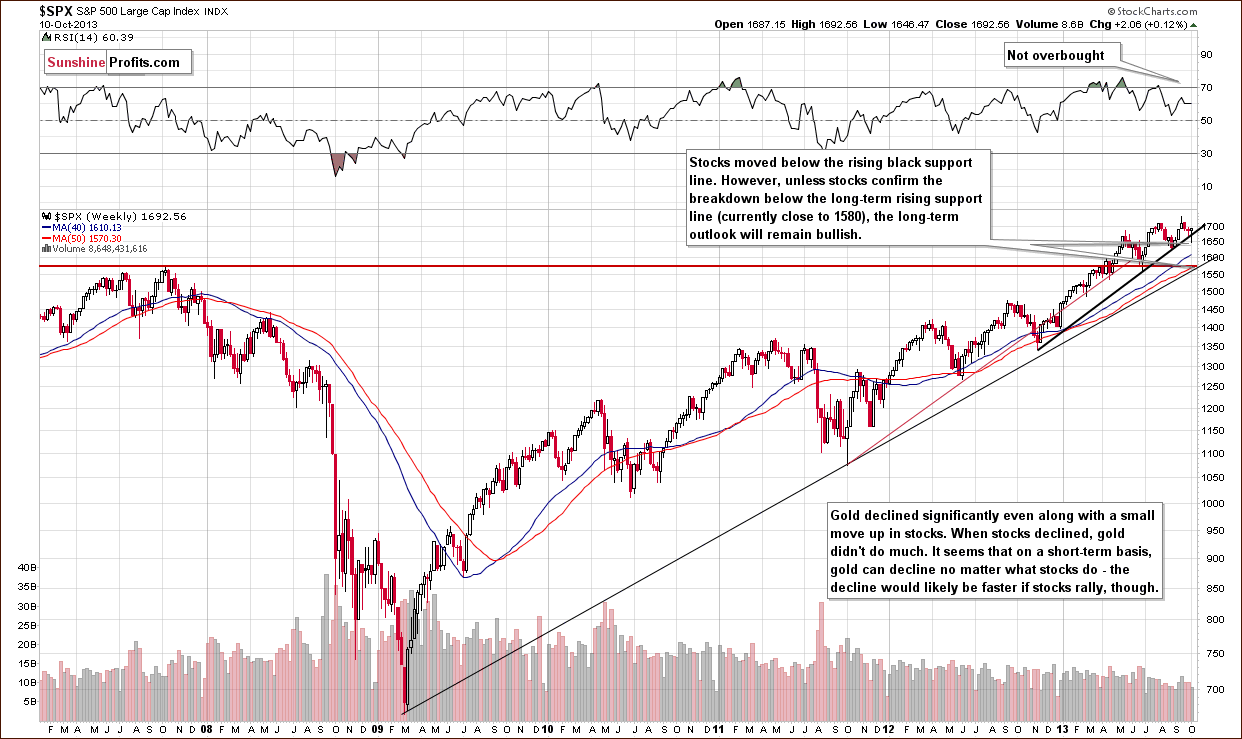
Based on this week’s breakdown below the rising black support line, we were about to (before seeing the final hours of yesterday’s market session) write that we could see another sizable downswing if the breakdown was confirmed. However, the move below the rising medium-term support line was quickly invalidated and the outlook improved dramatically based on yesterday’s session.
The official (and actually quite likely) reason was “signs of progress in negotiations to raise the U.S. debt limit, at least temporarily.”
In our view, it’s almost certain that the debt ceiling will be raised, and the only unknown is the justification that politicians will use to do it this time. Therefore, we can expect stocks to rally further as the market becomes more optimistic about it.
Gold’s reaction is quite interesting – it didn’t rally even though the additional perceived probability of the increase in the debt limit should trigger such a move. This time, markets seem to have focused on this piece of information as a relief, and people sold gold, which is no longer needed as a hedge – at least a lot of investors seem to have thoughts like that.
The implications for gold are bearish, and this makes them bearish also for the rest of the precious metals sector, although to a smaller extent.
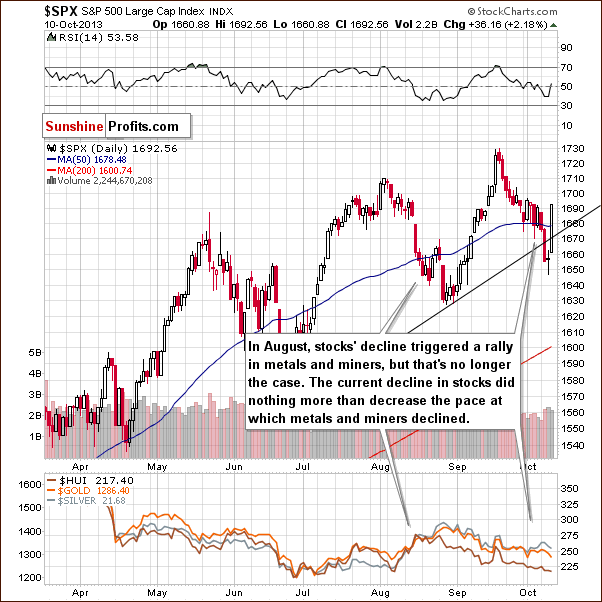
The invalidation of the breakdown is quite clear on the above chart, but since we already covered it above, we will now focus on something else.
Another important thing to be noticed here is that declining stock prices didn’t trigger a rally in the precious metal market. The only way in which the declining stocks managed to impact the precious metal market was to decrease the pace of the metals’ and miners’ decline.
Consequently, we might not see a sharp plunge in the prices of precious metals and mining stocks as long as stocks continued to decline. This means that even if stocks declined from here (which seems unlikely based on what we saw on Thursday), it would only buy metals some time before they would plunge once again.
Let’s turn now to the financial sector, which in the past used to lead the rest of the general stock market.
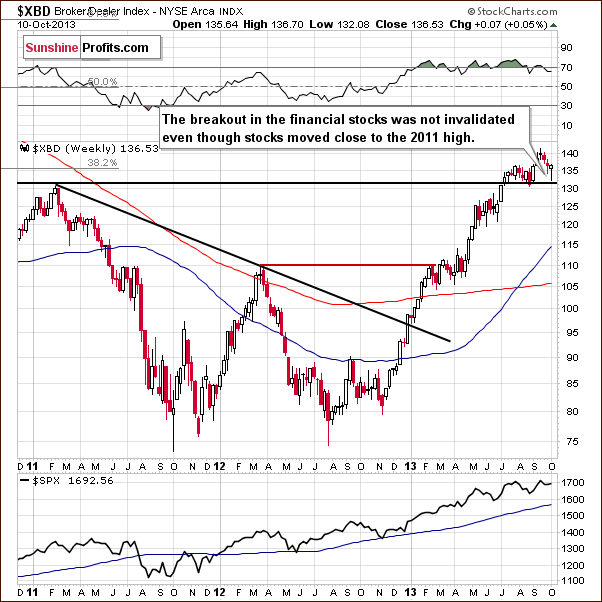
On the above chart we clearly see that, in spite of the recent downward move, the financial stocks didn’t invalidate the breakout above the level of 130. This was a subtle indication that a bigger decline will not be seen on the stock market.
Consequently, the medium-term outlook remains bullish. Please note that since the support created by the 2011 high is relatively close, we will likely not see another major decline.
Summing up, the long-term, medium-term and short-term outlooks for the stock market remain bullish, and the implications for the precious metals sector are bearish. In fact, even if we saw a decline on the stock market, it would not necessarily imply a rally in the precious metals sector (only a pause or a decline at a slower pace).
On a side note, our Stock Trading Alert subscribers remained updated throughout yesterday’s volatile session (4 alerts were published yesterday; the first one is available publicly and its description in the list of alerts is accompanied by an arrow summarizing the outlook – it was green and pointing upward before yesterday’s session – for the first time in a week and a half).
The invalidation of the breakdown is a huge deal for precious metals investors and you can see why in the below section.
Gold & Silver Correlations
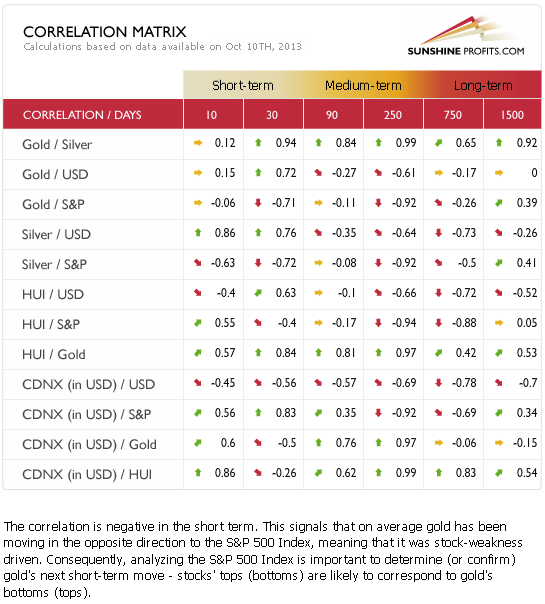
The particularly interesting thing that we can see in the Correlation Matrix this week is that the correlations have turned upside-down in the short-term (30-days) column.
The most interesting thing about these coefficients is what actually caused them to be upside down. In the case of the USD Index – it was the fact that metals managed to decline even when the dollar declined (bearish implications). In the case of the general stock market – it was the fact that the metals managed to decline along with a decline in the case of stocks.
Stocks’ bullish invalidation of the breakdown is so important because of the significant and negative correlation with gold and silver. Naturally, the bullish action on the stock market is bearish for the precious metals sector.
Let’s take a look at the metals themselves, starting with gold.
Gold
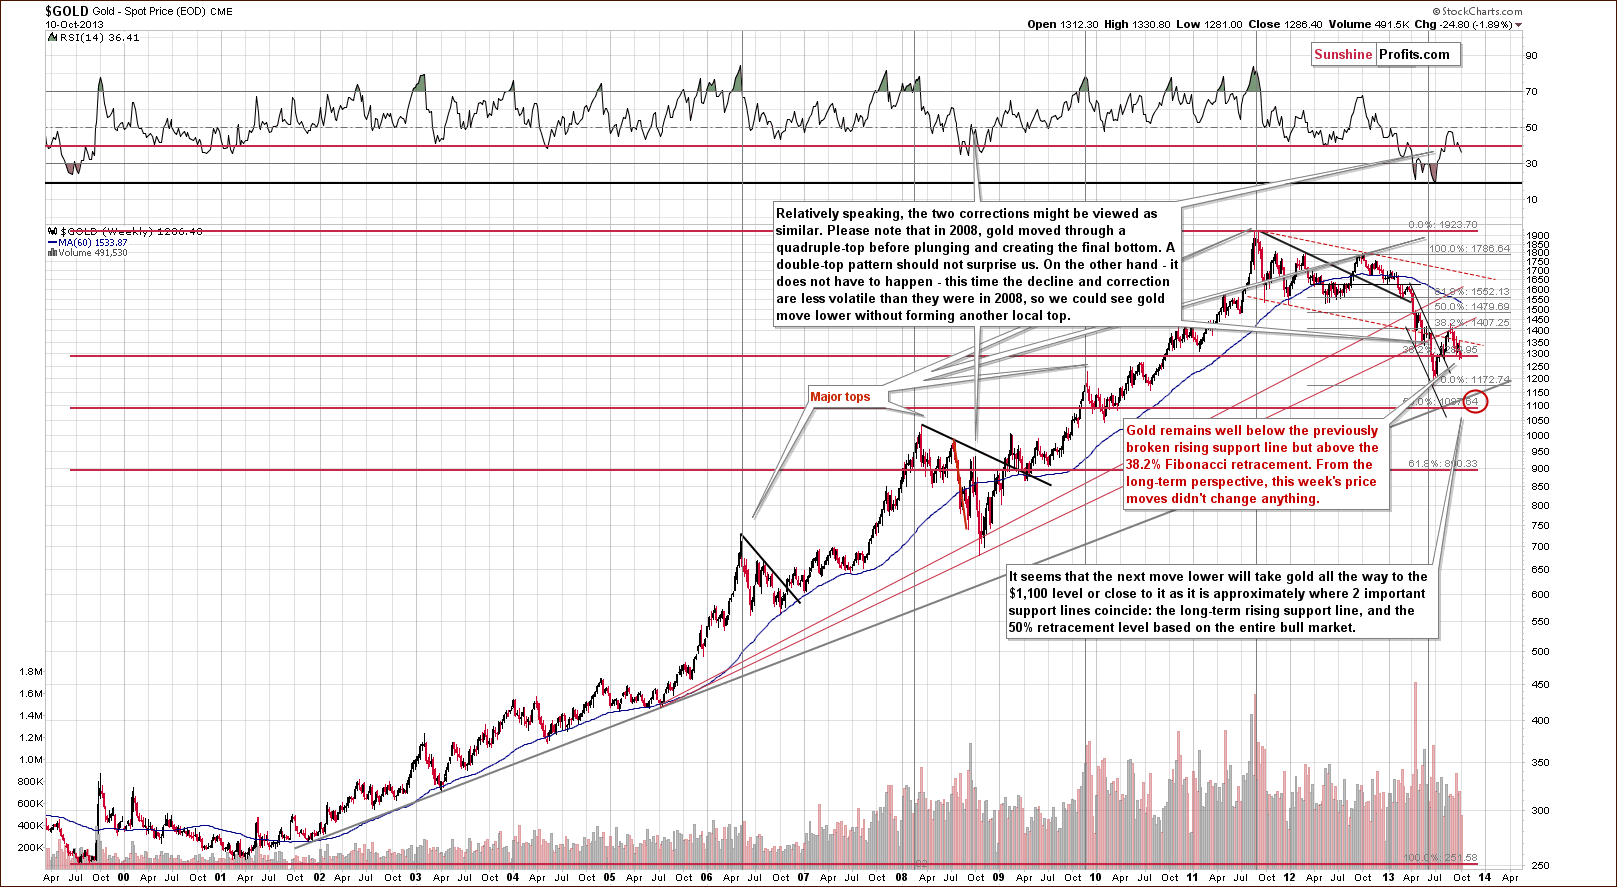
This week’s price moves were quite visible on a short-term basis, but from the long-term point of view, they didn’t change anything as they didn’t take gold below the nearest significant support level, which is currently close to $1,285. Gold closed very close to this level, however.
At this time we might still see an additional upswing. It will not invalidate the bearish outlook as long as it doesn’t break above the rising resistance line, which is currently more than $100 above the yesterday’s closing price (and a rally this big seems unlikely). On the other hand, we could see a breakdown below the above-mentioned support level (gold closed very close to it) and a decline to $1,100 target level.
From the long-term perspective, the outlook is bearish. The biggest question that we have concerning gold is not if it declines, because that seems quite likely, but when will it happen.
Let’s look for some answers on the medium-term chart.
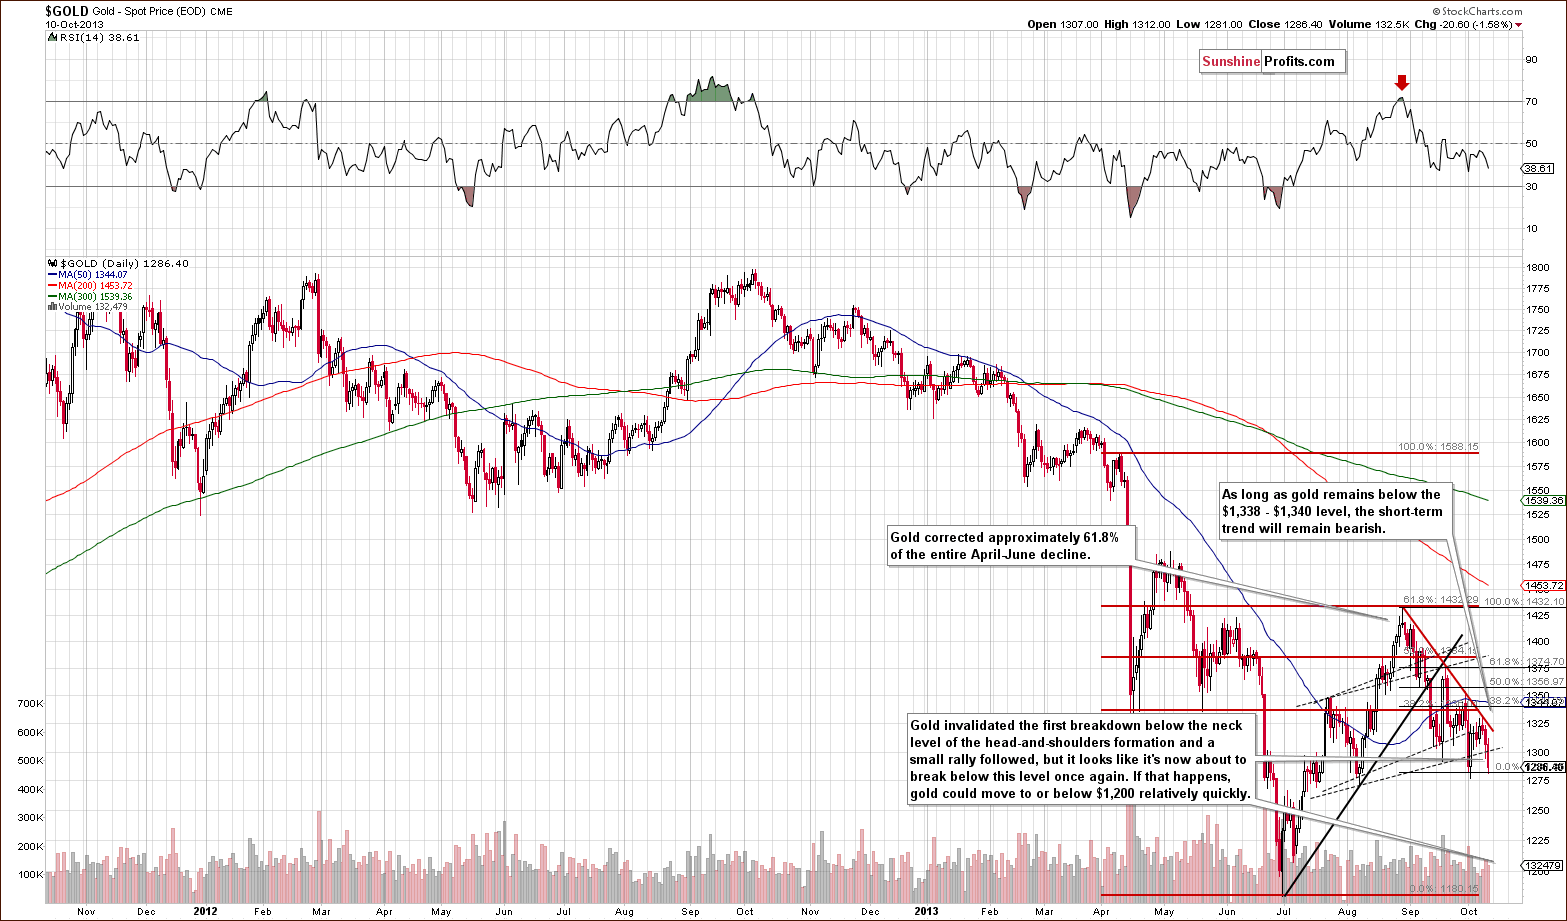
On the above gold chart, we can see that the head and shoulders pattern was completed “once again”. The breakdown below the neck level was not verified just yet, and since the previous breakdown was invalidated on the very next day, we think that the outlook deteriorated insignificantly.
The interesting thing about the gold market at this time is that the short-term support and resistance levels are very close to each other. Therefore, there are only several days that gold can trade without a confirmed breakout above the red declining resistance line or a confirmed breakdown below the neck level of the head and shoulders formation. It will have to move above or below one of them and then verify this move. When we see a confirmed breakout or breakdown, it will likely determinate the next short-term move in the gold market. In our opinion, the scenario in which gold declines is more probable, as it is in tune with the medium-term trend – plus gold is already below the neck level.
The “problem” with confirmation of a breakdown and waiting for it is – especially given the ways gold used to plunge earlier this year - that once gold starts to move lower, it could drop very fast and – as the head and shoulders pattern suggests – very far. The head of the pattern is big – bigger than $100, and that’s the type of move that we can see after the formation is completed. It was completed yesterday (without a verification, though), so such a move is now more likely than not.
To be honest, we would have suggested opening short positions earlier this week if it wasn’t for the strength of the mining stocks and the lack of significant declines in gold and silver even the USD Index rallied.
Now, let’s move on to the chart of gold priced in Australian dollars.
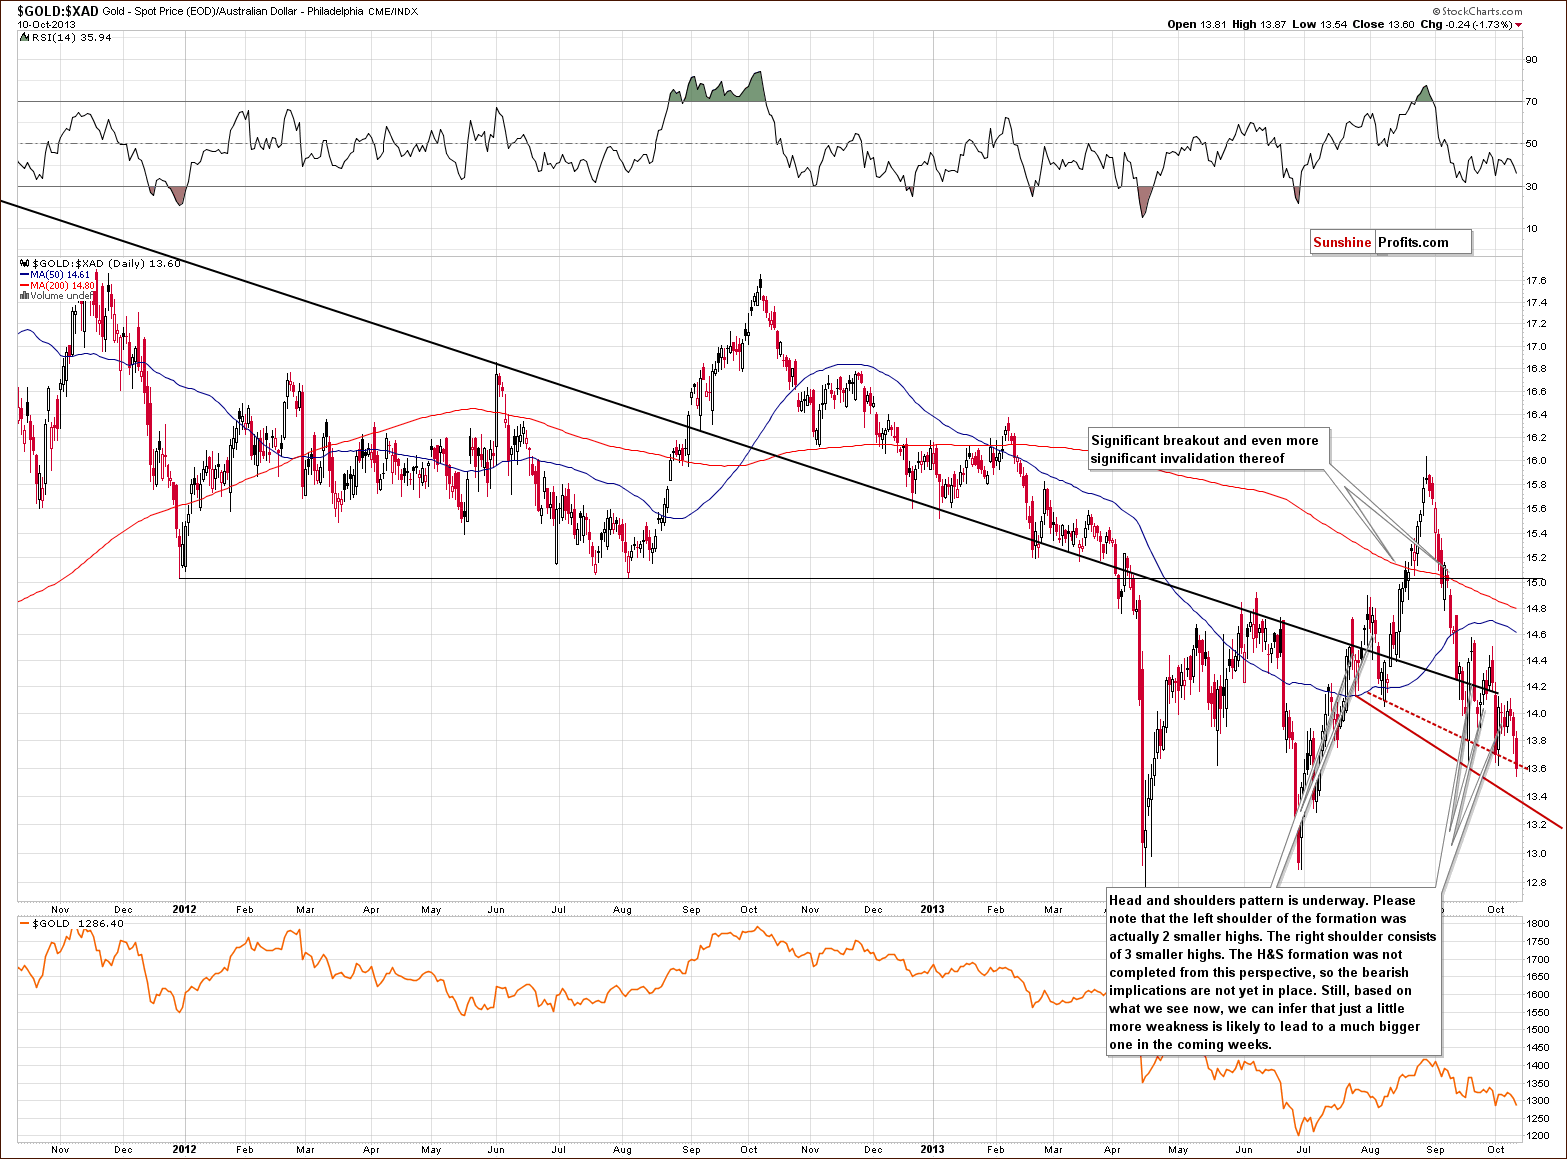
Looking at the above chart, we see that the situation hasn’t changed.
Quoting our previous Premium Update:
(…) there is a bearish head and shoulders formation underway, which may result in further declines in the near future. In this case, we could see a strong corrective move, one which would likely push gold’s price all the way back down to the April bottom area. Actually, we could even see a move below the April lows, because gold seen from this perspective is actually no longer strong versus gold priced in the US dollar.
Consequently, until the above pattern is completed, there will be no significant bearish implications. Please note that gold priced in Australian dollars remains below the long-term declining support/resistance line (marked with black on the above chart), and the breakdown is confirmed.
From this perspective, the situation is somewhat more bearish than not, but not significantly. Please note that if the head-and-shoulders formation is completed, we will likely see a move all the way down to the previous 2013 lows.
Let’s examine gold from another perspective – gold priced in British pounds.
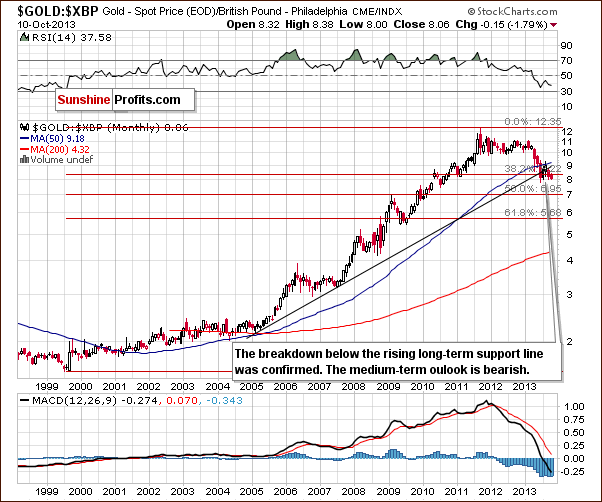
On the above chart we see that the breakdown is now confirmed, and the outlook is clearly bearish for the medium-term.
Generally, we can say the same when looking below at the gold priced in euro.
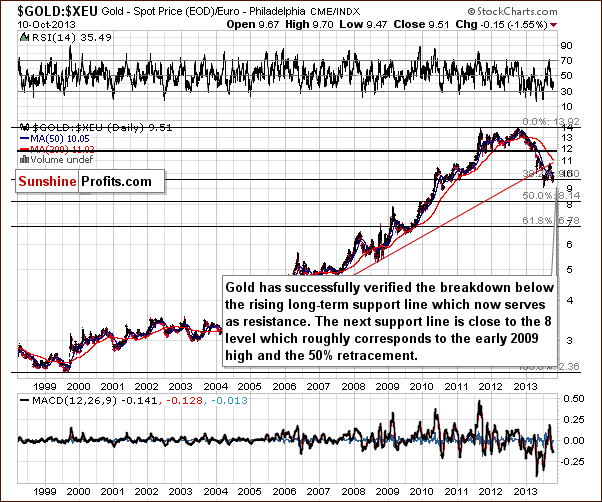
On the above chart we see that the correction that we saw in the past month was nothing more than a verification of the breakdown. From this point of view, the outlook remains bearish.
Let’s take a look at the chart featuring gold’s price from the non-USD perspective.
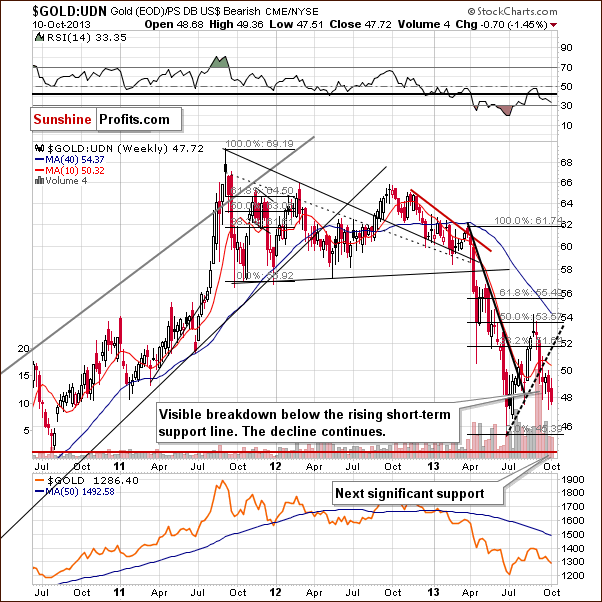
Looking at the above chart, we see that from this perspective, nothing changed this week. Therefore, most of what we wrote in our previous Premium Update is still up-to-date today.
(…) the situation has deteriorated slightly in recent days, and the breakdown below the rising support/resistance line based on the June and August bottoms is now even more than confirmed.
Therefore, from this perspective, the implications are clearly bearish for the medium term and – more importantly – they will stay bearish even if we see an additional small rally in the coming days/weeks.
Summing up, the medium-term outlook for gold remains bearish, and the downward trend is not threatened at the moment, even though we could see some strength on a very short-term basis. The latter might provide us with another opportunity to increase the sized of the short positions (traders should generally focus on trades that are in tune with the more important trend – and in this case the medium-term trend is down).
Increase – because we think that opening small speculative short positions is justified right now because if we see a decline here – it could be a very significant one. The head-and-shoulders pattern
Silver
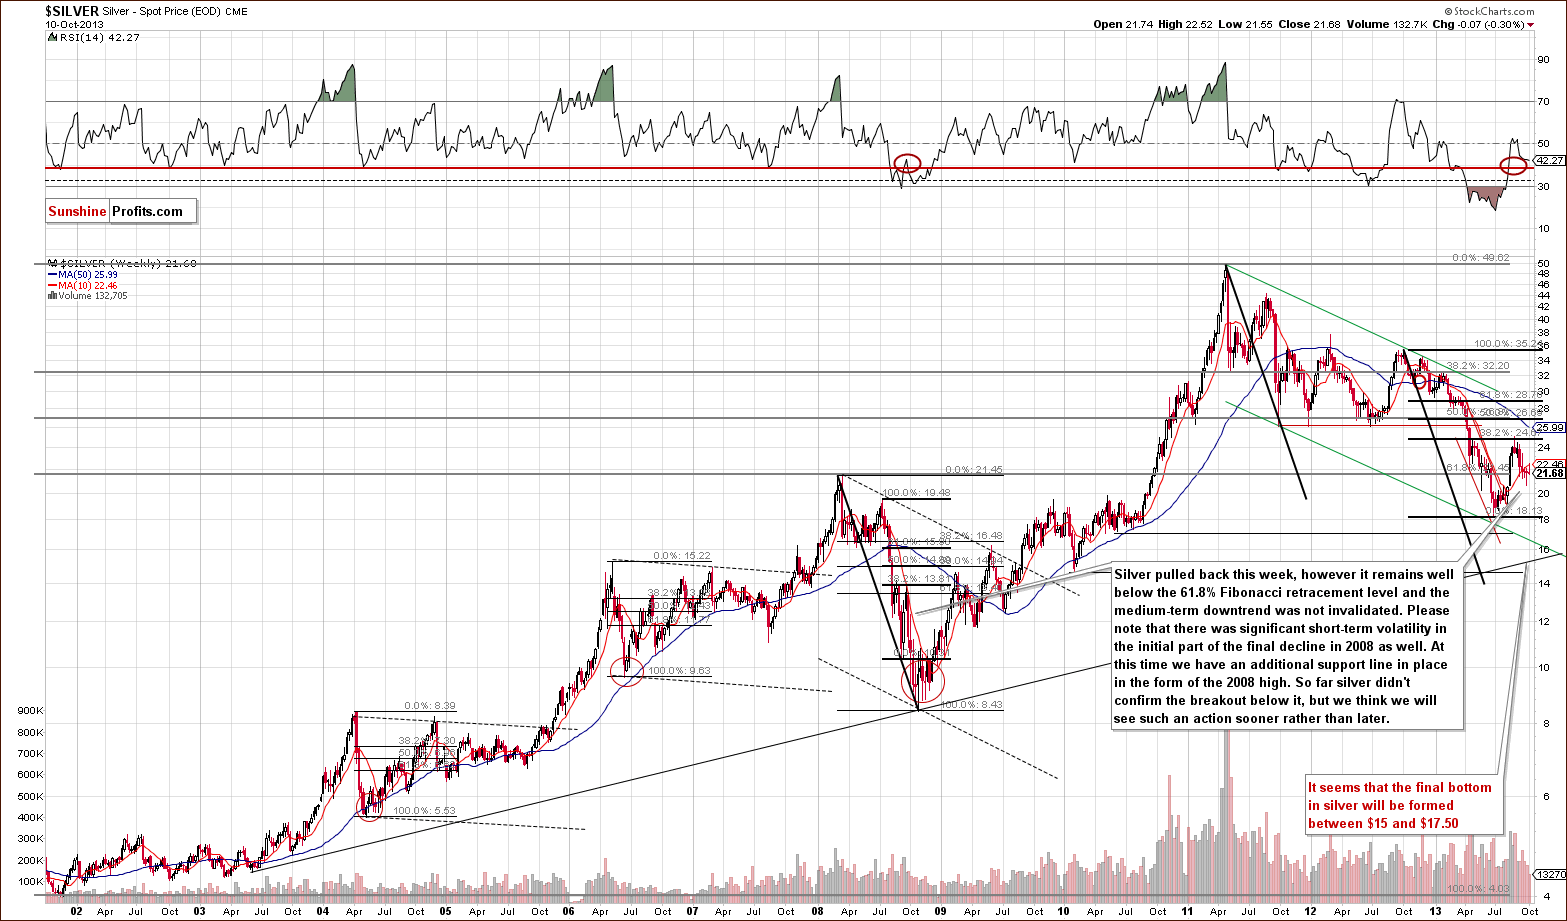
Although silver rallied this week and moved to its 10-week moving average, at this time it’s just more or less where it closed last week ($0.07 lower). Overall, not much changed from the long-term perspective.
Please note that silver is just slightly above the 2008 high, which corresponds to the 61.8% Fibonacci retracement level based on the entire bull market, which makes this level particularly important.
Consequently, as long as silver remains above this level, the outlook will not change from the long-term perspective. However, based on what we see on the gold stocks to gold ratio, it seems that silver will close below this level sooner or later.
Now, let’s move to the short-term chart to more clearly see the recent price moves.
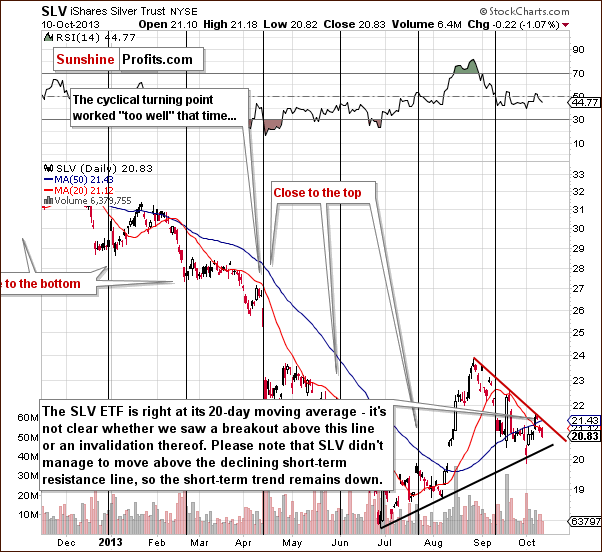
From the short-term perspective, silver is a bit more bearish than not based on the short-term trend – the short-term resistance line was not broken. The SLV ETF moved above the 20-day moving average and is now once again below this level, which means that the breakout was just invalidated. We view this chart as bearish.
Summing up, the situation in the silver market is bearish for the short-term, but rather unclear as far as the medium term is concerned, as silver is just slightly above the 2008 high, which provides strong support. It seems that when silver finally moves back below the 2008 high, the decline will accelerate.
Gold and Silver Mining Stocks
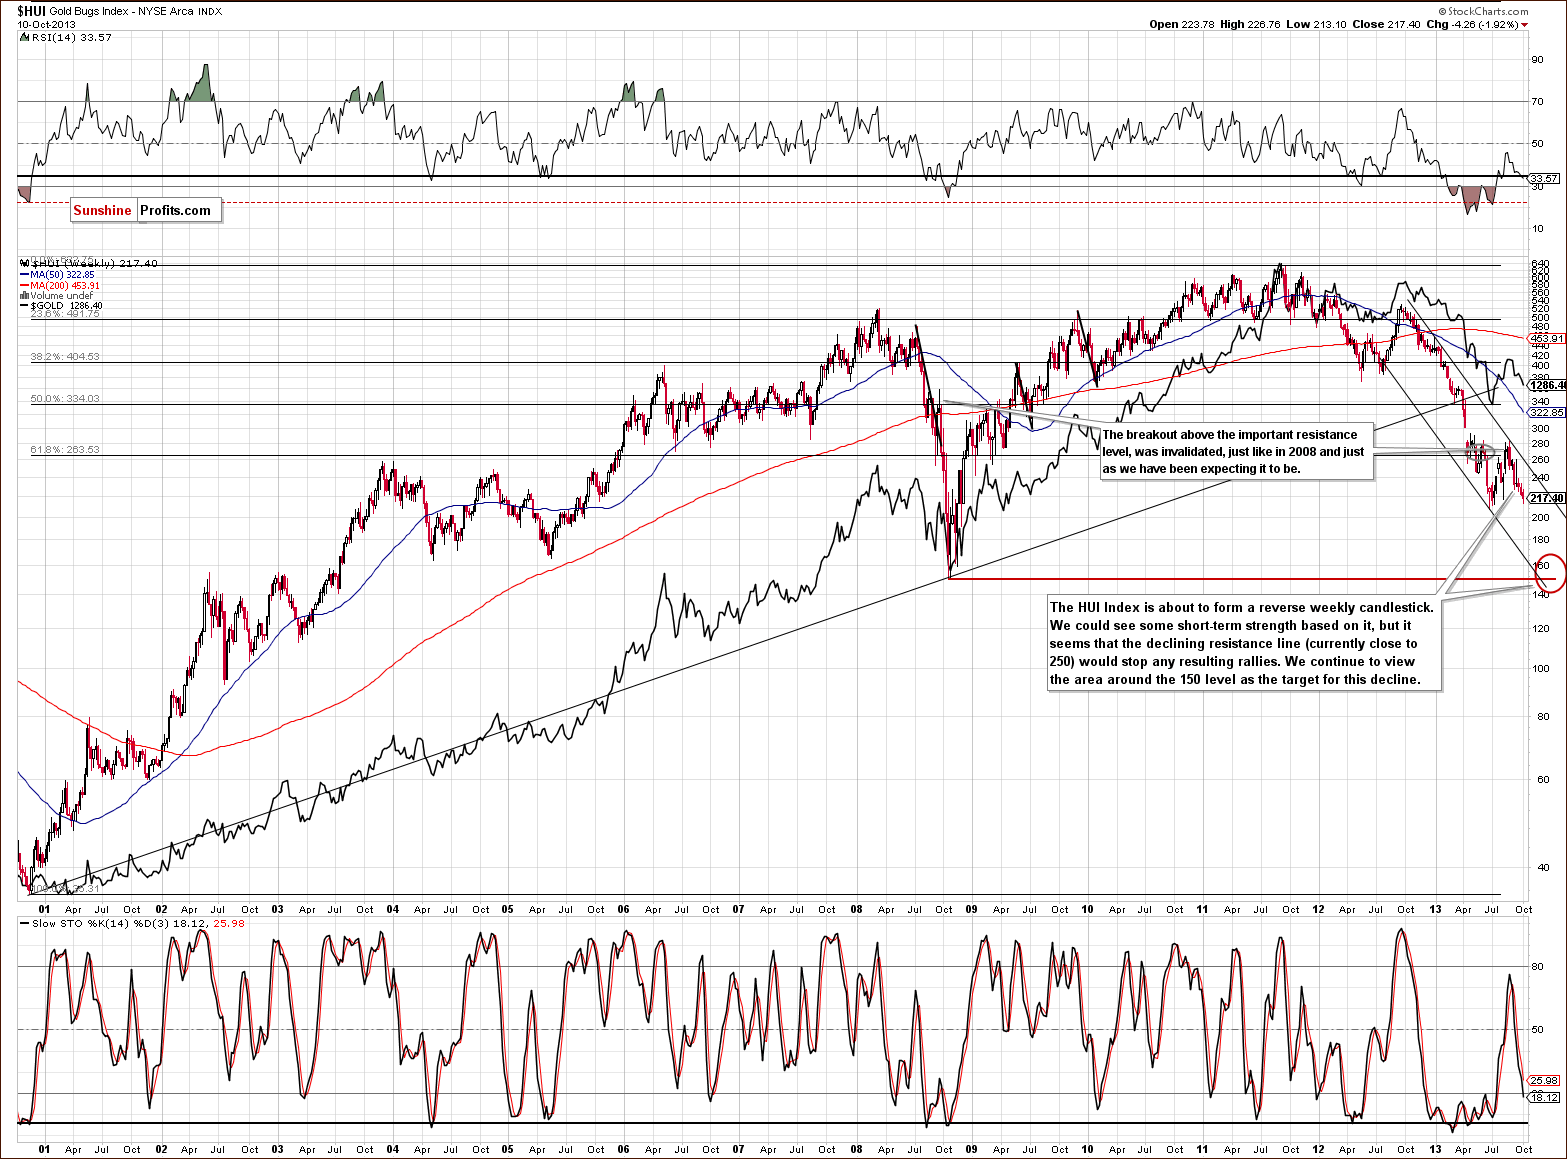
From the medium-term perspective, the HUI Index chart is clearly bearish, as the downtrend continues after the recent correction. However, on a short-term basis, it seems that we will see a reversal pattern based on the weekly candlestick. Therefore, while the HUI is likely to move to the 150 level or close to it in the coming weeks/months, we could still first see a correction to the declining resistance line, which is currently close to the 250 level.
Let’s take a look at the juniors’ performance.
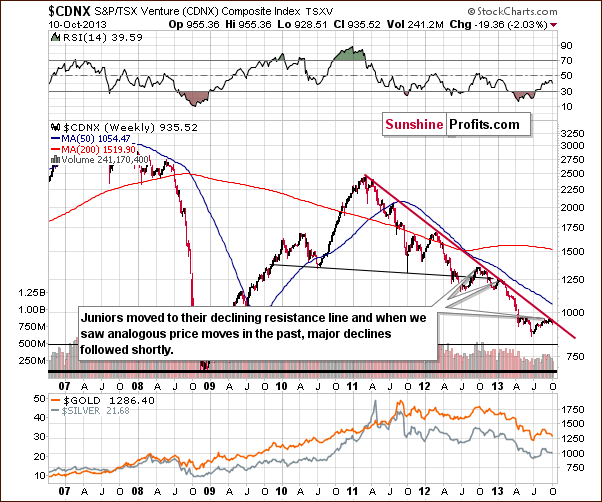
Looking at the above chart, we see that there was no breakout above the long-term declining resistance line this week. Therefore, the situation hasn’t changed and remains bearish.
As we wrote in our previous Premium Update:
(...) after several weeks of sideways trading, juniors moved to the declining resistance line based on the March 2011, March 2012 and January 2013 highs. It’s worth mentioning that in the past when we saw analogous price moves, they all resulted in major declines.
If we see similar price action here, it will probably lead to a continuation of the downward move – and this seems very likely.
Having said that, let’s move on to the gold stocks to gold ratio.
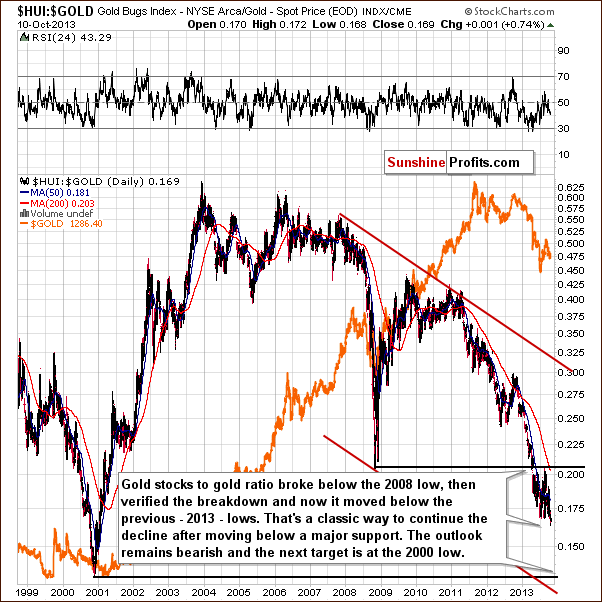
In Wednesday’s Market Alert, we mentioned that we saw a major development in the case of this important ratio, and we can see it directly on this chart. The gold stocks to gold ratio moved below the previous 2013 lows, and from this perspective the decline simply continues.
Please note that significant underperformance of the ratio was the thing that preceded the April plunge earlier this year. Of course, it doesn’t mean that metals or miners have to move lower immediately, but in our view, it’s just a matter of time.
Before we summarize, let’s examine the GDX ETF chart.
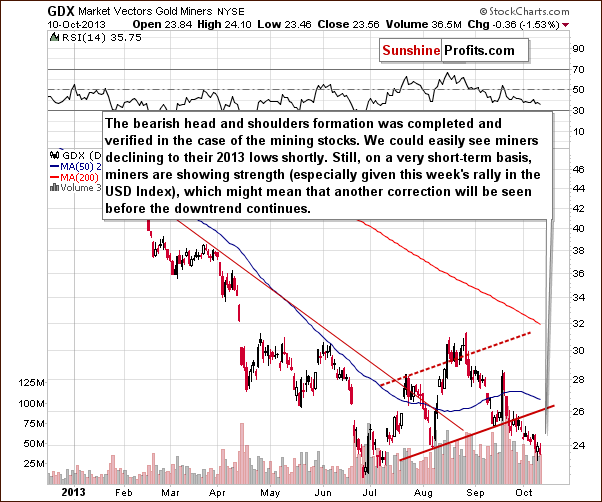
As we previously mentioned, the head and shoulders pattern was completed in the case of mining stocks and the implications were bearish but not confirmed by other representatives of the precious metal sector.
The situation didn’t change this week. We didn’t see a confirmation of the breakdown below the neck level of the head and shoulders formation (we saw the breakdown, though) in case of gold, and we didn’t see an invalidation of the formation in case of mining stocks. Therefore, from this point of view, the situation remains a bit unclear, but with a bearish bias.
In the short-term, we saw strength in mining stocks. It seems that they were oversold on a short-term basis and needed to correct. Since they managed to do this, even though the dollar rallied sharply earlier this week, we can conclude that on a very short-term basis, this sector could rally further. However, we think that this rally would be nothing significant, simply another counter-trend bounce.
Summing up, the medium-term outlook for mining stocks was bearish last week and it is even more bearish this week based on the breakdown in the case of the gold stocks to gold ratio. However, in the short-term, we could see a small correction based on the recent strength in miners and the reversal pattern based on the weekly candlesticks. The next big move is likely to be to the downside, though.
Gold and Debt Ceiling
Debt ceiling talks are becoming increasingly popular in the media, so in case you’re wondering what would an increase or lack thereof have on the gold market – here we are. In short, in our view it’s highly likely that the debt ceiling will be increased and that the talks about it are really smoke and mirrors that aim to convince voters that the deal wasn’t coined already a long time ago. The debt ceiling will be increase in our view, because other options are too costly and much harder to do politically.
Will an increase in the debt ceiling end the decline on the gold market? Not likely, gold has already declined when it was mentioned. Besides, we have already researched this topic over 2 years ago.
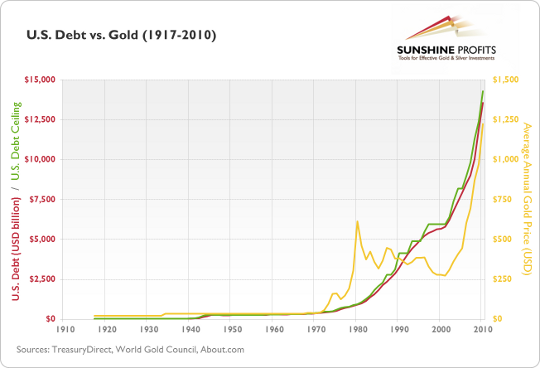
What we wrote back then remains up to date:
As you might see, gold has roughly followed the rises in the U.S. debt level since 2000. On the other hand, you will also surely notice that there were periods in gold’s history when the metal traded without visible correlation with the aforementioned debt. In short, the above chart confirms that growing uncertainty linked to the growing debt pile might fuel the price of gold, however it also confirms that markets cannot follow a given economic indicator with reasonable precision at all times and confirms what we’ve emphasized many times – that fundamental factors can only point you the general direction in which a market is going, but they do not provide timing details.
Although the link between gold and debt ceiling might seem like a strong and positive one – it doesn’t really work on a short- and medium-term basis.
Letters from Subscribers
Q: How would you comment on this piece?
A: We don't think that gold is set for a 20% rally soon. At least not without declining significantly before that. Actually, the most interesting thing that you can read on the above page is the bearish factor that is presented as a bullish one.
"If you had asked a couple of weeks ago what would happen to gold in the event of the current situation, every gold analyst would have said gold should move higher because historically that's what happens at times of economic and political uncertainty."
Gold didn't rally, which means that it's not responding to positive fundamental factors - that's very bearish news because this means that there's not much that can currently make gold move higher.
"Yellen will have the same concepts as Bernanke. So money will continue to be printed, the economy stimulated and interest rates kept low as possible and that's going to stimulate inflation, be good for commodities and bad for the dollar,"
Sure, these are factors that will contribute to gold's move higher over the long run - not in the short run. Monetary authorities have been printing money for more than a year and gold is down more than 25% in a year - why would this factor make gold rally in the short run - it clearly can decline despite the bullish fundamental outlook.
The reason for gold's decline is not really logical; it's emotional (or caused artificially, and perhaps a mix of both). Gold will eventually move higher based on its fundamental outlook, but that's not what drives market in the short run and gold can plunge despite positive fundamentals. This is what the technical picture suggests.
Q: The one thing I would like to know is when I should purchase Gold / Silver to be held for the long term i.e. 2 years. Is there a time coming up soon? If so more or less when do you predict it may be and what sort of price / oz. would I need to buy at?
I've already made $500 dollars using Sunshine Profits’ advice. I'm pleased with this since it is only the first week.
A: Our best guess is that we will have a long-term buying opportunity for gold and silver in a few (1-4) months and we expect gold to move close to $1,100. We're looking for silver in the $15-$17.5 range and HUI at 150.
Q: I would be really interested to know if Sunshine Profits includes factors like the US Government defaulting on its debt payments?
This type of news makes me feel very uneasy holding my savings in USD. The sooner I can get them into long term protection of a solid assetlike Gold / Silver the safer I will feel about it. So far I have no holdings in Gold or Silver- all my entire life savings are in USD. I can't exchange them for another currency at this stage because I all my savings in an account at BullionVault [our affiliate link: http://www.bullionvault.com/#SUNSHINE1]ready to buy when Sunshine profits gives the GO signal to buy precious metal.
I really would like to know what to do at this juncture.
A: From the fundamental point of view, we don't think that the U.S. Gov't is going to default on its debt payments - they will simply continue printing more money - Matt Machaj, PhD analyzed the situation thoroughly and many of his thoughts about the (lack of) tapering of the money-printing programs can be found in the latest Market Overview report. This is where we discuss fundamental issues in greater detail. In Premium Updates and Market Alerts, we also take these important events and possibilities into account, but mostly through the way markets react to them. If something is really significant, then we will see that in price moves and the size of the volume that accompanies these moves.
Also, to be precise - while we are not providing investment advice (we can't because of the way the financial sector is regulated) - we can provide some general suggestions and at this time it is not our suggestion to be completely out of the precious metals market. We think that the "insurance" part of the portfolio should be/remain invested "just in case". We also think that half of the long-term investment capital should be in the precious metals market (we think that being out and waiting for the long-term buy signal with just half thereof is a good idea). Take a look at what happened to gold and silver in 1976 - would it really matter that much if you didn't buy at the exact bottom but a few months earlier given how high prices soared in the following years? The bigger risk was to miss such a rally and this is the risk that we particularly focus on in case of the long-term investment capital. This all stems from our research and views on portfolio structuring. You can read more about it in the following report.
Q: That article/recommendation by Goldman Sachs – “gold a slam dunk sell” is pretty scary. You reckon we in a gold bear market for the next 12 months?
A: Two projections are made in this article - one is that gold would fall to $1,050. It's not clearly said whether this should take 12 months or whether it's likely to be seen no later than in 12 months.
We agree that most likely a sizable decline will happen in gold within the next 12 months, but we think that it will happen much sooner, perhaps in the next few months. As you read today, the HUI:gold ratio suggests that the next big slide in the precious metals market is already underway.
Will gold drop to $1,050? It could happen, but doesn't have to happen - it seems likely to us that gold will bottom between $1,050 and $1,150. The final part of the decline could be very volatile - we could even see just an intraday drop below $1000 and a daily close above $1,050 or even back above $1,100.
Q: Interesting comparisons of dollar and gold here:
A: The article is interesting, but we don't necessarily agree with the points that are made in it. The essay mentions several points that have contributed to dollar's move lower (like "European Union's debt crisis has been fairly calm of late"). In our opinion, these factors are already in the price - they don't support a move lower from here - they simply justify what has already happened.
As far as a comparison of gold and the dollar is concerned, we don't agree with the description on the chart - it says "notice the inverse correlation to gold", but at the same time we can visibly see (right on these charts) that the short-term correlation was actually positive - gold declined along with the USD Index in September. The author argues that a further decline in the USD Index could trigger a bigger move - one that would take the USD Index below 79 (and it could certainly be the case as you can see on this week's medium-term USD Index chart). This move would be of short-term nature, and as such should be taken into consideration along with short-term correlation coefficients. There was no significant negative correlation between gold and the USD Index. More precisely, on average gold did not respond positively to the dollar's weakness. Consequently, is it certain - or even more likely than not - that such a decline in the USD Index would trigger a huge rally in gold? We don't think so. At this time it seems that such a move up in gold would be rather limited.
Q: I'm new to investing in precious metals so please excuse this question if it may seems obvious.
I've been reading all Sunshine reports (and others) with a lot of interest trying to make sense of what is going on. In your Market Overview report (which I have just subscribed to) you explain in detail that Gold is used as a hedge against the "System" as opposed to a hedge against "inflation" By the system you meant monetary system?
I've been reading a lot about the US government on the brink of default (within a week) Meaning that the Government of the USA and government responsible for the world reserve currency on which most other countries in the western world is based on is at the point of default on its 17 Trillion dollar debt.
Everywhere I'm reading it is saying "stay away from gold" at the moment. This includes the likes of Bloomberg and Morgan Stanley ( http://www.bloomberg.com/news/2013-10-10/gold-swings-above-1-300-as-investors-weigh-potential-debt-deal.html)
This is my question: If the USA is about to default on its massive debt payments debt does that not raise the real and impending possibility of a total collapse in confidence in the dollar monetary system? i.e. "the system" your articles refers to?
It seems like the advice we are receiving from everyone is the exact opposite of what we should be expecting?
A: Generally, the “dollar system” is both dollar as a currency and dollar understood as dollar denominated assets; bonds, stocks, derivatives, credits. This month’s Market Overview focuses a lot on the system itself and how it’s currently performing.
You are correct to view US government's default as something bullish for gold – people should be willing to purchase protection in case of a resulting crisis. However, in the short run, markets are not logical, but emotional (and that’s why we put so much effort in analyzing charts and designing financial tools that can help us analyze the short-term price swings). There’s also the question of market’s interpretation of the above. Do markets really believe that the government will cause a financial crisis by refusing to print some more money? We don’t think so. At the same time, markets have become convinced (to a large extent) that printing lots of money doesn’t make gold move higher and that it’s not even inflationary.
With the above in mind – markets can simply put only a small weight on the above information. Plus, gold was previously rallying for a decade and needed to correct – similarly to what was the case in 1976.
What to do given the above? Have some money invested for the long run (a “bet” on being correct as far as the fundamental picture is concerned) and at the same time that markets will not act logically in the short term. Since in this case determining the direction in which market will move is more difficult, be sure to use only small amounts of capital for trading purposes.
Summary
The situation for the USD Index remains unclear for the short run, but gold’s underperformance to the US dollar is a bearish factor on its own. The Correlation Matrix, however, suggests that the link between precious metals and the general stock market is more important. In the past few weeks the precious metals sector responded to stocks’ rallies, but not really to stocks’ declines. This is another bearish factor, but there’s more to this relationship than just that. Stocks rallied on Thursday, and gold has indeed responded with lower values. The invalidation of the breakdown in the case of the stock market is therefore a bullish factor for stocks and a bearish one for gold – and to a smaller extent – to the rest of the precious metals sector.
Gold itself looks like it’s about to verify the breakdown below the head-and-shoulders pattern, but unless the price moves below the $1,285 level which corresponds to the 38.2% Fibonacci retracement level, we will not have a true bearish outlook. The situation in silver is similar – SLV moved below the 20-day moving average, thus invalidating the previous breakout, but the price remains above the 2008 high. A breakdown below this level would be needed for the situation to become really bearish.
The HUI to gold ratio suggests that the next big move lower in the precious metals sector is already underway, but at the same time the very short-term price action in the HUI Index and GDX ETF suggest that we might see a short-term rally before any additional declines are seen. The same goes for the miners’ strength when the USD Index rallied earlier this week.
At this time we think that opening a small speculative short position is a good idea (half of the regular size of the position). The main reason is the “what if” question. If gold does indeed decline from here – which seems more likely than not – the sharpness and size of the decline could be very significant – perhaps a $100 decline will be seen. Given stocks volatile and bullish action on Thursday, it seems that we can expect bigger moves also in other markets, and it could be the case that the breakdown in gold would be verified when gold is already much lower – the perspective of missing a huge move lower is not encouraging, given that we are quite convinced that the next big move will be to the downside.
At this time the risk/reward ratio is favorable for opening the position, not because the risk is low, but because the potential reward seems very significant. In such scenarios, small positions should be used.
This time we will set the stop-loss orders above the declining resistance lines, so that you would be taken out of the market if the situation became bullish.
Trading – PR: Short position in gold, silver and mining stocks.
Trading – SP Indicators: No positions: SP Indicators suggest long positions, but the new self-similarity-based tool suggests short ones for the precious metals sector. We think that overall they cancel each other out.
Long-term investments: A half position in gold, silver, platinum and mining stocks. As far as long-term mining stock selection is concerned, we suggest using our tools before making purchases: the Golden StockPicker and the Silver StockPicker
| Portfolio's Part | Position | Stop-loss / Expiry Date |
|---|---|---|
| Trading: Mining stocks | Short position (half) | HUI: 240, GDX: $26 |
| Trading: Gold | Short position (half) | $1,330 |
| Trading: Silver | Short position (half) | $22.60 |
| Long-term investments: Gold | Long - half | - |
| Long-term investments: Silver | Long - half | - |
| Long-term investments: Platinum | Long - half | - |
| Long-term investments: Mining Stocks | Long - half | - |
This completes this week’s Premium Update. Our next Premium Update is scheduled for Friday, Oct 18, 2013. We will continue to send out Market Alerts on a daily basis (except for when Premium Updates are posted) at least until the end of October, 2013 and we will send additional Market Alerts whenever appropriate.
Thank you for using the Premium Service.
Sincerely,
Przemyslaw Radomski, CFA

