
As traders we are at times tempted to dive into the deep end and hope that a life preserver will be waiting for us in case we need it. But that kind of attitude can lead to going under and swallowing a lot of water. Experienced traders know that at times the best action to take is no action - to sit on the sideline and wait for the right opportunity. In other words, at times, the smartest thing to do is - nothing. More trading doesn't mean better trading. Keep in mind that markets can remain irrational longer than a trader can stay solvent. In these stormy waters this simple wisdom is more important than ever.
In this harsh economic environment it is more important than ever to make the right choices and look reality squarely in the eye. On Friday, the Bureau of Labor Statistics announced that job losses were running at a slightly slower clip than during the first quarter. Wall Street thought this was good news. But more than half a million additional Americans out of work certainly didn't find any comfort in that particular statistic. With housing starts and auto sales down, with the big decline in consumer credit ever recorded, these are times to be cautious. At Sunshine Profits we scan this harsh investment landscape for trading opportunities that will help you find the right wave and ride it to profits.
This week's theme in precious metals and several other important markets is that although much has happened, little has changed. In the previous Premium Update, I wrote about the testing of the support lines. I posited that once they are verified, we would have a buying opportunity for our speculative capital. We have seen the testing patterns in several important markets, but the results are not yet verified, which is why patience is important. If the general stock market declines to its support level, USD and precious metals verify their previous trend lines and PM stocks show strength, we will have a particularly favorable situation to enter new speculative long positions. I would like to point out that as far as the overall long term growth of your capital is concerned, the risk is to be out of the precious metals market, rather than to be in it.
For now, let's take a closer look at the charts.
Gold
This week I will begin with technical analysis of the precious metals markets. Charts are courtesy of stockcharts.com.
Let's keep in mind that the price of gold has climbed 140 percent over the last five years, although it is only up 3.2 percent over the past 12 months.
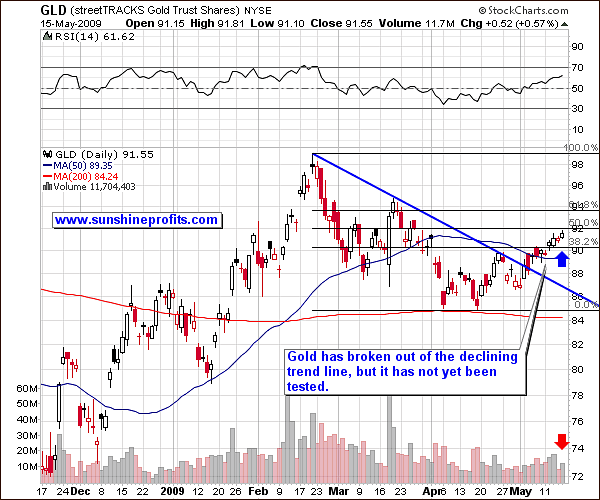
Last week I wrote that gold is likely to test its recent trend line, before moving substantially higher. This move has not yet taken place but is still probable. We had one day of testing in the beginning of May, just after the breakout, but it was insignificant, a blip on the radar screen when compared to the size of the pattern over several months.
Gold is reaching a 50% Fibonacci retracement level and made a new high on low volume. I consider that to be a short-term bearish signal. Prices often correct half of the preceding move before resuming their main direction. (In technical analysis, Fibonacci retracement is created by taking two extreme points (usually a major peak and trough) on a stock chart and dividing the vertical distance by the key Fibonacci ratios of 23.6%, 38.2%, 50%, and 61.8%. Once these levels are identified, horizontal lines are drawn and used to identify possible support and resistance levels. Many traders like using the 50% level because of the overwhelming tendency for an asset to continue in a certain direction once it completes a 50% retracement.)
Silver
This poor man's gold has been outperforming its more famous relative in recent weeks. As usual - the situation on the silver market is similar to the situation in the gold market since they tend to move in tandem.
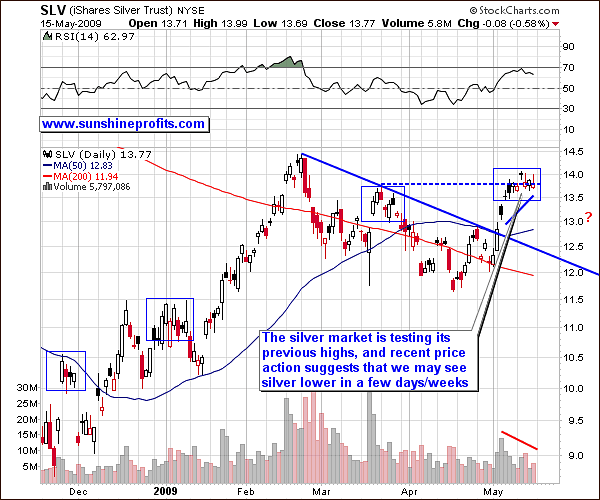
Like gold, silver has been rising on declining volume. This is especially important near the apex of the rise and volume has been really low. This means buying power is drying up. In addition, the way the price of silver has been moving in recent weeks suggests that a decline is likely. Please notice in the above chart that I have marked similar patterns from the past with blue rectangles. Note that each time these patterns were followed by lower prices. History tends to repeat itself, so lower silver prices from this point seem likely.
Just how low silver could go if a correction does indeed take place? That is a tough call to make. Silver is generally known to be very volatile and a brief drop to below $12.50 in SLV is not out of the question. On the other hand, the 50-day moving average has served several times as a support level, as was the case in January and March of 2009, so this may be the case here.
Precious Metals Stocks
There are almost no changes since last week.
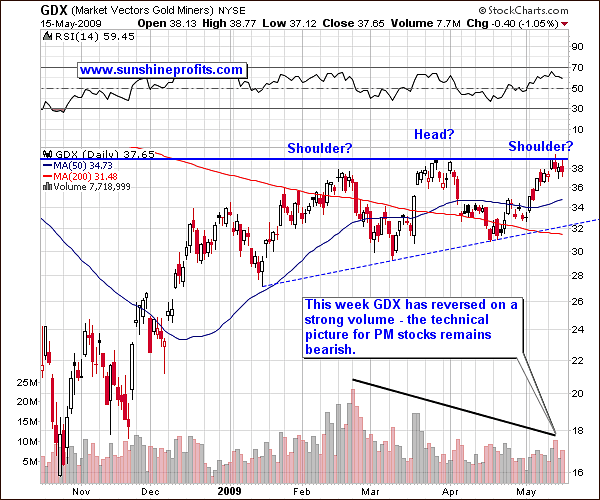
I always like to understand the price action in the precious metals market by analyzing metals along with the corresponding stocks. Last week I explained that the GDX (Market Vector Gold Miners) shows what could become in the coming weeks a classic "head and shoulders" pattern, one of the most common reversal formations. It is important to remember that it occurs after an uptrend, and when complete, it usually marks a trend reversal. The major move in the PM sector is up, but this does not rule out the possibility of lower prices in the short term. For now, the formation in the GDX is bearish in the short term. I said that since the formation is not complete, (it's still missing the rest of the right shoulder) we will have to wait for it to unfold. There are almost no changes since last week and we will have to continue to wait and see.
One thing worth noting is the intraday spike this Wednesday on relatively high volume. The GDX tried to surpass its previous high, but failed to do so. The selling pressure was too strong to sustain the rise. That day the GDX price closed lower than on the previous day, and taking into account the higher volume, this is a short-term bearish signal.
Other Markets
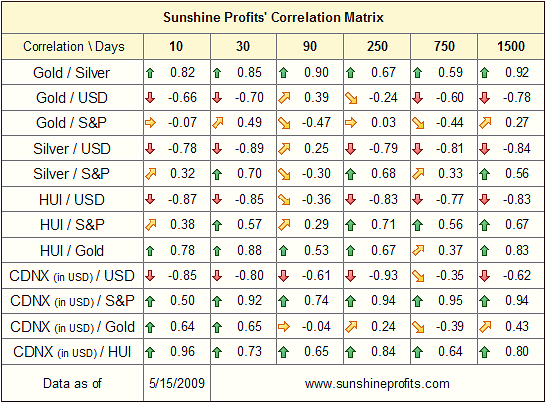
Let's move on to analysis of the other markets influencing the PM sector. We see that the precious metals sector: Gold (-0.7), Silver (-0.89) and HUI Index (-0.85) have been mostly moving in the opposite direction to the dollar in the short term (30 days column). The correlation with the general stock market (the S&P) is smaller, but is still significant in silver and PM stocks. This also means that they can be hit harder if the S&P plunges. Click here for more information.
(I would like to remind you that the 10-day column is not statistically significant, and is just a very rough estimation, which we should not use for making important investing decisions.)
I will begin with the analysis of the USD Index since it is an important short-term factor for short-term price moves in gold, more so
than the general stock market.
USD Index
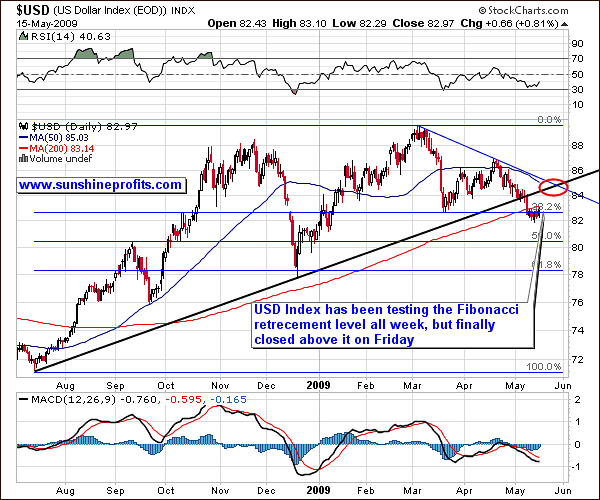
The USD has broken through its trend line, the 200-day moving average, but the 38.2% Fibonacci retracement level has been pierced only temporarily. This may mean that we will not move lower immediately, but will rather test previous trend line (this time as a resistance line). The area in the chart marked with a red ellipse marks the spot that may stop the upswing, if one will materialize.
This is even more evident if we take a look at the weekly chart.
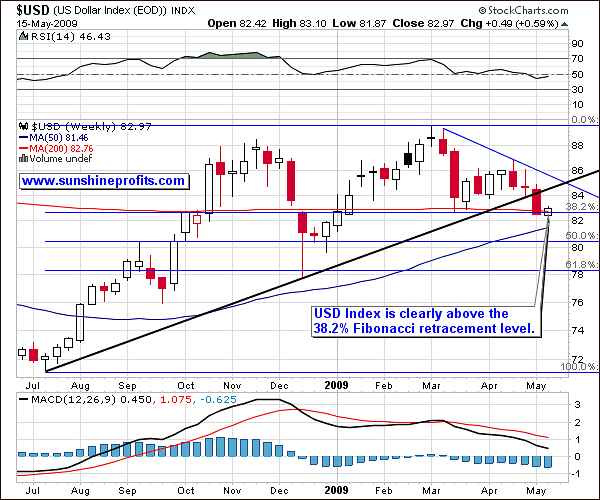
Long-term investors often prefer to use weekly charts, so looking at the USD Index from this perspective might provide additional insight.
Here, we see clearly that the USD has not broken through the first Fibonacci retracement level - a confirmation of what I wrote above.
General Stock Market
We declined exactly as indicated a week ago.
For the past two weeks I have reported that the chart for the DIA (the ETF that tracks the Dow Jones Industrial Average and allows me to analyze volume) was bearish as the value of the DJIA rose on declining volume. I suggested that this was not a breakout, but a fake-out. I said that the most probable outcome would be a small rise followed by a more sizable correction.
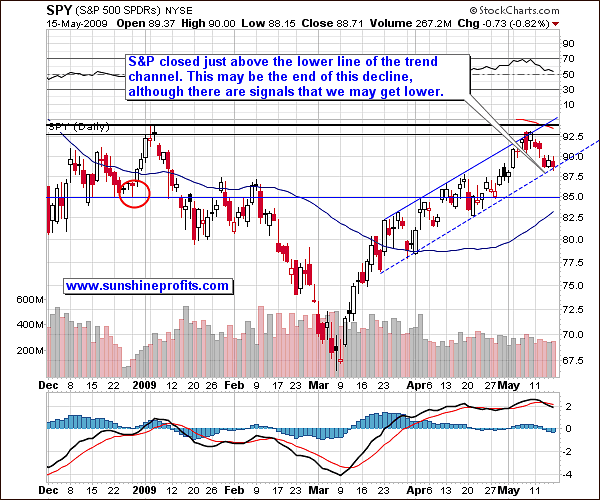
The question to ponder this week is whether or not the decline is over. We have reached the lower border of the trend channel, but I venture to say that this decline may not be over yet.
The main reason is the fact that the move in the last few months has been symmetrical and this alone may indicate that should this continue to hold, we can expect this decline to go to 85 on the SPY ETF, and perhaps (not very probable right now) even lower.
As was the case with the USD Index, more details can be ferreted out by looking at the SPY weekly chart.
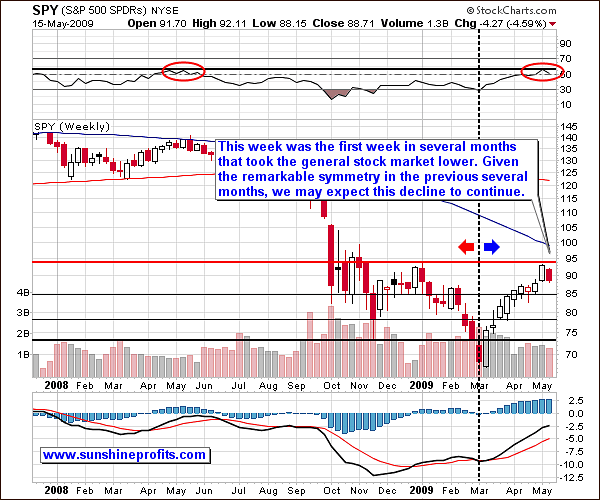
Not only is the symmetry even more pronounced in this chart, but also we see additional factors pointing to lower values ahead. The RSI indicator (a technical momentum indicator that compares the magnitude of recent gains to recent losses in an attempt to determine overbought and oversold conditions of an asset) is now at the levels that in past times meant a decline. As it is the case with all other indicators, I find the RSI is best used as a complement to other tools. The volume has been declining on average since March along with rising prices, so the buying power is drying up. This is not a bullish sign. Additionally, we have just had a first week in months, where we had a decline on a weekly basis. I have marked with black lines possible support levels on the chart.
Previous Speculative Transactions
RTP May 175 puts: purchase price $7, sell price $12, profit = 71.4%
RTP July 170 puts: purchase price $19.8, sell price $25.5, profit = 28.8%
FCX 47 May puts: purchase price $1.7, sell price $1.95 (and price was even lower on Friday, when they expired), profit = 14.7%
GS and GDX May puts expired, and so did RTP and GS puts purchased earlier (total 4.5%).
Summing up, accumulated profits for 2009 now amount to (1 + 71%) * 93.82% - 1 = 60.4%
Summary
As I said earlier, if there is something that I have learned in my years of trading it is that sometimes the smartest thing to do is - nothing. Right now we are already well positioned in gold since my suggestion to complete long-term purchases near the April bottom. Our position is still in sync with gold market signals. We have had a breakout since the beginning of May and it is a significant development, no matter what happens in the short term. We may have a correction from here to the $900 level in gold and to the $12.50-$12.60 area in silver, but these will not be dramatic moves from a long-term perspective.
At the risk of repeating myself I would like to point out that as far as the overall long term growth of your capital is concerned, the risk is to be out of the precious metals market, rather than to be in it. I realize that waiting for a correction with most of your holdings is tempting, but I don't recommend doing so, simply because the risk of missing out on a big move up is too big. As I said at the beginning of this week's report, experienced traders know that at times the best action to take is no action - to sit on the sideline and wait for the opportunity to dive in. But in this (long-term) case, you cannot afford to be out of the precious metals. To put things into proper perspective - if silver were to go above $100 in a few years, would it really matter if you got in at $13.50 or $14?
In the short run we accept higher risk in order to achieve higher profits over time. Maximizing the rate of return here means estimating the most profitable risk/reward entry points and allocating the appropriate amount of capital for each trade. Not always immediately, but over time, this strategy will create value for you. The short term outlook in the precious metals market right now is rather bearish, especially in mining stocks. However, since May 4th, when I sent out a Market Alert, we are partially hedged against a severe downturn in the precious metals stocks.
Mining stocks are now much more vulnerable than metals, so should the latter correct, I expect PM stocks to decline more significantly. Still, if the general stock market declines to its support level, USD and PMs verify their previous trend lines and PM stocks show strength, we will have a particularly favorable situation to open new speculative long positions.
This completes this week's Premium Update. Thank you for using the Premium Service. Have a great weekend!
Sincerely,
Przemyslaw Radomski

