
- Euro & USD Indices
- General Stock Market
- Crude Oil
- Correlation Matrix
- Gold
- Silver
- Platinum
- Mining Stocks
- New Tool
- Letters from Subscribers
- Inflation - a house made of cards
- What if the dollar doesn't decline
- Gold ETFs - decline in investor demand
- Summary
There are a lot of words in the dictionary to describe what you need these days to be a gold investor: patience, endurance and fortitude are some of them. Recently investors were beginning to lose their staying power. But, in the past, it has often worked out that just as investors’ patience runs out, gold comes charging in.
Sentiment towards gold is so low that you can scrape the floor with it. Last week gold exchange-traded funds suffered their largest outflow since January 2011 with gold falling on Friday as low as $1572.80. The world's largest gold-backed exchange-traded fund, SPDR Gold Trust, reported its fourth successive daily outflow on Monday. The sell-off since the start of the year is mostly due to a perceived improvement in the global economic outlook and concerns on the longevity of the Fed's quantitative easing.
Last week comments by top Fed officials suggesting the U.S. central bank could reduce or halt its asset buying had put heavy pressure on gold prices. Also last week, data released by the Commodity Futures Trading Commission showed hedge funds and other investment managers were shorting gold in record numbers. The number of bearish contracts held by professional speculators reached above 90,000 for the first time since mid-1999. It is ironic to juxtapose that with the rosy picture 10 years ago this month when the number of bullish contracts held by professional speculators first broke above 100,000 contracts.
Investors without the qualities mentioned above - patience, endurance and fortitude - have already been shaken out of the market. The pool of sellers is dwindling into a pond.
Forbes Magazine ran an interesting piece this week quoting a Time Magazine article:
“To hoarders and speculators gold lately has had about as much luster as a rusty tin can.”
The article itself is a bit rusty. The Great Gold Bust ran in August 1976 right at the bottom of a 50% retreat in the 1970s gold bull market. It had been only 19 months since gold purchases became legal for U.S. citizens and, according to the article, “the price has fallen more than 40% from its peak of $198 an ounce. In three chaotic days of trading last week, gold fell $14 on the London market, reaching a 31-month low of $105.50 an ounce. Though the price recovered to $111 by week's end, that is still a dismal figure for goldbugs, who not long ago were forecasting prices of $300.”
Wow. $300. It‘s almost funny to read today.
It’s often when sentiment is at its nadir that gold becomes turbocharged. After the Times article, gold proceeded to gain 750% over the next three and a half years.
Gold looked very good Tuesday when it posted the biggest gain of the year, up 1.3 percent, on Bernanke's reassurance of continued monetary accommodation combined with Italy's uncertain political and economic future. Gold broke above $1,600 an ounce, extending its rally to a fourth straight day. Italy’s problems raise uncertainty about the viability of Europe’s single currency. The unemployment rates for youths in Spain, Portugal and Greece is approaching 50% and that may spell trouble this summer. Italian elections failed to show a clear winner indicating that voters reproached the present government’s austerity measures. It also suggests political instability in Italy in the coming months. Flight-to-safety buying of U.S. Treasuries, German bunds, gold and the U.S. dollar became the thing to do. The U.S. government’s likely inability to agree on a taxing and spending plan by the March 1 sequestration deadline has added to the jittery atmosphere. Bernanke delivered the central bank’s semiannual testimony to the Senate Banking Committee sending a strong signal that he backed the continuation of the $85 billion bond-buying program.
The market largely ignored a cut of more than $200 in the gold price outlook by Goldman Sachs, one of the top global bullion banks. The bank reduced its 2013 gold price forecast to $1,600 an ounce from $1,810, citing bullion's recent price drop and an increase in U.S. real interest rates.
For those who have recently bailed out of gold it may have the allure of a rusty tin can, but for us, it still has its timeless allure, that special something that has made it a store of value for centuries and millennia. To see what is in store for precious metals in the near future let’s begin this week's technical part with the analysis of the Euro Index. We will start with the medium-term chart (charts courtesy by http://stockcharts.com.)
Euro & USD Indices
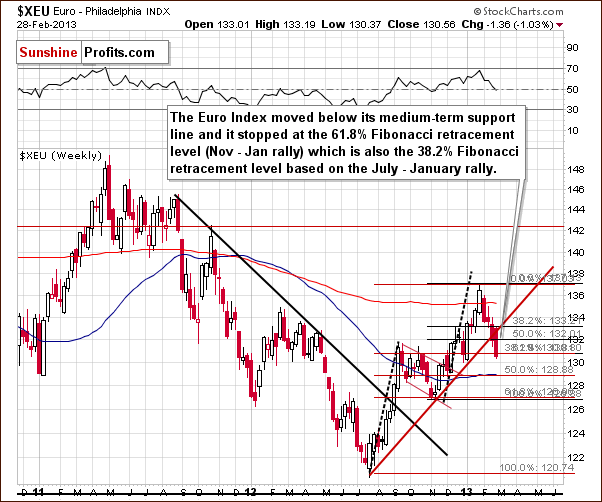
We begin our currency section with the medium-term Euro Index chart. We see that the index is now below the rising short-term resistance line so the outlook has deteriorated. However, the recent decline stopped at two Fibonacci retracement levels, one being the 61.8% level of the January rally and the other the 38.2% level of the whole July 2012 through January 2013 rally. These two retracement levels coincide and create an important support level.
The decline stopped at the level at the September 2012 high as well. Although the recent trend seems to be broken, the situation has not really deteriorated that much. Another strong support line has been reached, and the situation appears to be a bit less bullish, but still more bullish than not.
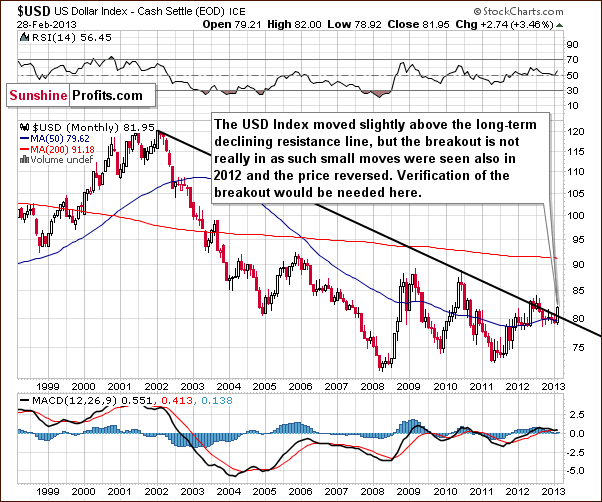
Turning now to the very long-term USD Index chart, the comments made in last week’s Premium Update remain up-to-date:
…we [saw] a move [last] week above the declining long-term resistance line which normally would be a big deal. However, in the middle of last year when this happened, it was followed by an invalidation of the breakout and a subsequent decline. We expect to see the same thing here once again. Keep in mind that we have not seen a weekly close above this resistance line and really need to see several before stating that the breakout is truly confirmed.
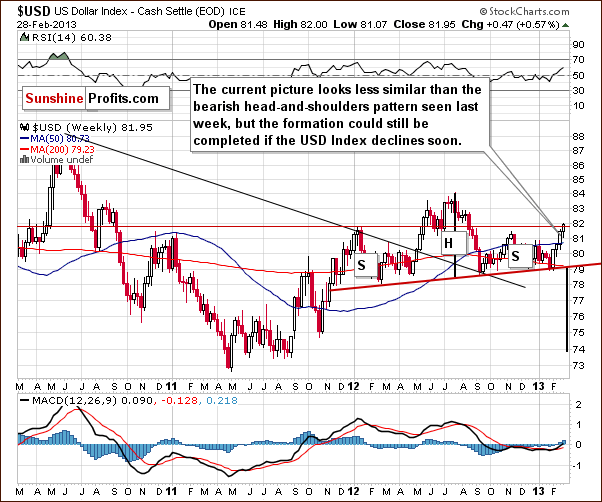
In the medium-term USD Index chart, the comments made in last week’s Premium Update are still valid as well:
We see that [the head-and-shoulders pattern] is no longer perfectly symmetrical, but this does not invalidate the pattern. It could still be the case that a double right shoulder is forming. If the index declines below the 79 level, the pattern and the outlook will once again be just as bearish as if the breakdown took place last month.
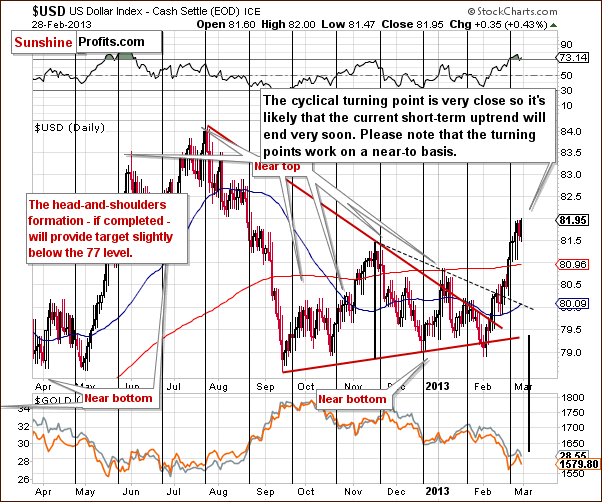
In the short-term USD Index chart, we see that the index has passed its cyclical turning point without any reaction so far. Just because nothing has been seen yet does not mean there won’t be a reversal based on this cyclical turning point. Cyclical turning points are really just approximate in nature (they have worked precisely several times in the past, though), and the overbought status of the RSI level here points to a significant probability of a reversal in the coming week.
Summing up, the USD Index moved 0.49 to the upside since our last Premium Update. It still seems likely that a reversal will be seen here based on historical data, the recently reached cyclical turning point, and the current overbought RSI level in this week’s short-term chart.
General Stock Market
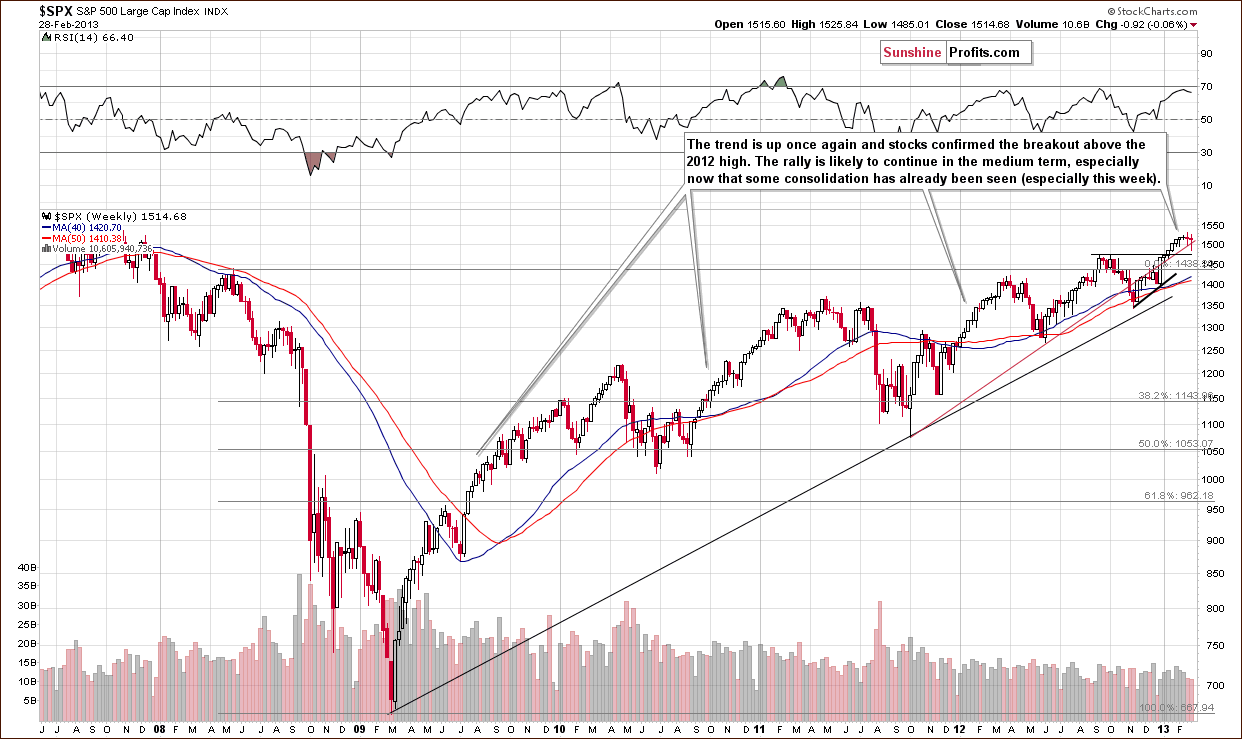
In the long-term S&P 500 Index chart, there was very little change this week and – just as it was the case last week – more insignificant consolidation is possible here though it is not inevitable. This week saw a correction followed by a move to the upside and the comments made in last week’s Premium Update are still valid:
The consolidation could already be over here and not much more is expected in the way of price declines. It seems to us that there are too many inflationary forces currently in play (open-ended quantitative easing for example) to have any volatile plunge in stock market prices.
We could see more short-term consolidation here, or the consolidation could indeed be over and prices may begin moving to the upside once again.
Crude Oil
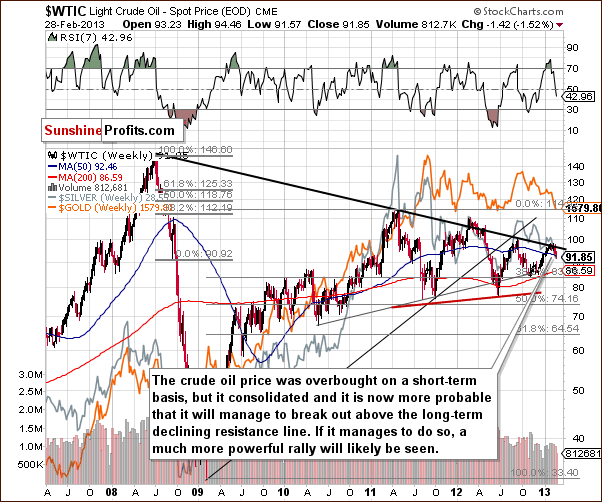
We now turn to the crude oil price chart, where we see a continuation of a consolidation this week, so comments we made in last week’s Premium Update remain up-to-date:
With some consolidation having been seen here, the odds for a breakout are much higher (60% or so) than they were a few weeks ago (40% or so). With higher stock prices and lower USD Index values, we expect the breakout in oil prices to materialize soon. Such a development could take other commodities as well as the precious metals to higher price levels.
The situation is no longer overbought so a rally is possible and would likely take oil’s price above the declining resistance line leading to higher commodity prices overall (including precious metals prices).
Gold and Silver Correlations
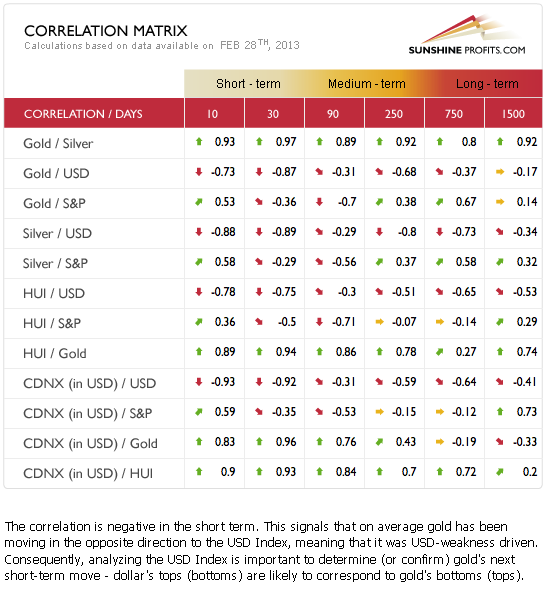
The Correlation Matrix is a tool which we have developed to analyze the impact of the currency markets and the general stock market upon the precious metals sector, (namely: gold and silver correlations). We continue to see somewhat of a return to normal as we discussed last week when we stated that we continue to see some return to normal between the precious metals and the USD Index. Unfortunately the reason is that precious metals declined as the USD Index rallied. Of course, this must be considered a better scenario than if the metals had declined in price for no apparent reason. The indications are that when the USD Index reverses, the precious metals will do the same.
Over the last two weeks (10-day column), we’ve seen a positive correlation between the precious metals and the general stock market. The 30-day column does not yet reflect this, so it’s really too early to say that the relationship is back to stay. It could be a temporary phenomenon, so it may or may not remain in place in the weeks ahead. The correlation between the metals and the USD Index does seem to be back, however, so the overbought situation for the dollar has bullish implications for the precious metals sector.
Gold
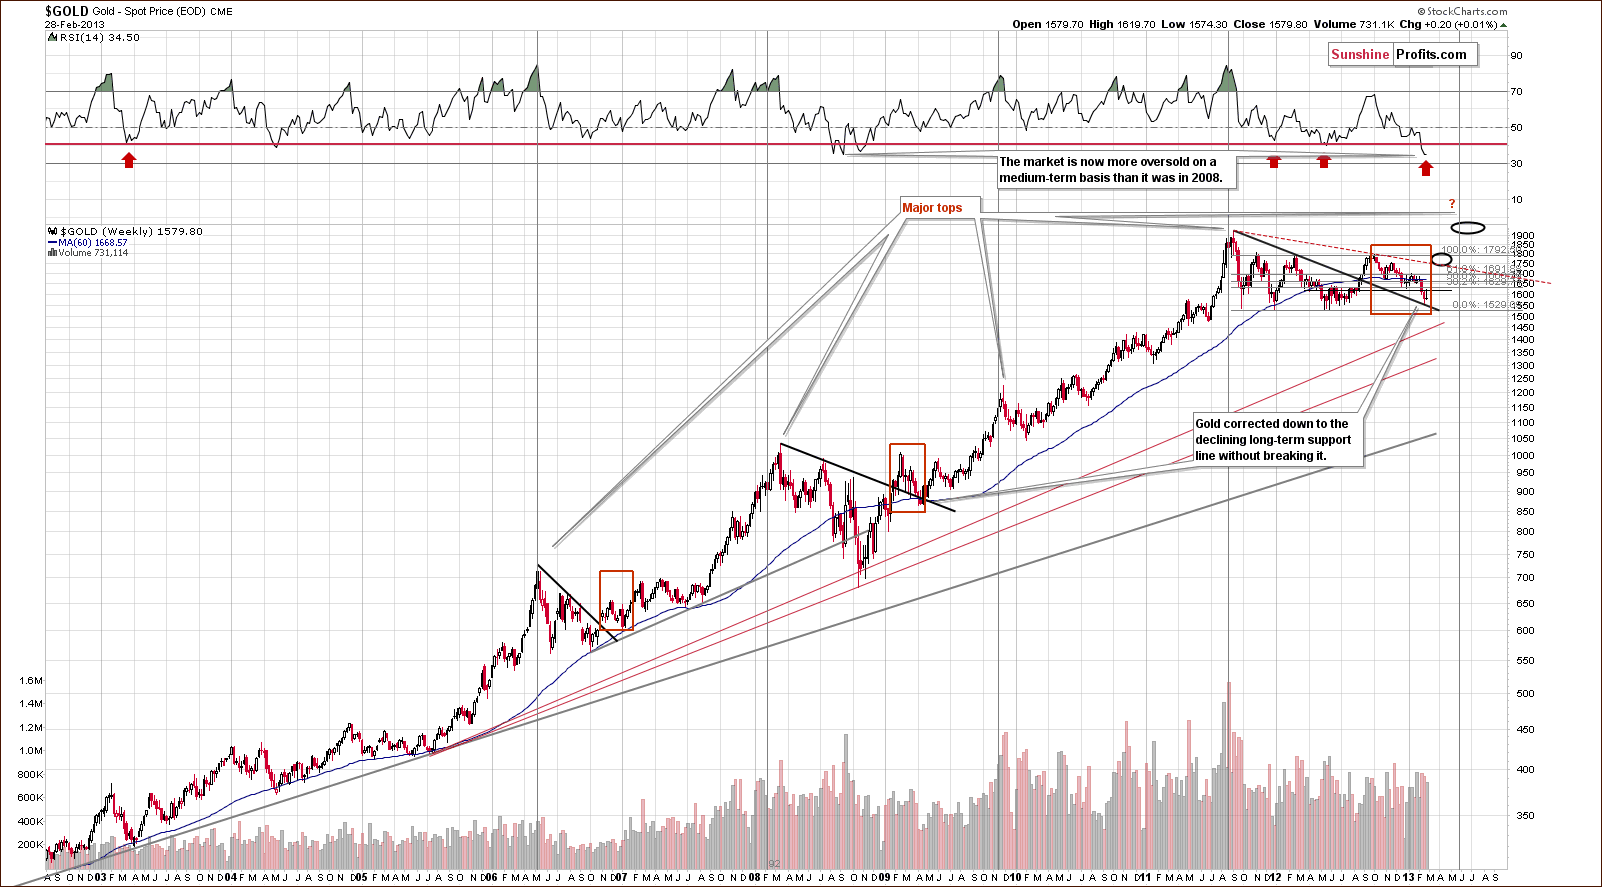
In this week’s very long-term gold chart, we see that the RSI level is extremely oversold and at levels very similar to what was seen in 2008. At no other time in this bull market has the situation been as oversold. This is one good reason for considering long positions in gold as opposed to short.
We still see a continuation of last week when gold bounced off the declining medium-term support line and no breakdown was seen. This week, back and forth price movement was seen but still no breakdown, so the situation remains bullish for the medium term.
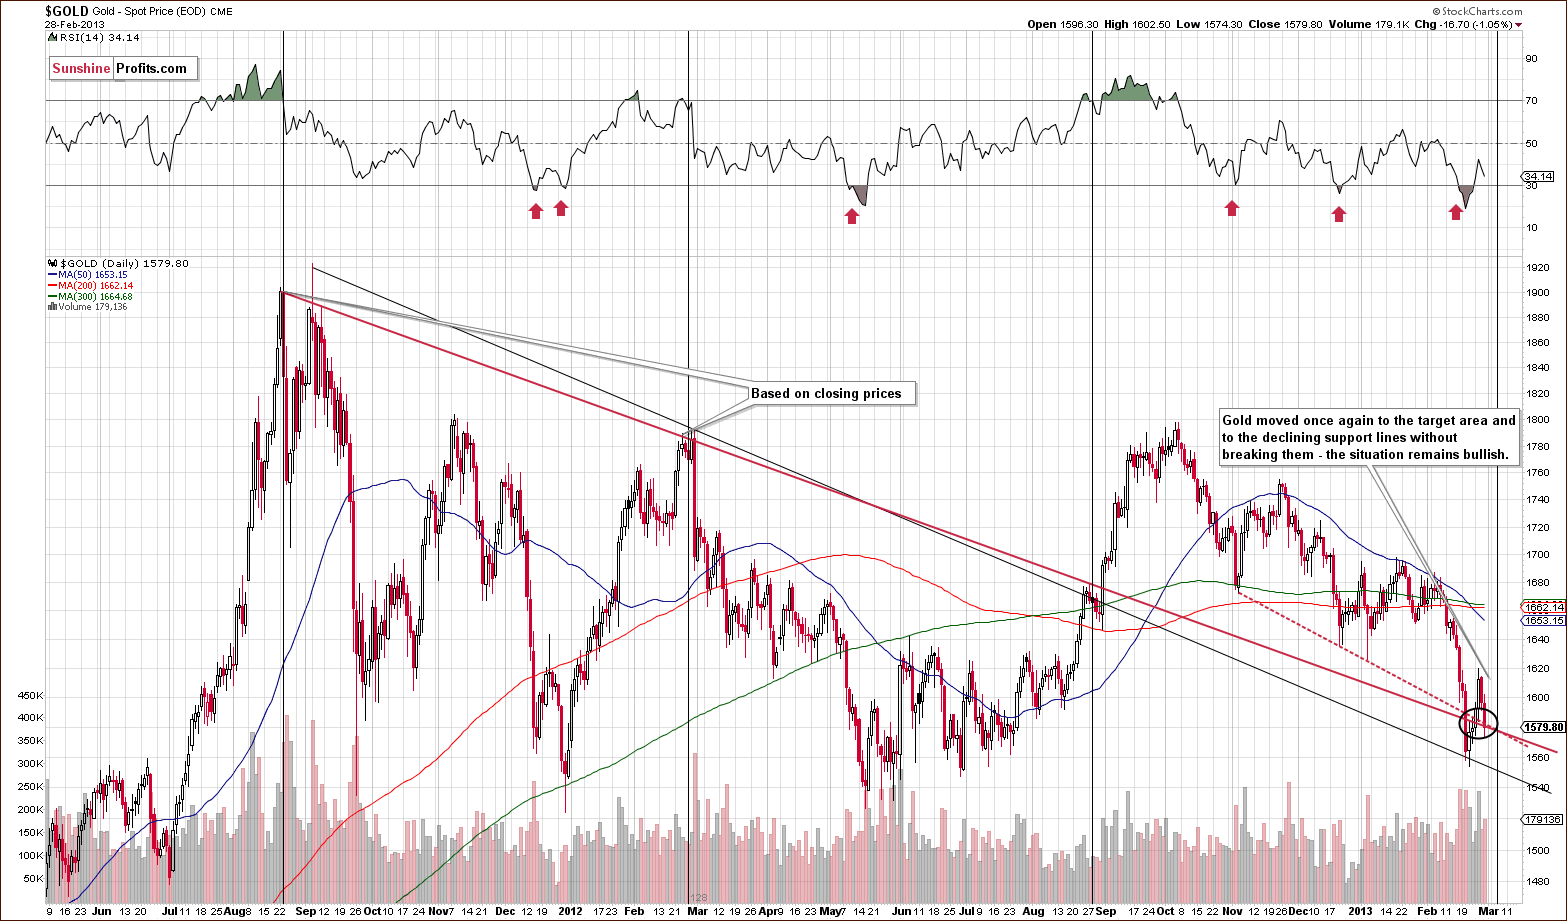
In the short-term spot-gold price chart, we see gold prices in the target area but above the point where two support lines coincide. The bottom has probably been reached, and with a medium-term cyclical turning point close at hand, the medium-term outlook remains bullish as does the outlook for the short term.
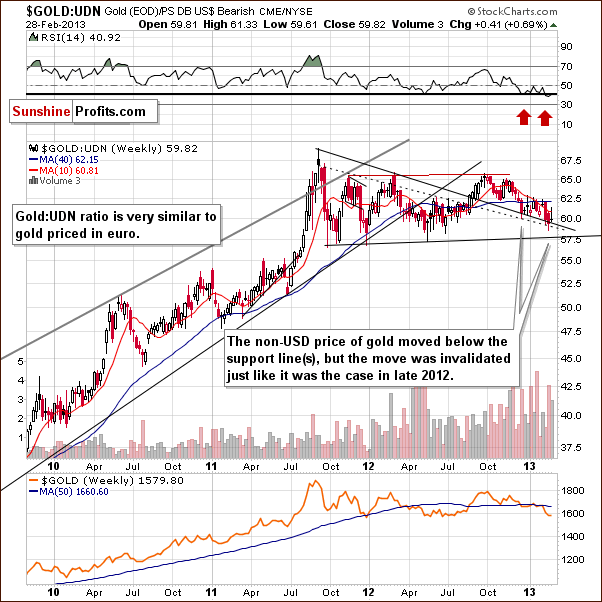
In this week’s chart of gold from the non-USD perspective, recall that last week we stated that the breakdown had been invalidated. Prices did pull back and rally this week, but overall, on average, the price in non-USD currencies is now clearly above the medium-term declining support line. The breakdown has been invalidated and the picture remains bullish.
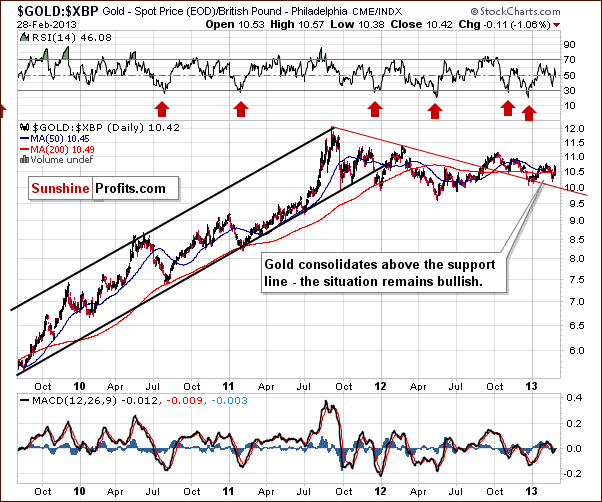
In this week’s chart of gold from the British pound perspective, we have a situation even more bullish than the previous chart. The consolidation has continued, and prices are clearly above the declining resistance line. The consolidation began last October, and the situation remains bullish; prices are expected to move to the upside. It’s good to remember the saying that, “the longer the base, the stronger the move”. The consolidation lasted for a long time so the coming rally will likely be significant. The consolidation is exceptionally visible.
The reason a lengthy consolidation often leads to a significant rally is that many investors stay on the sidelines or continue to leave the market while the consolidation plays out. This keeps the consolidation in place to some extent until something finally triggers a move to the upside to signal that the consolidation is about to end. Then an influx of capital from the sidelines quickly drives the price even higher. With longer consolidations, more investors, and thus capital, is waiting on the sidelines and can fuel following move.
This is what we have on the precious metals market now – combined with discouragement. Since the fundamentals are on our side, this creates a significant potential, just waiting to be triggered.
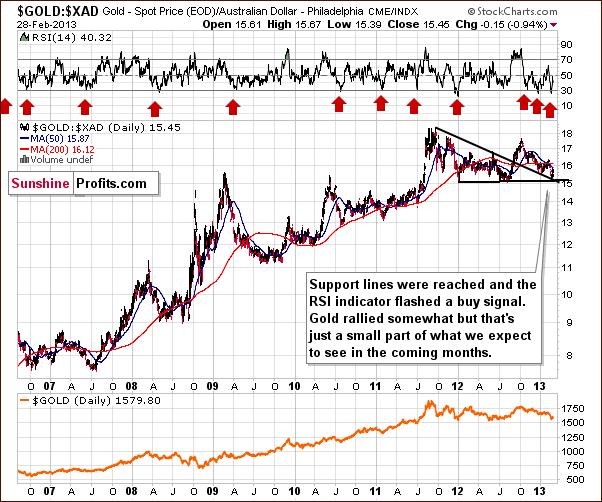
In this week’s chart of gold from the Australian dollar perspective, our comments from last week regarding the likelihood of a rally following the decline being held by the support line was quite accurate. This week saw a rally with a consolidation towards the end of the week, and the bottom appears to be in.
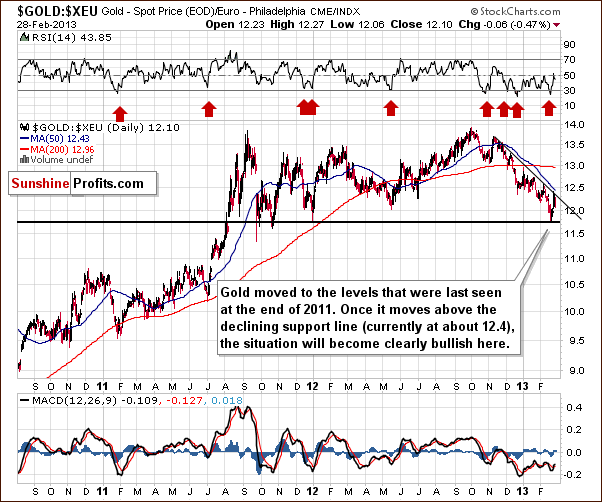
In this week’s chart of gold from the euro perspective, we see that prices were at another significant support line and heavily oversold as well. This was a bullish combination, and we expected the declines in price to reverse soon.
Gold priced in euro has indeed reversed and it moved to the declining resistance line earlier this week. Once prices take out this resistance line (currently at 12.4), the rally will likely accelerate. All-in-all this chart is mixed but will likely become bullish fairly soon.
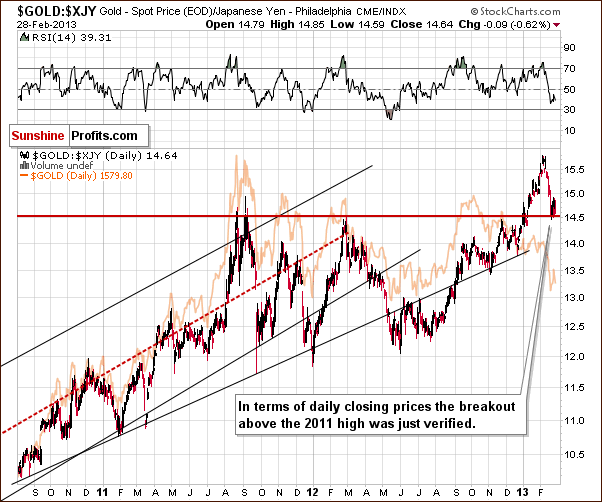
In this week’s chart of gold from the Japanese yen perspective, we see a verification of the breakout above the 2011 high. This chart has been bullish since the beginning of the year. First, the 2011 high was surpassed and then a small correction was seen which did not take prices below the 2011 high based on daily closing prices. The breakout is clearly in here, and higher prices are expected. RSI levels are now below the middle of their trading range as well – not even close to being overbought.
Summing up, the outlook remains bullish for the yellow metal and it seems that the long-awaited rally will probably begin soon. Most of this week’s charts remain bullish and indicate that the overall situation for gold is improving with the bottom already in.
Silver
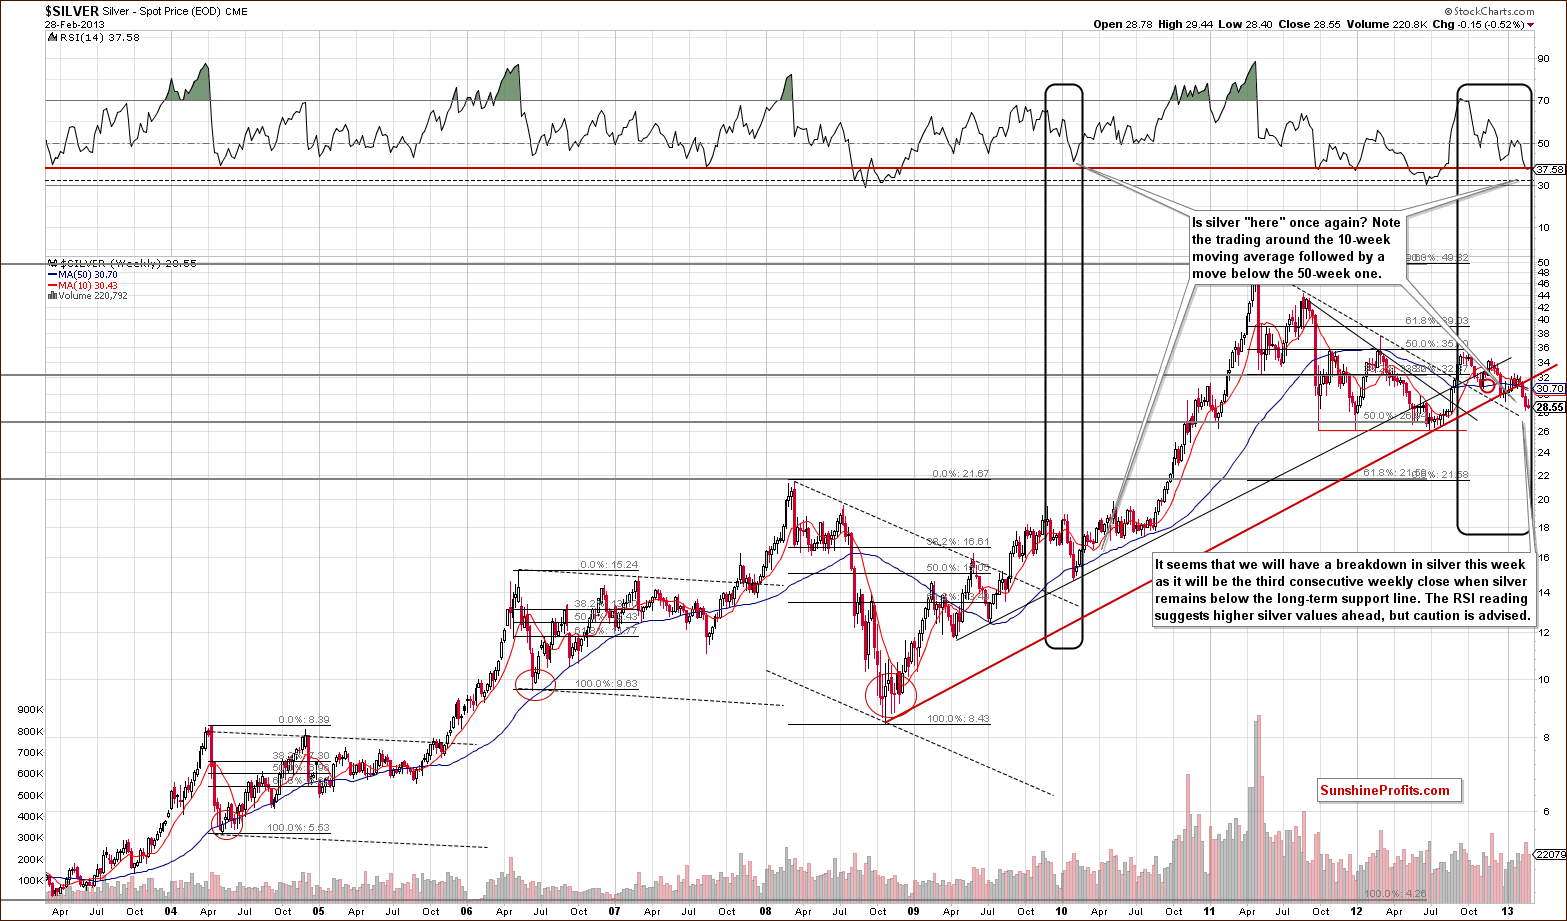
In this week’s very long-term silver chart, we see that RSI levels are now at the horizontal red line which has coincided with major bottoms many times in the past ten years. We have seen two weekly closes below the rising long-term support line (now resistance) and this week will likely be the third. This will confirm the breakdown below this line, and it causes concern for the short term. Based on that we could see a move lower to the declining dotted line (now at $27).
However, before and when taking action, we must keep in mind that silver is a tricky metal because it is a relatively small market, and it could be very well the case that it is somewhat manipulated as well. The short-term technical signals are much less important for these reasons if they are not confirmed by what we see in the in the gold market. The analysis of gold doesn't point to lower prices so the situation on the above chart is “concerning” but not yet clearly bearish at this time.
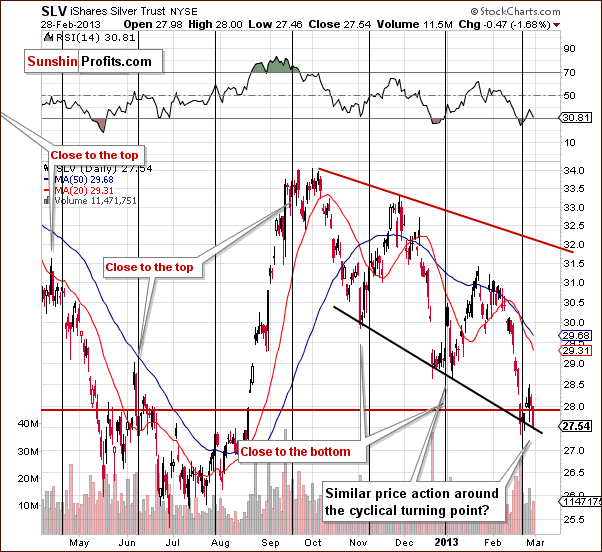
In the medium-term SLV ETF chart, we saw a rally this week after the cyclical turning point was reached. It seems that this move to the upside has not yet ended. Earlier this year, silver traded back and forth for a bit and then rallied strongly. It was actually the case also in early November, 2012. This seems to be what lies ahead once again for the white metal, and the RSI levels are also close to being oversold here.
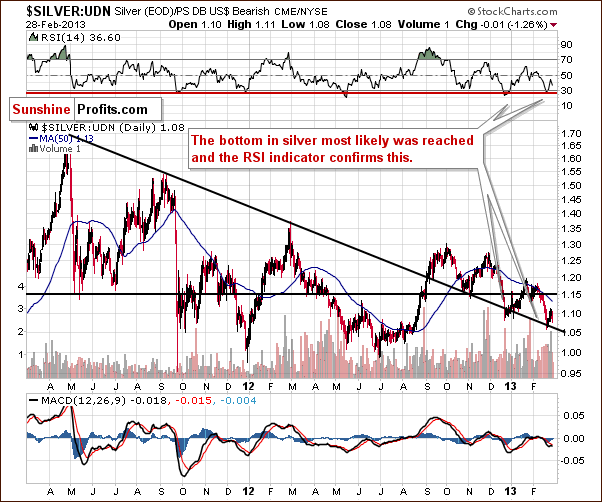
In this week’s chart of silver from the non-USD perspective, we see that the bottom is in and silver’s price is now at the declining long-term support line. When this was last seen, late in 2012 (RSI levels were oversold then as well), prices soon rallied sharply and rose 10% in just a few weeks. With similar trading patterns and RSI levels seen in recent days, there appears to be a good possibility that a sharp move to the upside may be just around the corner here.
Summing up, the signals are somewhat mixed for the white metal this week. The breakdown below the rising long-term support line will likely be confirmed with a third weekly close below this level, but it appears the bottom is in and prices may soon reverse because the situation in gold remains positive. The short-term picture is a bit more bullish with an oversold situation and trading patterns similar to those which preceded a rally very early this year.
Platinum
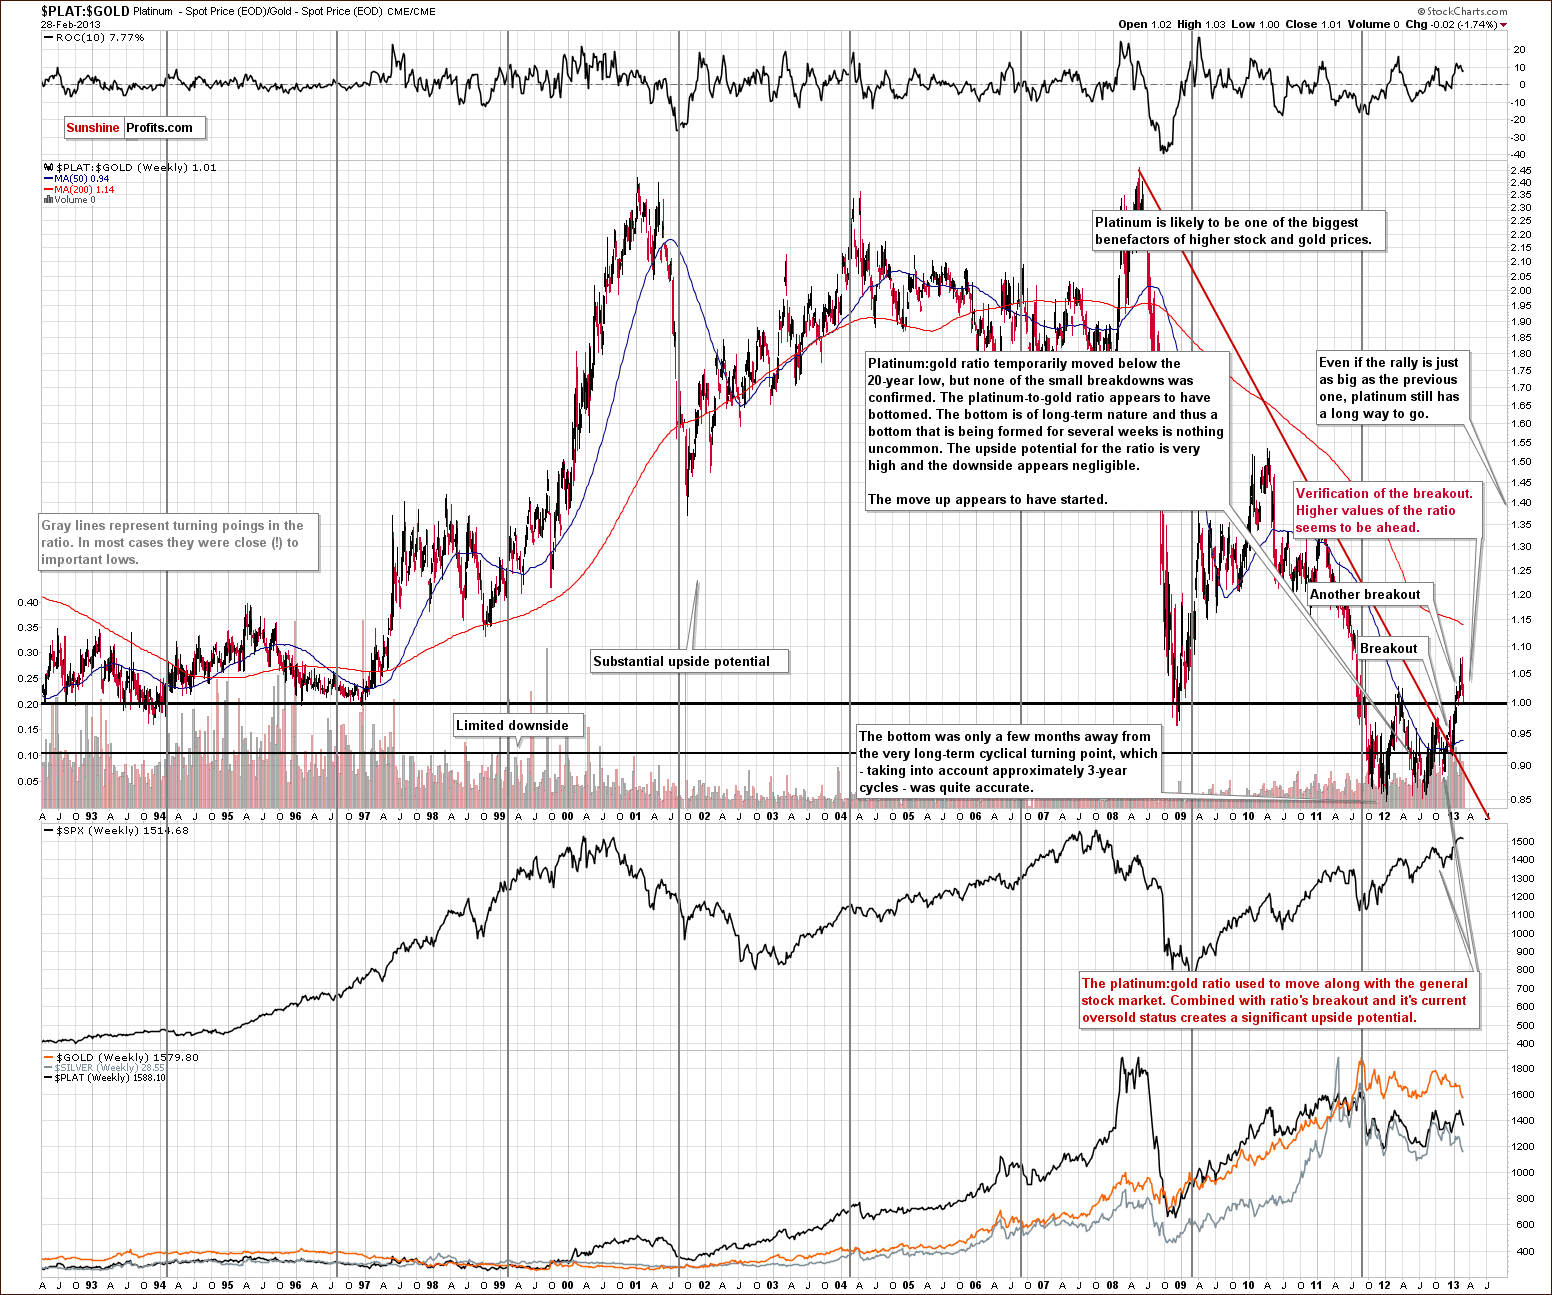
In this week’s very long-term platinum to gold ratio chart, we see that the recent weakness of platinum prices have allowed the ratio to verify the breakout above the important 1.0 level. In other words, platinum has verified being back to outperforming gold. The verification has been successful, and we expect platinum’s outperformance to continue.
Gold and Silver Mining Stocks
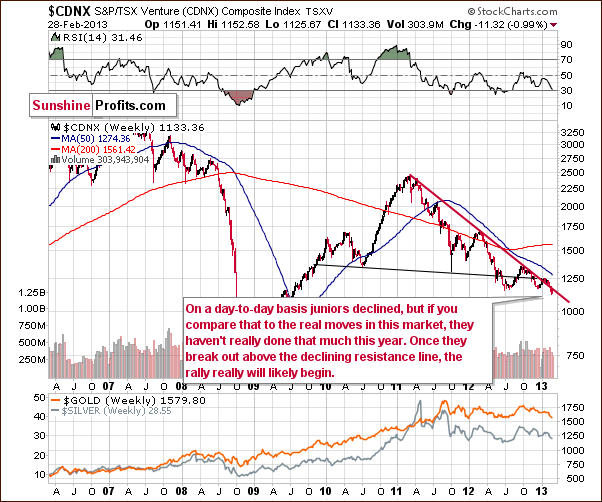
In the Toronto Stock Exchange Venture Index (which is a proxy for the junior miners as so many of them are included in it), very little change was seen this week. The index declined by less than a point since last week and the comments made in last week’s Premium Update continue to hold true:
We saw prices decline last week but in perspective, it was relatively small. A small show of strength here will once again bring prices above the resistance line with a rally likely to follow. Although we do not have bullish implications yet, this week’s weakness does not make the situation overly bearish either.
The small show of strength has not yet been seen, so the situation is unchanged.
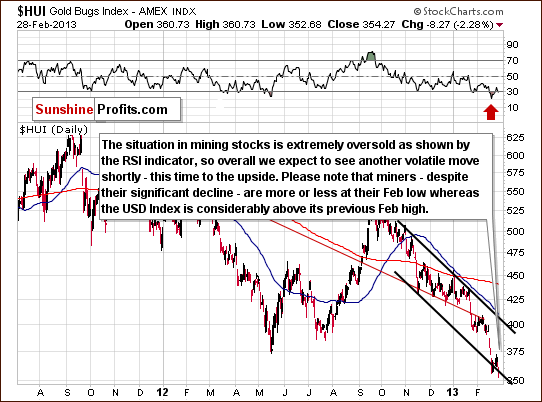
In this week’s HUI index chart, the comments made in last week’s Premium Update continue to be up-to-date:
We see an extremely oversold situation and the recent move to the downside will likely be invalidated. If this invalidation is seen, it will be a strong bullish signal and index levels of 400 and thenhigherwill be a real possibility.
Prices moved higher as expected early in the week (invalidating previous week’s breakdown) before again moving lower.
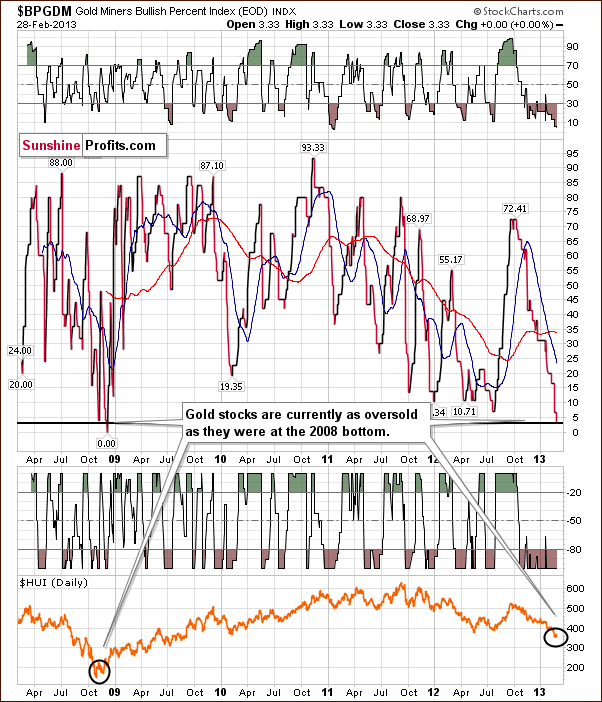
In this week’s Gold Miners Bullish Percent Index chart, we repeat what we stated in Thursday’s Market Alert:
The interesting thing about gold stocks is that the Gold Miners Bullish Percent Index just dropped below 5. The only 2 times that has been the case (ever - since this index' inception in 2008) were in early Nov 2008 and early Dec 2008 - after both parts of the major double-bottom pattern. Naturally, the implications are bullish as this is yet another signal that the sentiment is now extremely negative for the whole sector.
This chart confirms that the situation is critical. When it has been as oversold in the past, the major bottom had already been seen and higher prices quickly followed. The implications here are clearly bullish for gold prices in the weeks ahead.
Summing up, the situation remains bullish overall for mining stocks in the medium term.
New Tool Preview
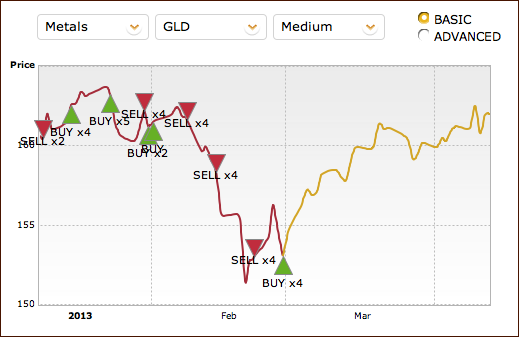
We are excited to present a preview of new tool which is nearly ready for release! We have mentioned it a few times in the past, and it has actually been more effective than your Editor in predicting gold price moves in recent weeks. We are almost ready to release the above tool in its final form, but we think it already makes sense to include it in our weekly analysis.
The main advantage here and a big leap forward is that this tool provides sell signals, not just buy signals as our SP Indicators do. When it’s released you will see that the signals will look exactly as on the above chart. Today, the tool suggests higher gold prices. The most interesting feature in our view is that it provides a best estimate for the future price path of gold (the gold line on the chart). Keep in mind that this tool recalculates every evening. It is up-to-date for today, and if gold moves decisively tomorrow, the tool could look quite different one day later. It’s like an analyst who can 100% unemotionally analyze the market each day without taking into consideration its previous decisions (no confirmation bias) – just like it should be done.
Of course, you will see for yourself shortly, but based on the above and based on what we saw in the previous months, we can say that the tool doesn't do much when prices are trading sideways. It will get you in and out of the market, sometimes you’ll win and sometimes you’ll lose, but more or less nothing will really change. Discouraged? We’re just being straightforward here – and the really major thing here is that this tool will very, very often get you on the right side of the market during big moves. The February decline is a perfect example of this.
Summing up, this gold tool, along with the many other positive signals from the gold charts this week indicate a bullish outlook for gold and the precious metals for the medium term.
Letters from Subscribers
Q: The Fed cannot control economic growth, it cannot lower unemployment, and it cannot stimulate the economy. Look to the last four years as proof of this. What they can do however, and have done, is prevent deflation and inflation. They can foster price stability, and again the proof of that is in the movement of prices over the last four years.
Inflation during that time moved up toward 4% rates, and down toward actual deflation. What didn't happen is progressive inflation or deflation. Inflation was contained within a narrow range moving both up and down no matter which measure you use. Today, gold is signaling that we are moving toward the return of a recessionary/deflationary bias in the system. We see it in the GDP which has fallen from 2.5% rates to flat, and in the commodity indexes which are breaking down. Gold has led that fall as it usually does (source: Kitco)
Is this true? I mean if the situation is deflationary and all that the Fed will keep doing is to print more money in controlled amounts just to balance the deflation, how long will it take for the situation to stabilize, or destabilize in a volatile way? Maybe if they will keep the economy and the dollar afloat for some time more, we will reach a point where the panic dissolves and investor trust comes back? Finally, it's all about trust. Have you seen the printing press actually running? What if they are only telling us what they do to influence the markets, but they don't do it at all, or they are doing it at a different pace than they say?
A: We respectfully disagree.
The situation with inflation is complex, so let's use a comparison to something closer to real life. Think about a house made of cards. We used this analogy before but it fits this situation as well. With the Fed printing lots of money and also creating it electronically the value of the dollar has to go down. The question is, relative to what.
When it goes down relative to goods as a result of printing money it’s called inflation and when it goes down relative to other currencies it's called currency depreciation. If other currencies decline in value at the same pace, we may not see currency exchange rates do much but we should see global inflation as there would be a lot more different pieces of paper (fiat money) chasing the same amount of goods. At this point the law of supply and demand guarantees inflation… eventually (!).
Just as you can't indefinitely postpone the collapse of a house of cards if you keep adding cards, you can't stop inflation if you continue printing money. You can however strive to postpone the market's reaction by using various techniques, and this is exactly what the Fed has been doing. As you mentioned, it's all about trust. The Fed can say certain things and in this way influence the markets because the markets still trust the Fed or at least take it into consideration. Also, the money is usually being created in the form of debt monetization, so it really has to take place - the debt is erased and this information is publicly known.
Gold moved much higher in the last decade so it "has a right" to consolidate without any meaningful fundamental reason - purely because too many investors entered the market and the price got too much ahead of itself.
Combining two of the above should not be interpreted as a cause-and-effect relationship in our view.
Q: Please discuss the possibility that the dollar doesn't decline: that it is the last currency left standing as a result of what is currently happening in Europe and elsewhere; and, like the last time, investors flee to the dollar for safety, not gold. It seems as though your basic premise is that gold has to go up because sentiment can't get any worse. But, of course, it can.
A: Well, you included the answer in the question by writing about investors fleeing to the dollar for safety, not gold. However, we don’t really see that happening.
The dollar is higher than it close last week and gold is more or less flat – so while gold moved in the opposite direction to the USD Index on a day-to-day basis, it overall responded positively. Gold is oversold not only from the USD perspective but also when we consider its price in other currencies. That (plus the reasons mentioned on non-USD gold charts) is why gold is likely to move higher even if the USD doesn't decline and gold is likely to accelerate if the USD does indeed decline.
You are correct that sentiment could get worse, but since it's very bad right now the odds are that higher prices will be seen, not much lower ones. Please note that today's Premium Update has approximately 5,000 words. We listed many more reasons for gold to move higher than just the very bad sentiment despite the positive fundamental situation.
Q: There are limited numbers of investors who are willing to sell their gold and silver and it seems that this group is very small at current price levels - those who could have been shaken out of the market.
How do you factor in that the all-important Gold ETFs are losing assets? Why are you not even mentioning this which would be fit for a serious analysis?
A: We have commented on the decline in investor demand (including ETF holdings) in the Feb 18th Update. The situation didn't change at all since that time so we don't think that reposting it in each update is appropriate.
The ETF holdings are in a way, a proxy for investment demand, which moved lower and which is nothing surprising given the extensive consolidation in gold prices. This, however, is a sign that the sentiment is very low, not that there are no more reasons for gold to rally. There are. Take open-ended QE, for example, and the currency war. With multiple nations trying to devalue their own currencies in order to boost exports, there is only one sure long-term winner: the precious metals sector.
Summary
The USD Index moved past its cyclical turning point without correcting so far. This doesn’t make a reversal less likely, however, and it still seems probable that a reversal will be seen which will take precious metals’ prices higher.
The medium-term outlook for the general stock market remains bullish but the implications for the precious metals are a bit unclear at this time.
The gold market corrected a bit but had a rally early in the week. The situation remains bullish overall. Silver is about to confirm a breakdown below the rising support line, but since silver is still close to its cyclical turning point and the situation in gold does not confirm this bearish outlook, we do not view the overall outlook for silver as bearish.
The situation in the mining stocks continues to be extremely oversold and can be compared to what we saw at the 2008 bottom. Even though gold stocks (measured by the HUI Index) are now more than twice as expensive and gold in general is double the price of back then, the shape of the trading patterns, the similar oversold situation and the sentiment being just as negative all indicate that this bottom is similarly significant to what was seen in 2008.
Trading – PR: Long position in gold, silver and mining stocks
Trading – SP Indicators: Long position in gold, silver and mining stocks
Long-term investments: Remain in the market with your precious metals holdings
| Portfolio's Part | Position | Stop-loss / Expiry Date |
|---|---|---|
| Trading: Mining stocks | Long (full) | 352 / Mar 14, 2013 (half) |
| Trading: Gold | Long (full) | $1,544 / Mar 14, 2013 (half) |
| Trading: Silver | Long (full) | $28.20 / Mar 14, 2013 (half) |
| Long-term investments | Long | - |
This completes this week’s Premium Update. Our next Premium Update is scheduled for March 8, 2013.
As always, we'll keep you updated should our views on the market change. We will continue to send out Market Alerts as the market situations dictate, and we will send additional Market Alerts whenever appropriate.
Thank you for using the Premium Service. Have a profitable week, a great weekend!
Sincerely,
Przemyslaw Radomski, CFA

