
- Euro & USD Indices
- General Stock Market
- Correlation Matrix
- Gold
- Silver
- Platinum
- Mining Stocks
- Sunshine Profits Indicators
- Letters from Subscribers
- Hidden pivot method, gold down to $1,580, GDX to $36.42
- Chile delays copper and gold projects worth $38.9 billion
- Mining stocks listed in India
- Buying gold in India
- Summary
Platinum and gold have been playing a game of tag, and this week, platinum took the lead again regaining its rightful position up front, but for how long?
Looking back at history, platinum has been the front runner with an average $200 to $400 premium to gold. At times the difference was much greater. Before the 2008 Lehman Brothers crash, platinum was trading at more than $2,270 per ounce while gold was trading under $990 an ounce. The prices as of close of this week’s issue were $1,686.50 for gold and $1,694.30 for platinum.
The yellow metal’s spectacular bull market marathon over the past few years began posing a challenge to platinum. On September 2, 2011 gold took the lead pumped up on a runner’s high. This past year (2012) it looked like gold had hit the wall of fatigue and needed to catch its breath. And this week, for the first time since March, platinum captured its rightful place as leader of the pack.
Platinum rallied strongly in the first two weeks of 2013 on bullish fundamental reasons, but the true catalyst for this week’s move up came on news of supply disruptions from Anglo American Platinum Ltd. (AMS.JO), the world's largest platinum producer which announced that it will suspend production at several mines in South Africa. Closing the mines will cut platinum production by 400,000 ounces annually, according to some news reports. The company produces about 40% of the world's mined platinum. The troubles for platinum don’t stop there. The cutbacks will result in 14,000 job losses, or 3% of the country’s mineworkers, and a 20% drop in annual production. Union leaders are already threatening new strikes, which brings to mind the violent strikes of last summer which resulted in about 50 deaths. On Thursday miners returned to work after an illegal walkout, but it’s difficult to predict how this will play out.
There are several fundamental factors influencing the platinum market. Analysts say that global platinum production as a whole is in a deficit; with some citing a supply deficit of 400,000 ounces in 2012, versus a 430,000 ounce surplus in 2011. This news comes in tandem with a forecast of a rebound in automotive sales. Platinum’s greatest industrial use is in auto catalysts, so the simple equation of tight supplies and higher demand underpins a strong fundamental outlook.
Platinum prices began to fall around a year ago in when demand dropped due to the poor economy. Then in August prices picked up again due to the labor strikes in South Africa, which produces 75% of world platinum supply. As the labor disputes were resolved, prices drifted lower once more, until recently.
Platinum is much more rare in nature than gold. Approximately 10 tons of ore must be mined - sometimes almost a mile underground at high temperatures- to produce one pure ounce of platinum. More than ten times more gold is mined each year than platinum. In fact, all the platinum ever mined throughout history would fill a room of less than 25 cubic feet. Unlike gold, which is either held in bank vaults or used in jewelry, more than 50% of the yearly production of platinum is consumed (used up) by industrial uses, mostly in the automobile industry so that are no large inventories of above-ground platinum.
In other important news this week, the Bundesbank, Germany’s central bank, has decided to repatriate part of its gold holdingsfrom the Federal Reserve Bank in New York and the central bank in France. Nearly half ofGermany’s gold reserves are held in a vault at the Federal Reserve Bank of New York. Germany’s goal is to house more than 50 percent of its gold in Frankfurt by 2020, up from a little less than a third today. More than two-thirds of Germany’s gold reserves, valued at $183 billion, is abroad, in New York, Paris and London. The Bundesbank did not announce any plans to move any gold out of the Bank of England, which will continue to store 13 percent of the total. Officials at the Bundesbank indicated they have no intention of selling the gold. Remember that governments were selling gold when its price was low? Traditionally, governments and monetary authorities are not good investors – keep this in mind the next time someone tells you that you shouldn’t buy gold because the official sales can push the price much lower.
Germany has some strange bedfellows such as Iran, Libya and Venezuela in making such a move. In 2011, Venezuela’s Hugo Chavez brought 160 tons of gold from New York to Caracas at an estimated cost of $9 million. This could possibly trigger other countries to do the same and bring their gold home. In fact, we expect this trend to continue. Who knows how much gold is there in the Fort Knox – maybe very little, so why take risks, better get your gold somewhere where you can see and audit it.
In the past few months, Germans have debated the safety of the country’s gold held in other countries. German officials continued to assure that the move does not reflect any distrust of the Fed or the French central bank. (Maybe they are worried about a 'Die Hard with a Vengeance' type scenario, the one where Bruce Willis and Samuel Jackson fought to stop criminals who steal some of Germany’s gold from the NY Fed :) ) The truth is that we don’t believe that it doesn't. It does, but it doesn't sound nice not to trust other central banks. It might make people hesitate to trust them – and that’s all that is backing up the fiat money – trust.
According to the Financial Times, this will be the biggest planned gold transport on record. It will probably be the most heavily armed and secured gold shipment in history, just in case the criminals have any ideas.
Why did the Germans stash their gold in the U.S. and France in the first place? During the cold war West Germany worried about a Soviet invasion from the east and stored its gold as far west as possible.
While worry that Putin will invade is not on the table, there are some good reasons for keeping some gold in financial centers like New York and London. Gold is the one currency that is accepted everywhere and in the case of a crisis gold could be used to help restore confidence.
After World War II Germany had no gold reserves, despite the plunder undertaken by the Nazis in occupied countries. The Nazis had used most of it to finance the war, and most of the rest vanished mysteriously. But Germany’s economy recovered in the post war years, the country accepted gold as well as dollars for its goods.
Germany hasn't bought or sold gold since 1973 and is second only to the U.S. in the amount of its gold reserves. Germany’s gold repatriation raises some questions. What are their belief in both the strength of the global economy and the European Monetary Union? How much do they really trust their fellow central banks?Are they expecting a currency war? All in all, this emphasizes the value of gold and its importance in the world of fiat currencies. The long-term bull market remains in place.
To look at what is in store for precious metals in the near future, we will begin this week's technical part with the analysis of the Euro Index. We will start with the long-term chart (charts courtesy by http://stockcharts.com.)
Euro & USD Indices
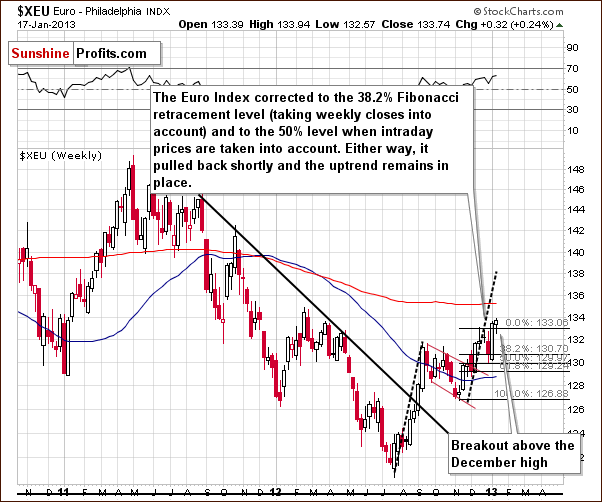
We begin this week with a look at the long-term Euro Index chart. We see that the breakout above the December 2012 high has been verified and the situation looks bullish today. The next stop for the index appears to be at the February 2012 high which is approximately 2 index points above Thursday’s closing level. The recent ABC trading pattern and last week’s strong pullback, however, point to a continuation of the rally even if a consolidation is seen a week or so. This provides us with a bearish picture for the USD Index.
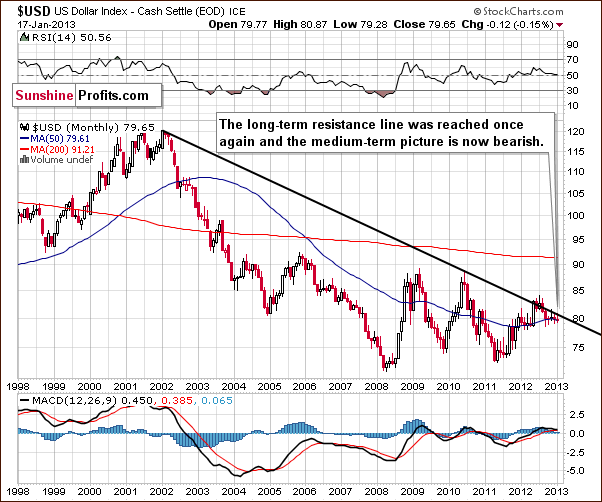
Once again we begin the USD section with the long-term USD Index chart since it gives us a bigger perspective. We continue to see bearish implications this week, and the long-term trend remains down. The medium- and short-term perspectives are more interesting this week.
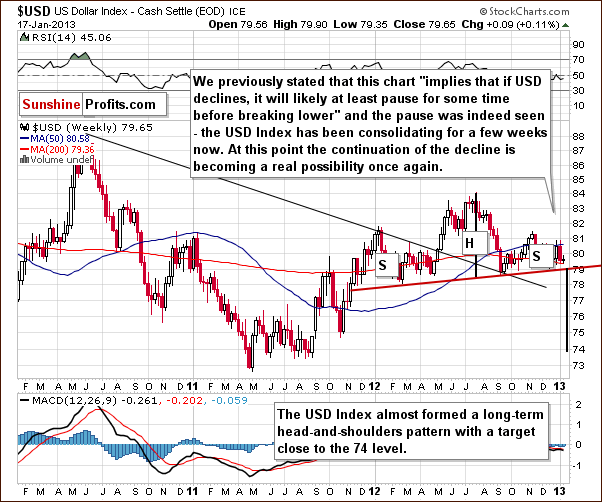
In this week’s medium-term USD Index chart, we see that a head-and-shoulders pattern has developed and since it’s based on a trading period of greater than one year, it has powerful implications. If the index breaks down below the 79 level, it’s likely that we’ll then see a move towards 74 (not necessarily immediately, though) and this would likely ignite a big rally in the precious metals. This possibility is somewhat speculative since the formation is not yet complete. It is likely however that the head-and-shoulders pattern will complete based on current short-term trends.
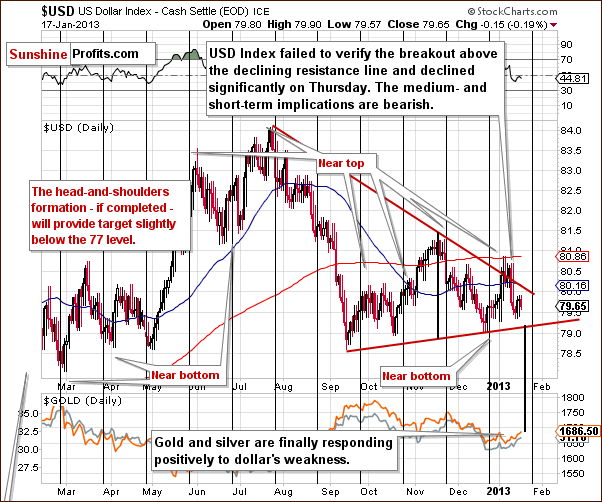
In this week’s short-term USD Index chart, we also see a head-and-shoulders pattern in progress. Actually, it is the right shoulder of the medium-term head-and-shoulders pattern, that is a short-term head-and-shoulders pattern by itself. That’s another example of the fractal structure of the market. A move below 79.1 will mean a breakdown below the neck level and probably a more significant decline. The USD Index invalidated a breakout at the beginning of this month, which still has bearish repercussions on the currency.
This time we expect the index to break down below the neck level, consolidate, and move lower to the 77 or 77.5 level. This is more or less in tune with target levels based on the formation and would also be a move to the declining medium-term support line (visible on the previous chart).
At this time, the dollar could consolidate or pull back and then continue to move lower based on the medium term head-and-shoulders formation. It seems that the index will decline in the coming days and possibly pull back a bit before the end of January. Such action would be in tune with the cyclical turning points present on the USD Index market, so it’s quick likely. This would verify the breakdown, and more declines appear likely follow. This is bullish news for gold investors.
Summing up, the short and medium term outlooks are bearish for the USD Index. The implications are bullish for the precious metals sector and we’ll discuss this further in the correlation section.
General Stock Market
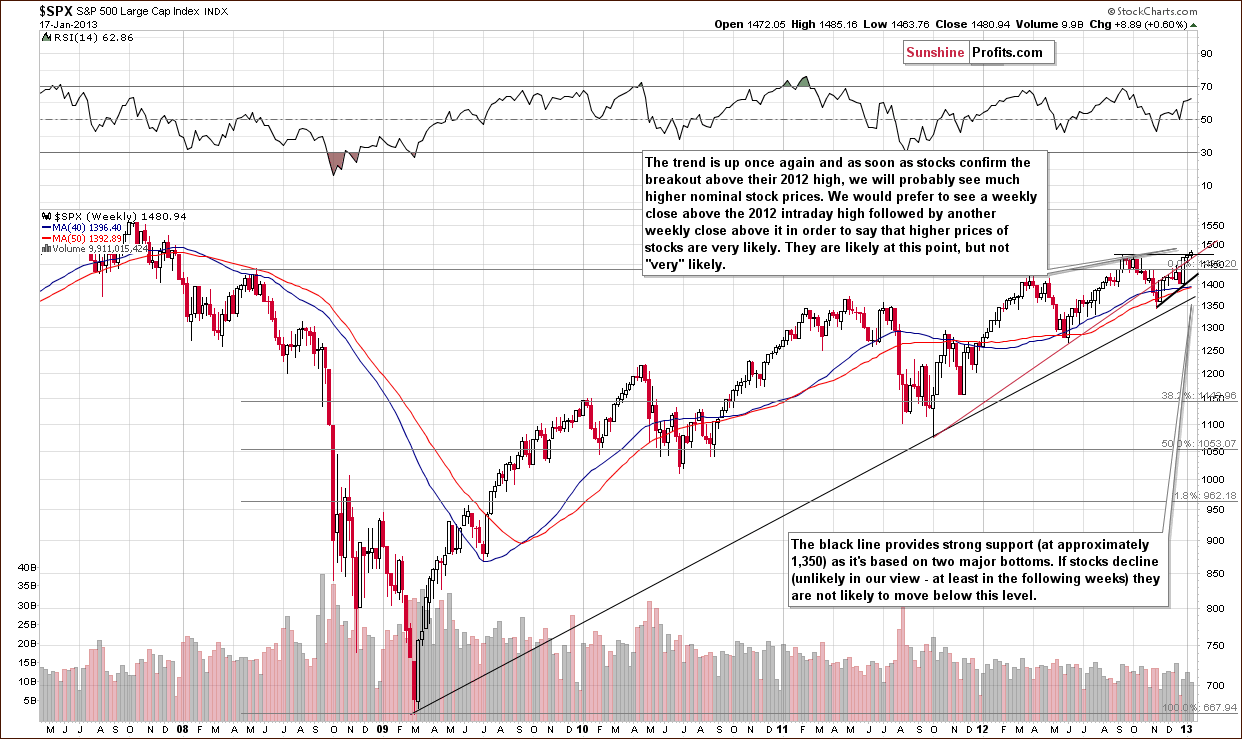
In the long-term S&P 500 Index chart this week, stocks closed above their 2012 high (on Thursday) even when considering intra-day price levels. This is a bullish phenomenon which is not yet confirmed. We prefer to wait and see that stocks close above this level next week as well before saying that the breakout is completed, but the situation is clearly more bullish than not at this time.
It’s also more bullish than it was last week because back then we only had an unconfirmed breakout above the highest closing price of 2012. This week we have it confirmed and an additional, unconfirmed breakout.
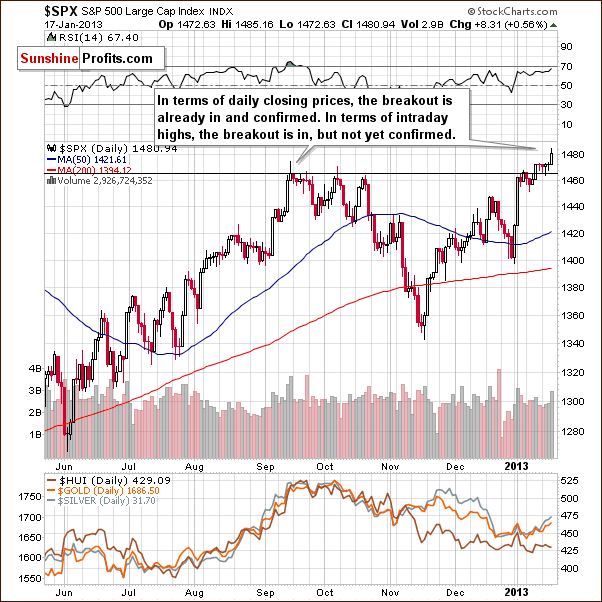
We zoom in with the aim of emphasizing that the breakout has indeed taken place. There were several daily closes above the highest closing price of 2012 and one close above the highest price of the previous year.
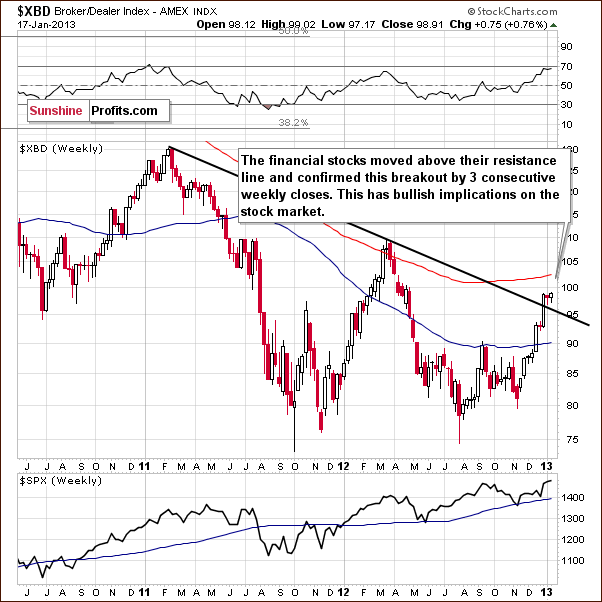
In the financial sector (Broker/Dealer Index serves as a proxy here) chart, a sector which often leads stocks higher or lower, recent moves have been strong to the upside. The financials have broken out above the declining resistance line and verified it. Weekly closing prices have been there for three weeks. With RSI levels now above 70, some consolidation is possible but will not necessarily be seen immediately.
Summing up, all-in-all the situation for stocks in general is bullish at this time.
Correlation Matrix
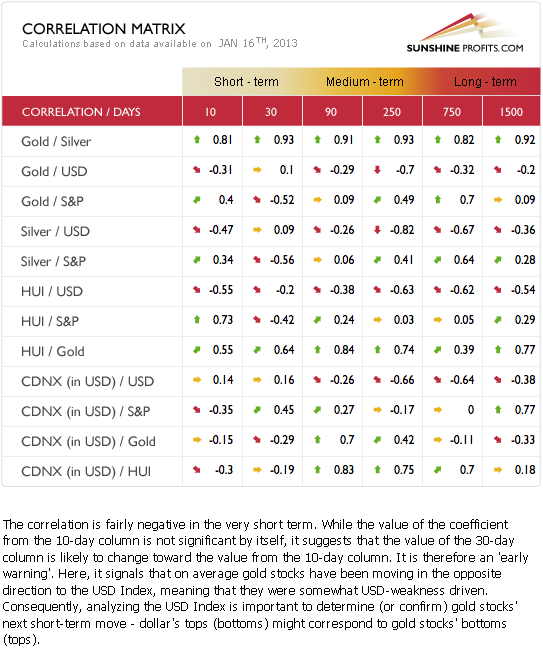
The Correlation Matrix is a tool which we have developed to analyze the impact of the currency markets and the general stock market upon the precious metals sector (namely: gold & silver correlations). This week we see a return to normal values in the very short-term 10-day column and this suggests that a return to regular medium and long term correlations is underway.
Please note that the 10-day column is not significant by itself, but it provides an indication regarding the way in which the important numbers might change.
The precious metals sector is likely leaning towards negative correlations between precious metals and the USD Index and positive correlations with the general stock market. The bearish outlook for the dollar and the bullish outlook for stocks provide us with a bullish picture for the precious metals sector.
Gold
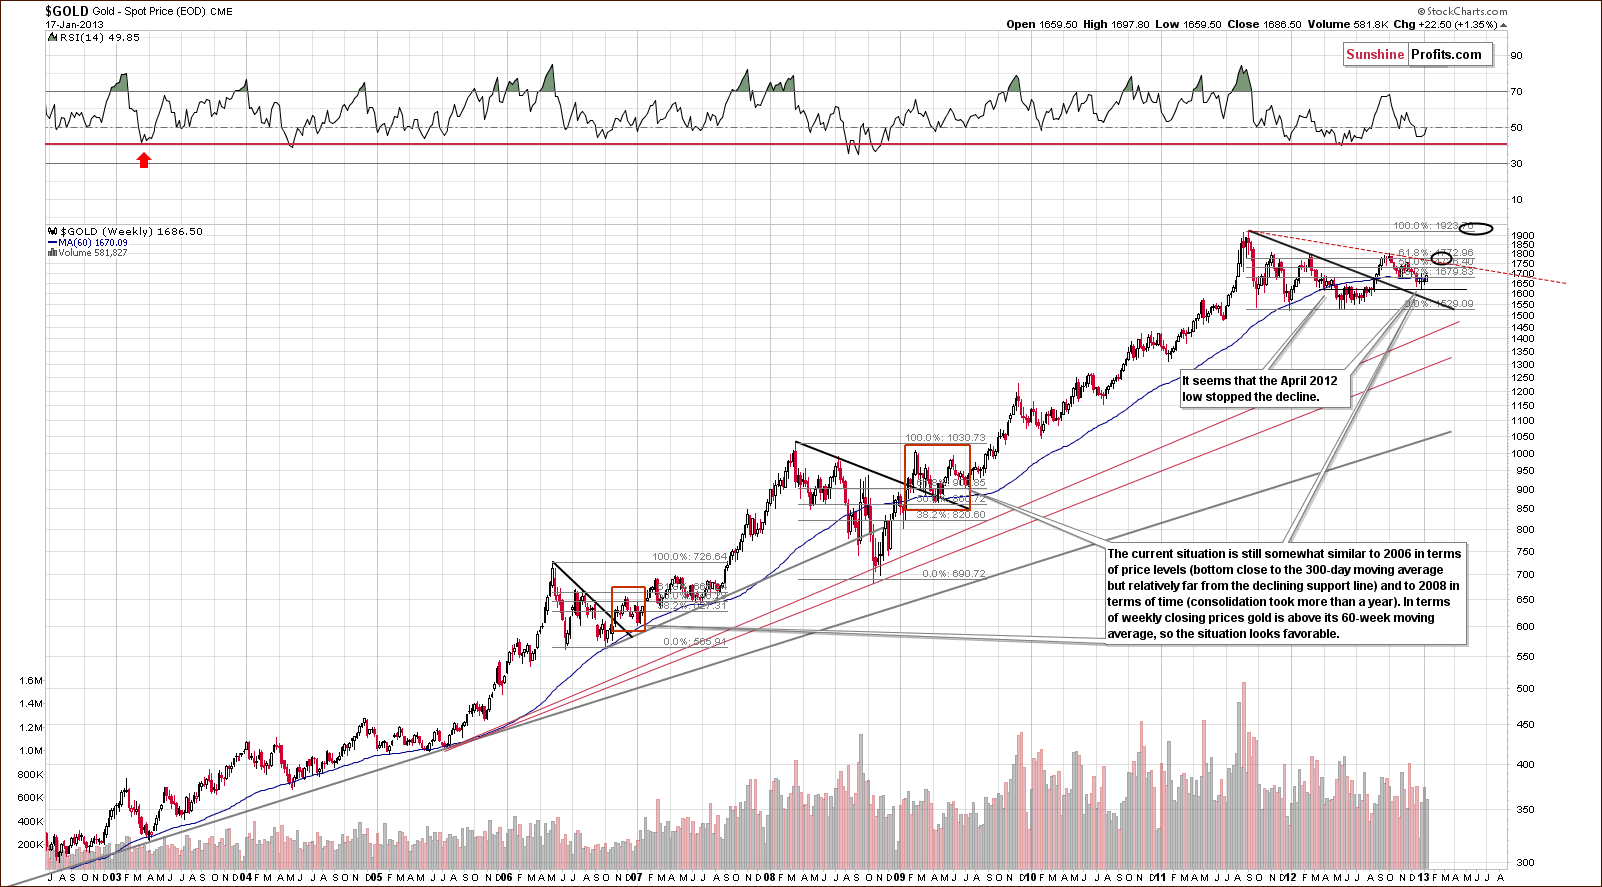
In gold’s very long-term chart, where the daily noise is nicely filtered out, we see that gold formed a bottom slightly below the 300-day moving average. This is similar to what was seen in 2009 and also 2007, when gold bottomed close to this support line. It seems that another powerful rally for gold prices could be in the cards. All-in-all this chart and the long-term trends are clearly bullish for the yellow metal for the coming month.
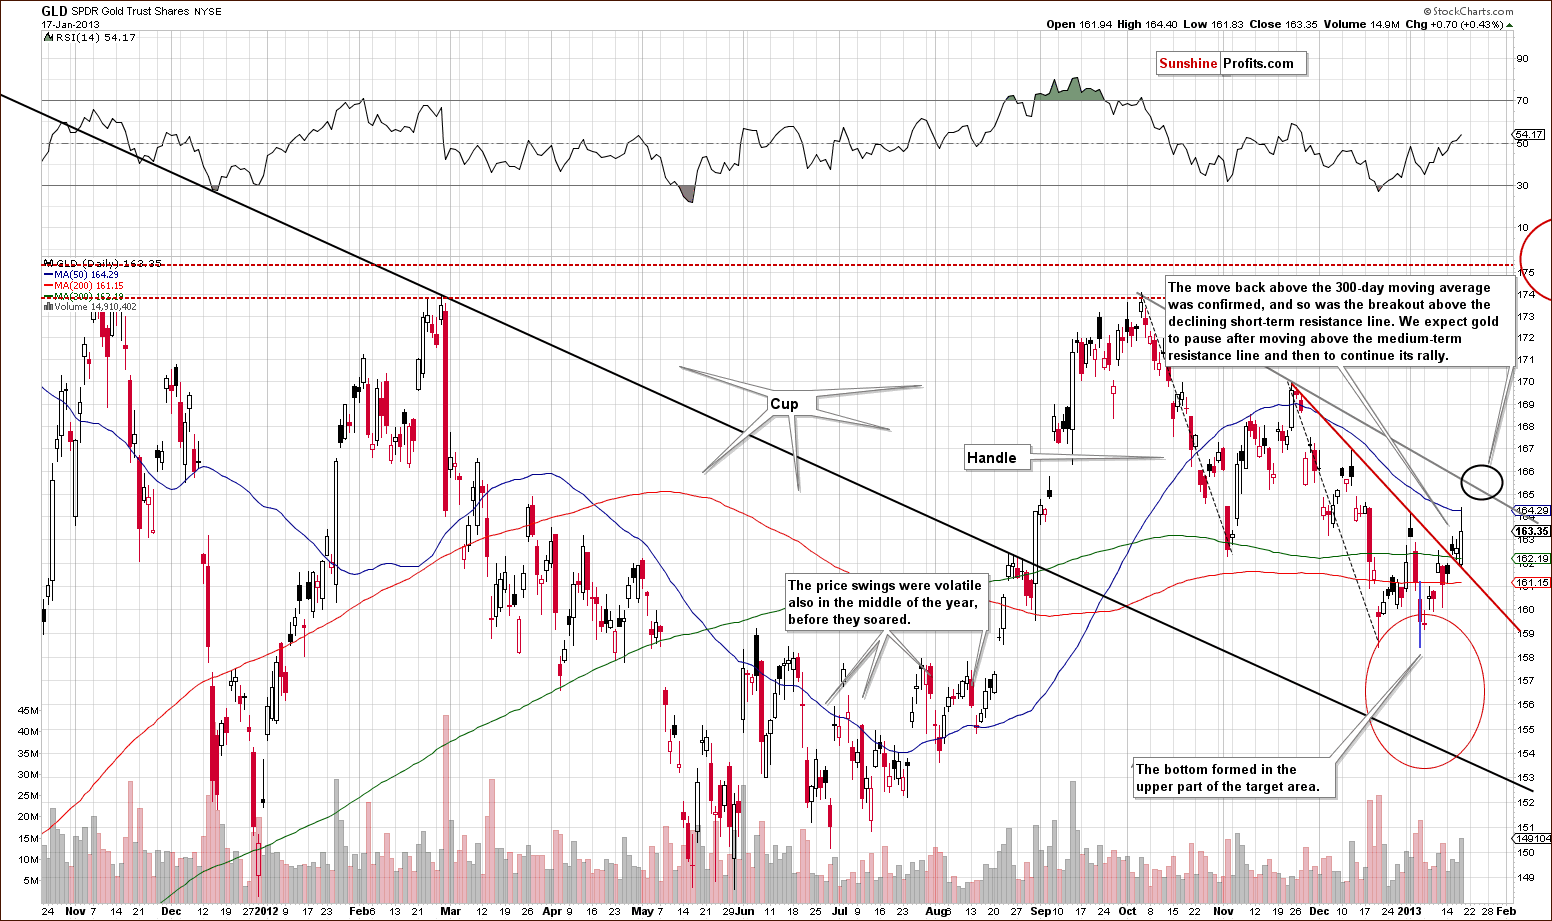
A look at this week’s medium-term GLD ETF chart gives us a better perspective for the coming days and weeks. Here we are likely to see higher prices since gold moved strongly above its 300-day moving average on Thursday. Volume levels were relatively high as well, in fact the highest in an upswing since the early November rally. Back then, higher prices followed but declines were seen soon thereafter. It seems that this time, the rally will follow but we do not expect to see subsequent declines.
The short-term resistance line has been broken and prices have closed above this line for three consecutive days, so the breakout is in. Higher prices are likely, but some consolidation may be seen after this breakout above the medium-term resistance line. The rally would be in the $20 to $25 for spot gold and about $2.50 in GLD. A period of consolidation for a week or so is then probable.
All of this would fit nicely with the picture of the USD Index. The move higher for gold would be triggered by a breakdown below the neck level of the head-and-shoulders pattern in the USD Index. The consolidation here would correspond to the verification of the breakdown in the USD Index. All-in-all, this chart is bullish.
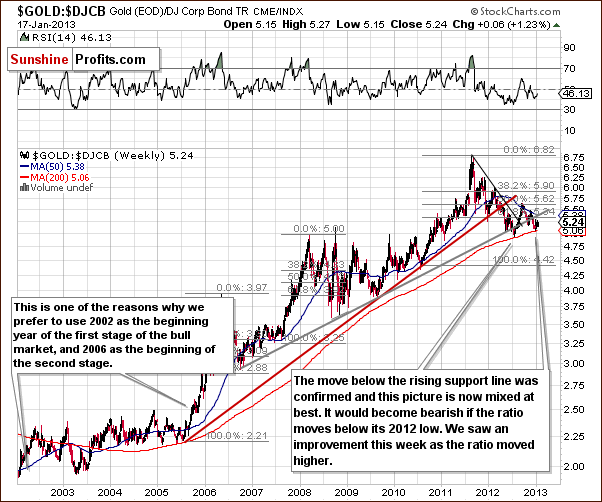
In this week’s gold to bonds ratio chart, nothing has changed this week. The picture remains mixed although the ratio did move a bit higher this week after being quite close to the level of the 2012 low a week ago.
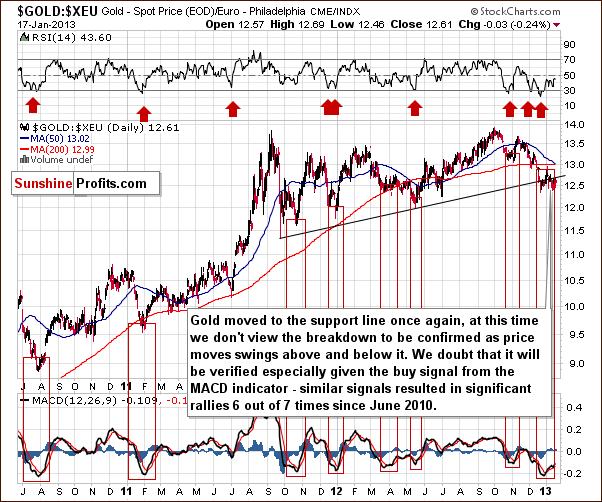
In the chart of gold from the perspective of the euro, we see a move to the support line and prices have moved back and forth around it. We recently had a long-term buy signal from the MACD, meaning that higher gold prices from the euro and USD perspective as well as others.
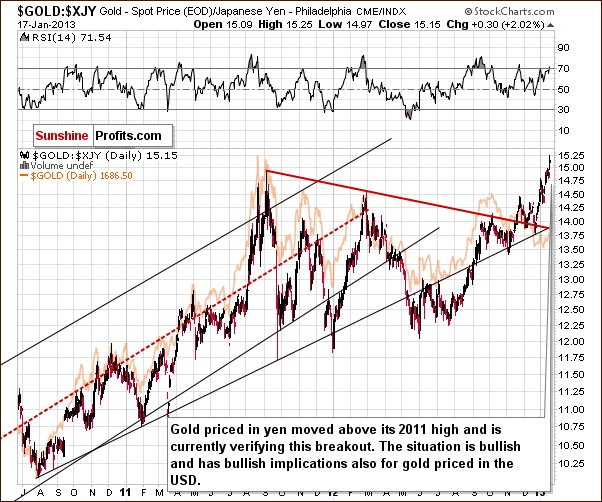
In this week’s chart of gold from the Japanese yen perspective, we see that prices have already broken above the 2011 high. This is a very bullish indication here and for other currencies as well. It actually seems that gold priced in yen leads the way, and more strength could be seen in the days ahead. Some consolidation is possible before the rally continues, however, with RSI levels currently above 70.
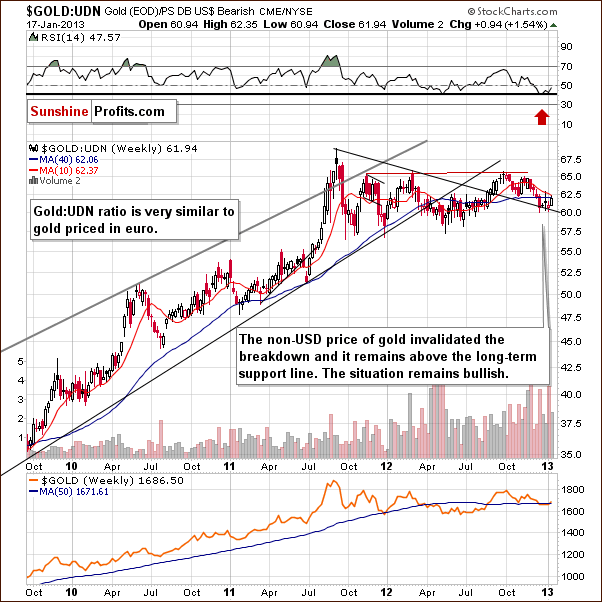
In this week’s chart of gold from the non-USD perspective, we see that prices overall moved higher this week. There has been no confirmation of a breakdown and the situation remains bullish.
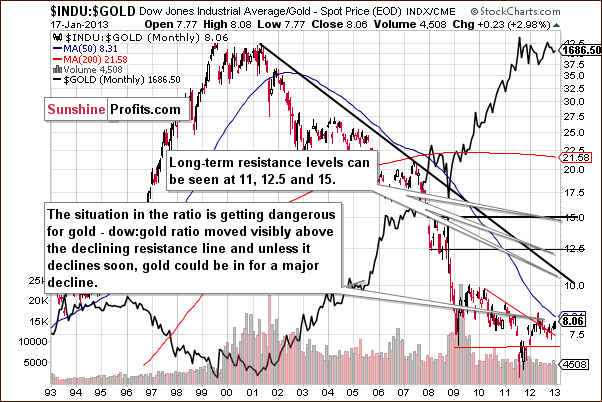
In this week’s Dow to gold ratio chart, the one which concerns us the most this week, we don’t view the bearish breakout here to be really in yet and we continue to monitor this ratio closely.
Summing up, the long-term outlook for gold remains positive. The medium and short term remain bullish though a few more days of rally could be followed by a quick consolidation (once it moves above $165 in GLD and $1,705 in spot gold) and then additional rally.
Silver
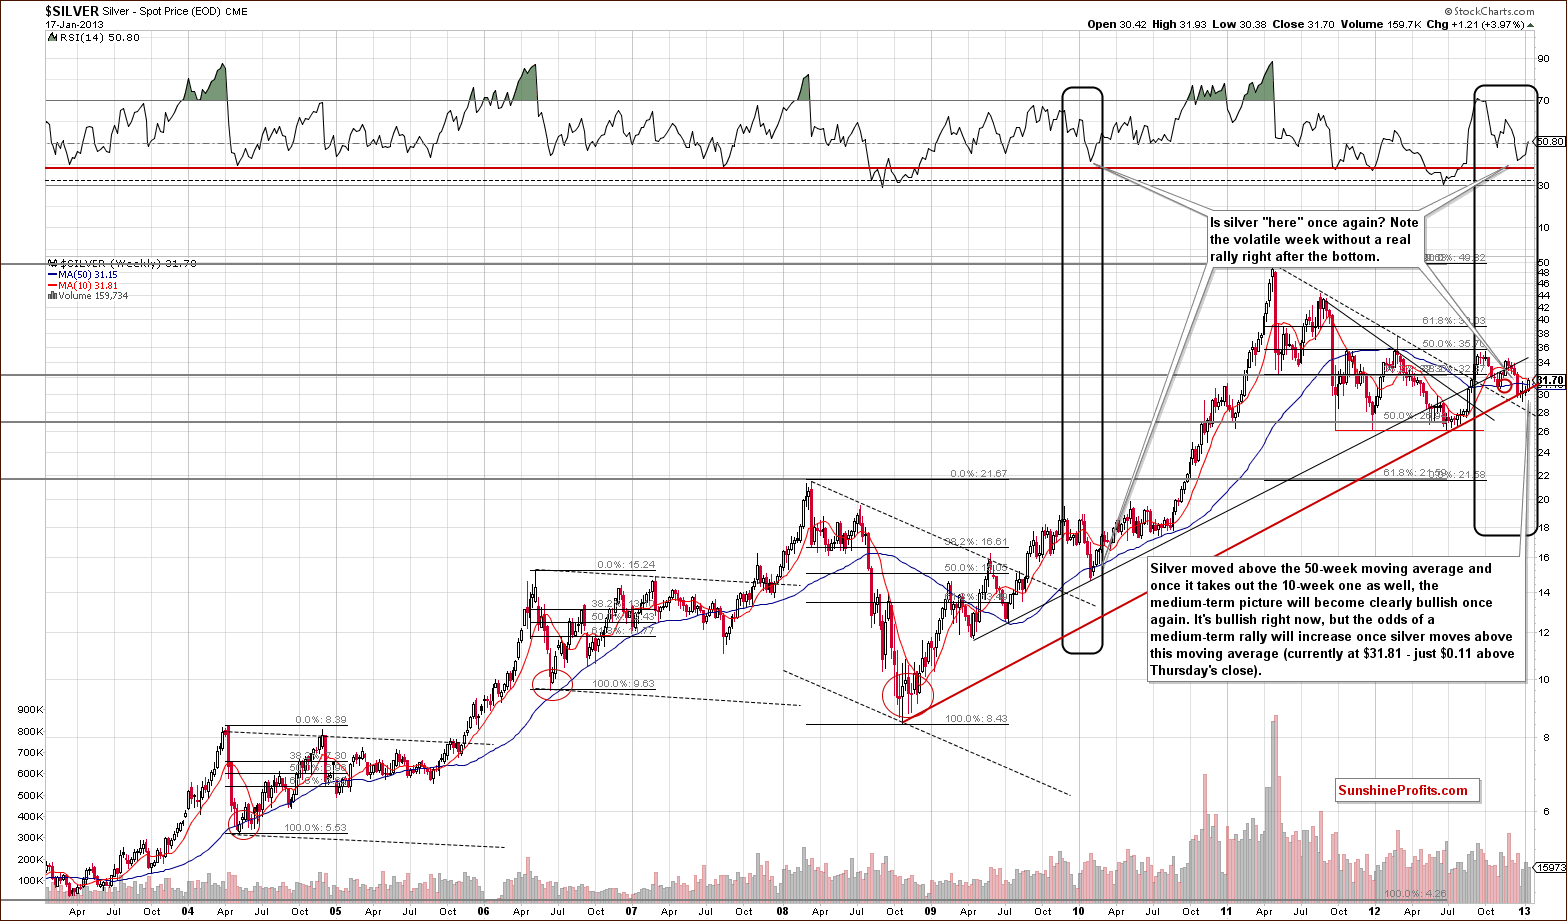
We begin our silver section with a look at the white metal’s very long-term chart. As we have previously mentioned, recent trading patterns here have been similar to early 2010 and this continues to be the case. Back then, lower prices were not seen again once the bottom was reached and the rally began. This could very well be the case once again.
The correction was very significant from the very long-term perspective. Silver appears ready to rally once again but prices have not yet broken out above the 10-week, 50-day moving average. Only a small rally is needed to accomplish this, and the picture will then be further approved.
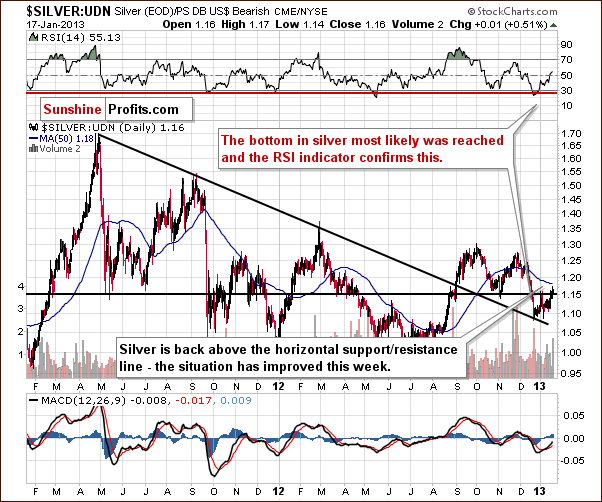
In this week’s chart of silver from the non-USD perspective, we also see a move above the horizontal support line after a verification of the breakout above the declining resistance line. All-in-all, the picture remains bullish.
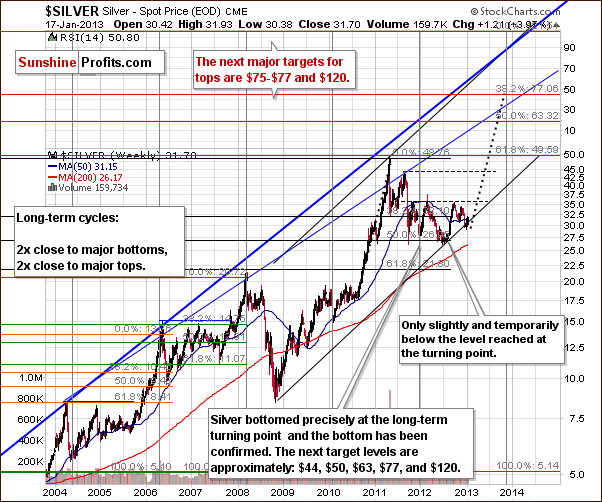
We include a second very long-term silver chart this week because if this is the final bottom (the long-term support line suggests so) and if after a prolonged consolidation, we get a rally similar to 2010-2011, we could be looking at a rally to the $77 level. This may not happen, but several technical tools align and such a move is not out of the question. Now, there could be a breakdown, weakness or consolidation and the indications do not say the rally is very likely to happen, but such a rally would not be out of tune with historical patterns. In other words, it would appear quite normal. This is a very early heads-up and something to keep in mind, the next time you hear that silver can’t move so high – it can and it can do it quickly.
Those new to the market may think this is impossible, but $10 silver was impossible when its price was less than $5 for many years. Now, $10 seems impossible because it’s too low a price. If you are long silver for the long run as we are, this picture should make holding silver easier.
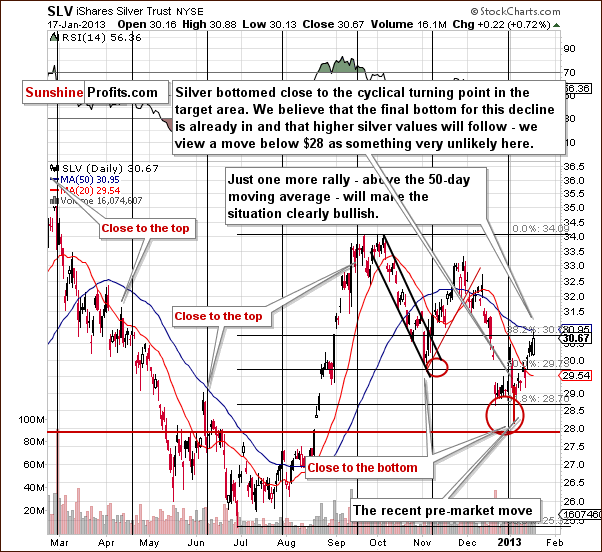
In the short-term SLV ETF chart, we see a confirmation of what we described when analyzing the long-term chart. Silver’s price moved higher recently, but we would like to see it move above its 50-day moving average before saying that another powerful rally is likely to emerge. It is probable anyway, but once the breakout is seen, the bullish picture will be even more bullish.
Summing up, the long, medium and short-term outlooks are bullish for the white metal. The short term is a bit unclear; however, due to uncertainty as to the consolidation taking place before or after the 50-day moving average is surpassed.
Platinum
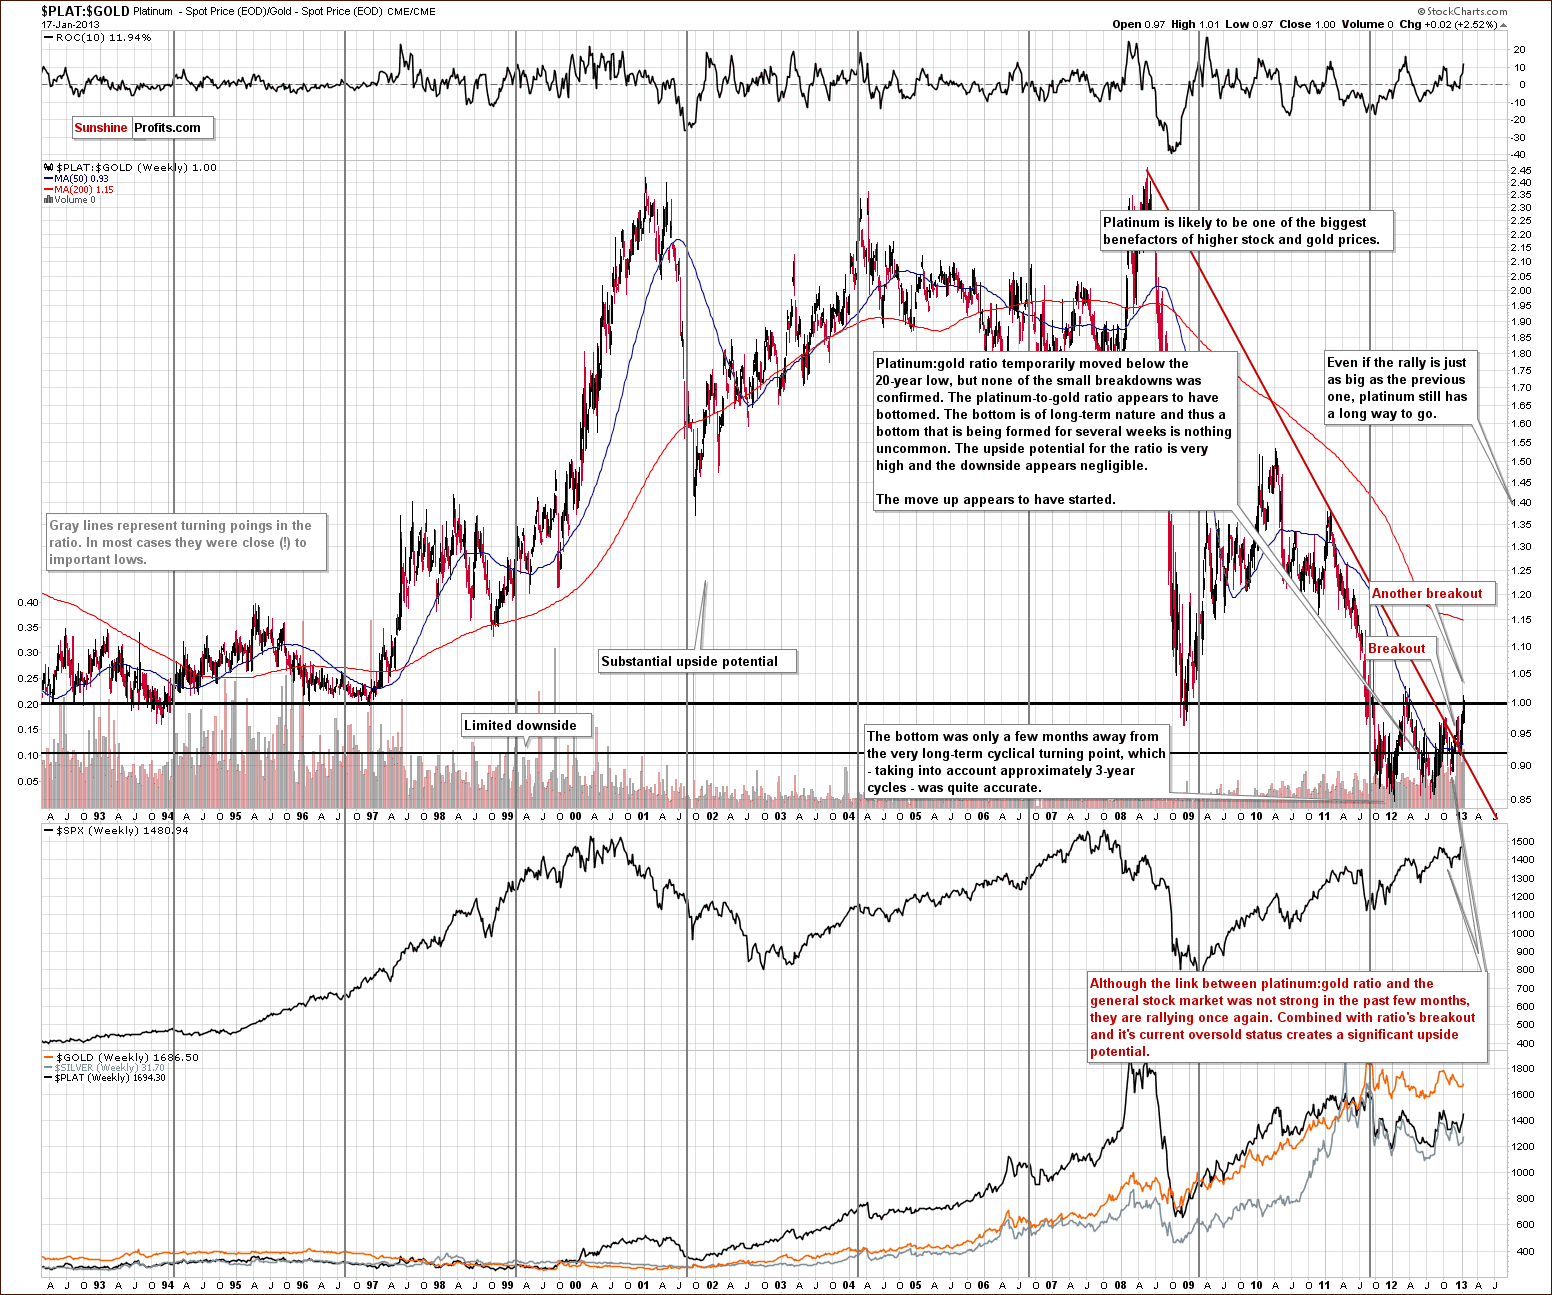
In this week’s platinum to gold ratio chart, recent trading days have seen a post breakout rally triggered by supply issues in South Africa. Fundamental factors and news, however, don’t determine how much prices will rally or if the rally should be followed by a correction or a big move to the upside, which seems to be the case today – technicals do.
An important technical development is the breakout above the declining long-term resistance line. This is something we have emphasized previously and will still have bullish implications next month since the price of platinum is still well below the long-term average relative to gold. It seems that platinum is undervalued and we feel it will outperform gold in the months ahead.
Gold & Silver Mining Stocks
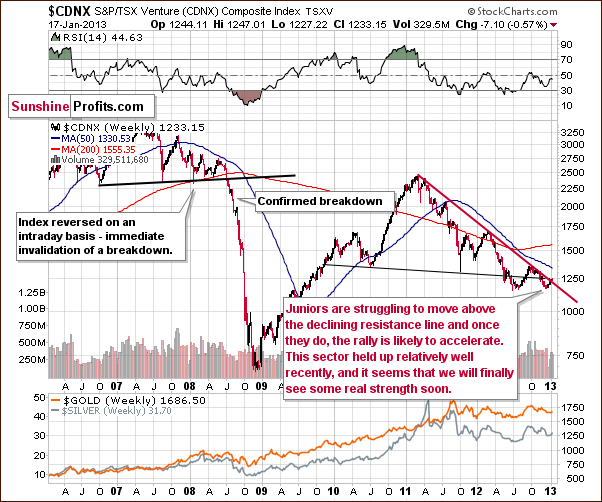
In the Toronto Stock Exchange Venture Index (which is a proxy for the junior miners as so many of them are included in it), there was no change this week. Comments made in last week’s Premium Update remain up-to-date:
We still see no breakout in this long-term perspective. With the bullish picture in place for stocks and gold, it is likely that a breakout will be seen soon, however. Once seen and confirmed, a real rally could begin for the juniors. They have been consolidating for many months, two years in fact, or even five years when considering the 2007 top. Once the breakout is seen, a significant rally is quite possible here.
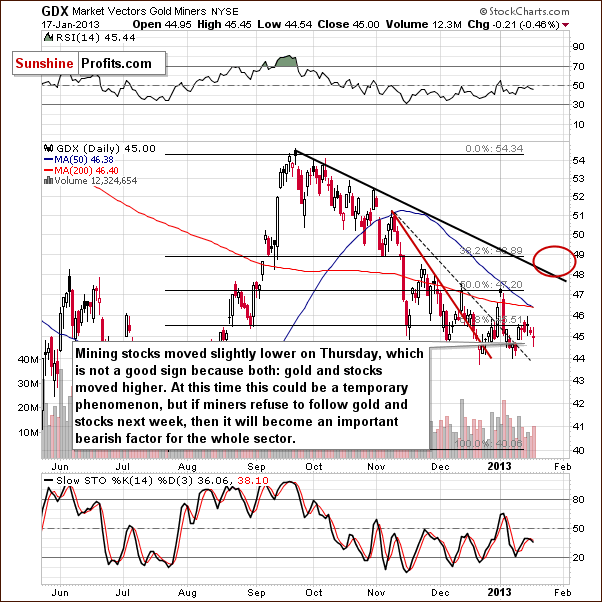
In the GDX ETF (the senior miners) short-term chart, Thursday’s price action is a concern. The miners did not rally when gold and stocks did. This is unusual and normally a sign of weakness in the mining stocks. It seems to us, however, to be a temporary phenomenon. If it persists, we will have to reconsider long positions in the mining stock sector, but we still see the miners as bullish at this time – in large part due to the situation in gold and stocks.
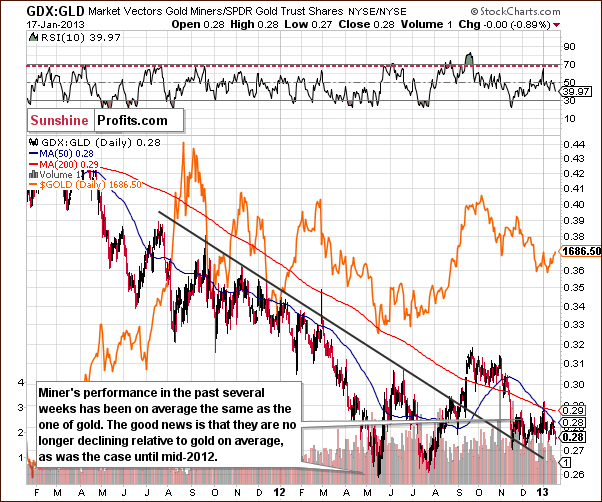
In this week’s miners to gold ratio chart, we have a bigger perspective. In the past few months, mining stocks moved higher relative to gold but overall really not that much happened. Since mid-2012, the miners no longer underperformed gold strongly. While the ratio has moved back and forth, it is no longer declining, so if the short-term noise is excluded, the picture is at least slightly encouraging here.
Summing up, while Thursday’s price action is a concern, we still feel the outlook is bullish when taking into account the bullish picture of gold, silver and the general stock market and the bearish outlook for the USD Index.
Sunshine Profits Indicators
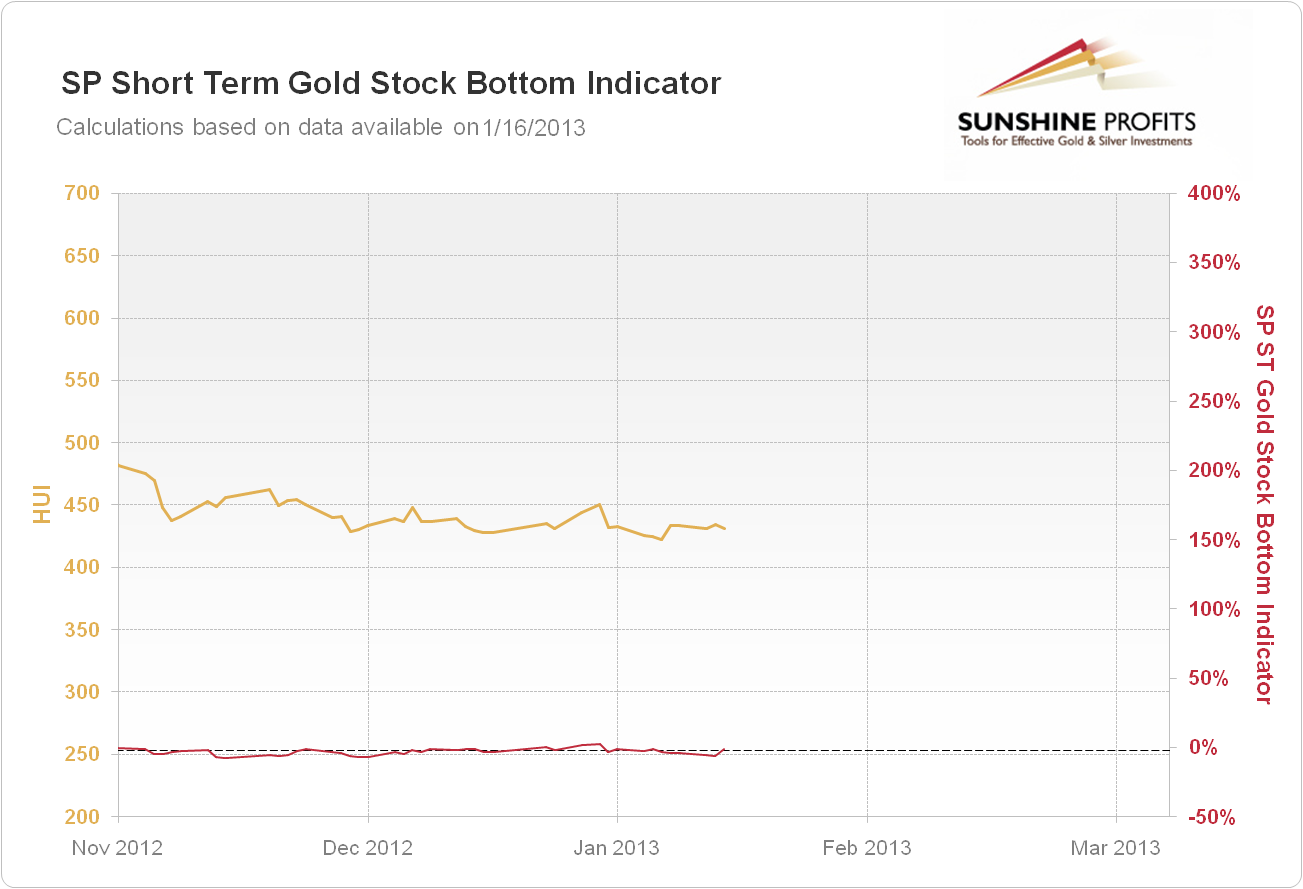
We just saw a buy signal from the SP Short Term Gold Stock Bottom Indicator, which is a buy signal for gold mining stocks and silver mining stocks. Consequently, we suggest opening small (half of the regular size of the position) speculative long position in the mining stocks. You can see more details regarding this signal on the Indicators’ Details and Performance page.
Interestingly, the previous buy signal from this indicator expired just a few days ago, when miners were a bit higher than they are right now, so while the position is now just as it was a week ago, you saved a few pennies thanks to re-entering the position as slightly lower price.
Letters from Subscribers
Q: (…) hidden pivot method. Do you know anything about this method for analyzing stocks? He sees GDX going down to 36.42 and gold to 1580. Do you agree or disagree with this method? GDXJ down 36% from here.
A: The pivot method is simply another way of looking at the similarities in patterns, like the Elliott Wave Theory, for instance. The most interesting part of these types of analyses is, in our view, the fractal structure of the market - how trends repeat themselves in different scales. The zigzag patterns that are emphasized in this method are useful on their own, and this is actually something that we look for and report to you. The last time such a pattern was seen in gold was Oct 2012 - Dec 2012, as we indicated on the medium-term GLD chart earlier today.
At this time we don't think that gold/ GDX will move that low. We remain bullish.
Q: Chile delays copper and gold projects worth $38.9 billion:
http://www.mining.com/chile-delays-copper-and-gold-projects-worth-38-9-billion-30041/
Sounds like a bearish factor for gold.
A: The current sentiment toward gold and silver investments among decision makers in mining projects is not much different from other people in this area, including investors. The factors listed in the article are rather unclear, but it's obvious that precious metals prices are one of the most important factors to consider. When making decisions for a company, people need to be conservative in their predictions. While two years ago, management might have been expecting to see higher prices now, they have to make decisions based on current prices, not where they think the price will go.
Sure, that is an important factor, but after seeing prices stabilizing for more than a year, the conservative decision (and the one that management can defend later in front of the board if prices go lower) is to assume that they will not rise, but perhaps stay where they are. If previous expectations and plans were based on higher prices, they will need to be canceled. This is generally how business cycles work. The consequence of such cuts in production will lower supply which, given constant or rising demand, will make prices move higher. Then the supply will follow and at some point it might exceed demand and the price will move lower or consolidate once again.
All in all, we don't see a threat to the bull market in the precious metals or commodities sector based on the production cuts in Chile. Actually, lower supply could have a positive impact.
Q: Thanks for answering my question on India. Can you answer the following:
1. What mining stock companies are listed in India and available for purchase (since mining stocks are being recommended)?
2. Approximately when do you think the Dow and currency will collapse? Will the collapse cause contagion and bring down the Indian Sensex?
3. What about commodity stocks, will they rally this year?
4. How can I buy gold in India?
Thanks and regards.
A: This week we follow up on our promise to answer two additional questions about the Indian precious metals market (we have already answered to questions 2 and 3 in last week’s Premium Update)
In comparison to the internal demand, the mining stock market in India is relatively small – as of 2011 there were only 3 active gold mines in the country. We have been able to identify 2 mining companies producing gold and listed on the Bombay Stock Exchange (BSE):
- Deccan Gold Mines Ltd (DGM)
- Midwest Gold Ltd (MGL)
However, only DGM is focused primarily on gold. MGL pursues a number of projects including the exploration of gold and granite. Because of that, the price of MGL shares may be influenced by factors from outside the precious metals market more often than for DGM.
As far as silver production is concerned, it is almost nonexistent. The largest silver producer (as of 2010), Hindustan Zinc Ltd (HZL, listed on the BSE), is mostly focused on zinc (as the name of the company itself suggests). The same caveats as with MGL apply.
So, limiting our choice to companies listed on the stock exchange, DGM seems to be the only choice if you’re inclined to buy mining stocks via BSE.
On the other hand, if your brokerage account supports purchases of stocks listed in the U.S., it might be reasonable to diversify your gold and silver portfolio. In that case, you could also make use of our Gold Stocks Ranking and Silver Stocks Ranking to identify the stocks which have recently offered the most leverage compared to gold.
As to the “How to buy gold in India?” question – we recommend you familiarize yourself with our “” guide – it shows you various methods of gaining exposure to gold and assesses their usefulness for short-term trades and long-term investment.
Assuming that you’re an individual investor, and you’re beginning to accumulate gold and mainly interested in physical gold, it seems that bullion coins might be the best option for you as far as long-term investments are concerned. Looking at our guide from the Indian perspective, you can use several channels to obtain such coins. The safest way in terms of the authenticity of the coins is to get them either from a large financial institution (e.g. the State Bank of India) or from a well-known jewelry retailer (e.g. GRT). There is also the possibility to buy gold coins from the India Post. All of these channels, however, entail a relatively high commission. In order to avoid paying the mark-up, you might want to search for a reliable local gold/silver retailer near where you live in. In our opinion, finding a reliable local retailer is probably the way to go as far as physical gold is concerned. Take your time to get to know the local market and identify retailers who are well-reputed.
We would suggest that you get a brokerage account with access to ETFs and mining stocks listed on highly liquid markets (e.g. in the U.S.). You could use ETFs for short-term trades, while mining stocks could offer you diversification.
Once again, we suggest reading our essay on gold and silver portfolio, so that you get an idea of what the difference between long-term investments and short-term trades is and why it is a bad idea to use ETFs for anything other than short-term trading.
Summary
In the currency markets, the situation is bullish for the euro and bearish for the US dollar. In the USD Index, if the breakdowns below two head-and-shoulders patterns are confirmed, the situation will become much worse. The outlook is bullish for the general stock market, and this is supported by the financial sector as well. With correlations moving back to normal state, the implications are bullish for the precious metals sector.
Gold prices broke out above the short-term resistance line and are back above the 300-day moving average. Thursday’s price rally was significant and accompanied by high volume, and the short-term picture is bullish. Long-term analysis shows patterns which are similar to those seen right after major bottoms (and one was just in). This has bullish implications. The picture for silver looks favorable as well for the long and medium term. The short term is a bit unclear due to whether some consolidation will be seen before or after prices reach the 50-day moving average.
The platinum market seems poised to outperform gold in the coming weeks and months. It still does not seem too late to take advantage of this. The mining stocks’ performance on Thursday is concerning but could simply be a short-term anomaly. We will continue to monitor this situation in mining stocks, but still feel the outlook is bullish. According to the latest signals from the SP Indicators, positions in the mining stocks should be doubled at this time.
Trading – PR: Long position in gold, silver and mining stocks
Trading – SP Indicators: Long position in mining stocks
Long-term investments: Remain in the market with your precious metals holdings
| Portfolio's Part | Position | Stop-loss / Expiry Date |
|---|---|---|
| Trading: Mining stocks | Long | $43 GDX (half) / Jan 31, 2013 (half) |
| Trading: Gold | Long (half) | $1,629 |
| Trading: Silver | Long (half) | $28.94 |
| Long-term investments | Long | - |
Thank you for using the Premium Service. Have a profitable week and a great weekend!
This completes this week’s Premium Update. Our next Premium Update is scheduled for January 25, 2013. We will continue to send out Market Alerts on a daily basis at least until the end of January, 2013 and we will send additional Market Alerts whenever appropriate.
Thank you.
Sincerely,
Przemyslaw Radomski, CFA

