- Euro & USD Indices
- General Stock Market
- Correlation Matrix
- Gold
- Silver
- Mining Stocks
- Sunshine Profits Indicators
- Letters from Subscribers
- Silver surpassing the April 2011 high
- Gold priced in Rupee when dollar collapses
- Will gold provide returns greater than inflation
- Is Indian Rupee a fiat currency
- Summary
When we talk about short term and medium term at Sunshine Profits, we usually refer to days, weeks, months and maybe a year or two out. But it’s also important as citizens of the world and as investors to be aware of very long term trends, tectonic shifts, black swans and game changers that are taking place. One such glimpse into the future is a recent report, Global Trends 2030 prepared by the US National Intelligence Council representing the 17 intelligence agencies of the US government. The study is published every four years to assist the long-term strategic planning of each new administration.
Its conclusions are that by the year 2030, for the first time in history, a majority of the world’s population will be out of poverty. Middle classes will be the most important social and economic sector. Asia will enjoy the global power status it last had in the Middle Ages, while the 350-year rise of the West will be largely reversed. Global leadership may be shared, and the world is likely to be democratizing.
But the planet may also be racked by wars over food and water. Individuals, equipped with new lethal and disruptive technologies will be capable of causing widespread harm. Global economic crises could well be recurring.
If the worlds’ governments have done such a poor job in handling the current crisis, one can only imagine how they will be able to perform given the profound changes and challenges that lie ahead. This is all the more reason to buy gold even if to leave it to the next generation.
According to the report, “Pax Americana” – the era of American dominance in international politics that began in 1945 is fast winding down. The report predicts that Europe, Japan and Russia will continue to experience relative decline, and that Asia will come to dwarf the rest of the world in terms of its economic and military power and will exceed North America and Europe combined by 2030.
Perhaps the most challenging aspect of this new global era will be that it's likely to be less organized. Global leadership will flow not to the strongest but to those who are most skilled at diplomacy and best able to mobilize international support. Under the "megatrends" category, the Global Trend authors predict that "power will shift to networks and coalitions in a multipolar world." The US will still remain “first among equals” in the international system and will remain the only country able to mobilize coalitions to address global challenges.
According to the study, one of the most important trends over the coming two decades will be the growth of the middle class.
The growth of the global middle class constitutes a tectonic shift: for the first time, a majority of the world’s population will not be impoverished, and the middle classes will be the most important social and economic sector in the vast majority of countries around the world.
This will lead to a surge in “individual empowerment”, including improved education and healthcare and widespread use of communications technologies.
Gold is a coveted commodity in Asia and is an integral part of its culture, and as populations enter the middle class it is most likely that they will begin to purchase gold, which bodes well for the long term demand for the yellow metal.
The report further states that "we are at a critical juncture in human history, which could lead to widely contrasting futures" and details the challenges facing the species in the coming decades. Among other conclusions, the current wave of terrorism is likely to have played itself out by 2030 (just like it was the case with other waves like the Anarchists in the 1880s and 90s, the postwar anti-colonial terrorist movements, and the New Left in the 1970s) and the US will be energy independent. The council says that many positive developments in health, education, and governance will propel human civilization, but the threat of conflict could emerge as supplies of food and water become scarce.
Two other megatrends will shape our world out to 2030: demographic patterns, especially rapid aging; and growing resource demands which, in the cases of food and water, might lead to scarcities. These trends, which are virtually certain, exist today, but during the next 15-20 years they will gain much greater momentum.” Demand for food, water, and energy will grow by approximately 35, 40, and 50 percent respectively owing to an increase in the global population and the consumption patterns of an expanding middle class. Climate change will worsen the outlook for the availability of these critical resources...
China alone will probably have the largest economy, surpassing that of the United States a few years before 2030. In a tectonic shift, the health of the global economy increasingly will be linked to how well the developing world does—more so than the traditional West. In addition to China, India, and Brazil, regional players such as Colombia, Indonesia, Nigeria, South Africa, and Turkey will become especially important to the global economy. Meanwhile, the economies of Europe, Japan, and Russia are likely to continue their slow relative declines.
But the new study is somewhat cautious in its assessment of the increase in Chinese power and influence, taking into account the country’s ageing population, environmental problems, the growth in nationalism, potential for unrest, and regional opposition.
Aging countries will face an uphill battle in maintaining their living standards. Demand for both skilled and unskilled labor will spur global migration. Owing to rapid urbanization in the developing world, the volume of urban construction for housing, office space, and transport services over the next 40 years could roughly equal the entire volume of such construction to date in world history.
Here are some things to think about. The report's authors note that the breadth of global change is comparable to the French Revolution and the dawning of the Industrial Age in the late 18th century, but unfolding at a far more dramatic pace. Whereas it took Britain more than 150 years to double per capita income, India and China are set to undergo the same transformation in a tenth of the time, with 100 times more people. By 2030 Asia will be well on its way to returning to being the world’s powerhouse, just as it was before 1500.
Every year 65 million people are added to the world’s urban population, equivalent to adding seven cities the size of Chicago or five the size of London annually.
The authors of the study state: “It is our contention that the future is not set in stone, but is malleable, the result of an interplay among megatrends, game-changers and, above all, human agency. Our effort is to encourage decision makers—whether in government or outside—to think and plan for the long term so that negative futures do not occur and positive ones have a better chance of unfolding.”
We certainly hope that governments will plan for the long term, but since they tend not to do such a great job even planning for the short term, we will continue to hold gold and encourage our children to buy some too.
To look at the more immediate future let’s begin this week's technical part with the analysis of the Euro Index (charts courtesy by http://stockcharts.com.)
Euro & USD Indices
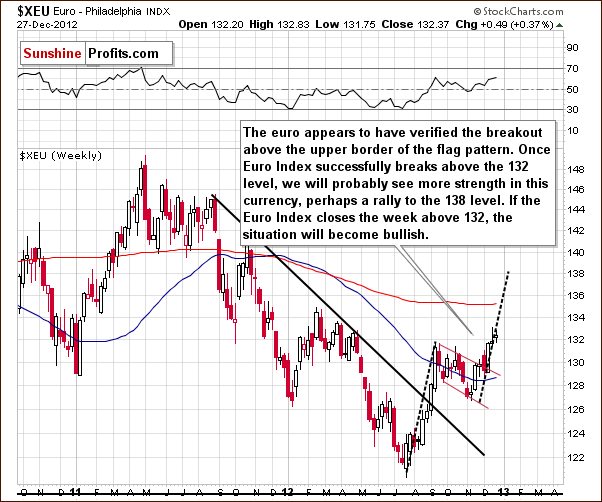
We begin this week with a look at the long-term Euro Index chart. Recall that last week, we had discussed that if the index closed above 132, the breakout would be confirmed and higher values likely. A small decline was seen last Friday, but the Euro Index is once again above the 132 level. If it closes the week in this trading range, the breakout above the September high will be confirmed and a further move to the upside likely. The 138 level appears to be within reach if this holds true. All-in-all, the Euro Index picture this week has bearish implications for the dollar.
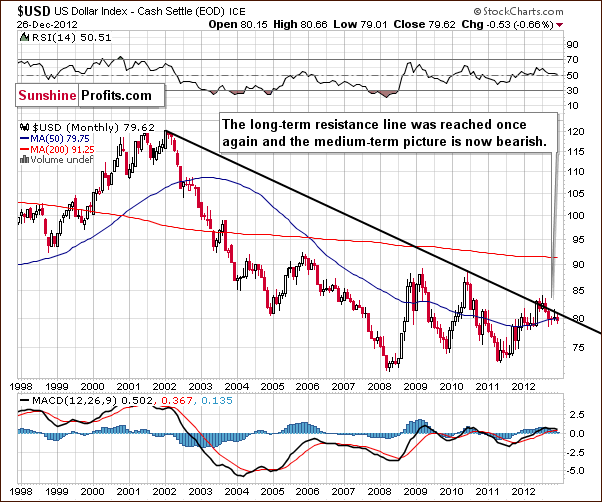
Turning now to the long-term USD Index chart, we see a consistent very long-term trend closely related to what has happened in the Euro Index. Very little changed this week and comments made in last week’s Premium Updateare still up-to-date.
Based on the Euro Index analysis, we expect the USD Index outlook to be bearish and this chart confirms this. Little has changed this week. Lower values are a clear possibility here, and a recent attempt to move above the long-term rising resistance line failed.
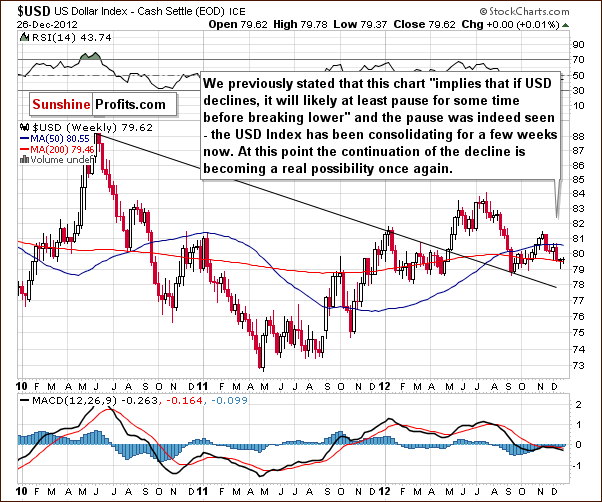
Turning now to the medium-term USD Index chart, the comments made in last week's Premium Update still up-to-date here as well.
A consolidation has been ongoing for over a month, and the index now appears ready to move lower. The decline and consolidation here are a reflection of the upswing and consolidation seen recently in the Euro Index.
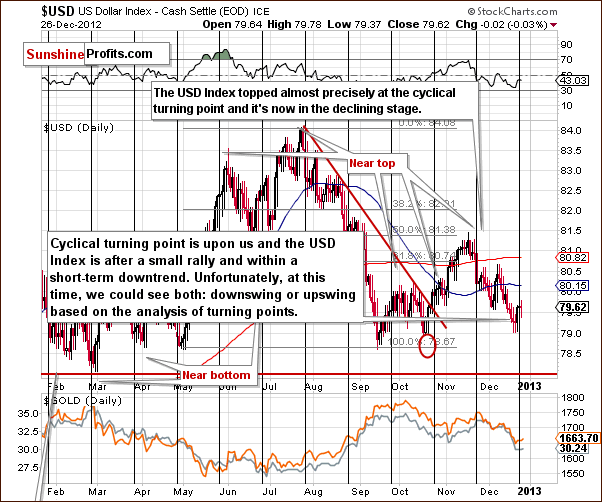
In this week’s short-term USD Index chart, there is an interesting development. A small rally lasting a few days has been seen and this makes the current situation quite confusing. The cyclical turning point is upon us and if it wasn't preceded by a pullback, higher values would be likely to follow. The very short-term trend however has already been to the upside, so we could see a reversal and lower index values. (The Euro Index could continue to rally without a pause as well, or more precisely, after a small pause that is not visible on the above chart that is created based on weekly candlesticks.) In short, it seems that lower values are more than likely to be seen in the USD Index. If the precious metals begin to respond positively to this weakness in the dollar, the short-term picture could quickly become bullish for gold, silver and mining stocks.
Summing up, the situation in the Euro Index improved this week while it deteriorated in the USD Index. Since the cyclical turning point in the latter is quite close and a small rally was seen this week, the implications are bearish. If the precious metals sector begins to respond, then much more strength will likely be seen in gold, silver and mining stock prices.
General Stock Market
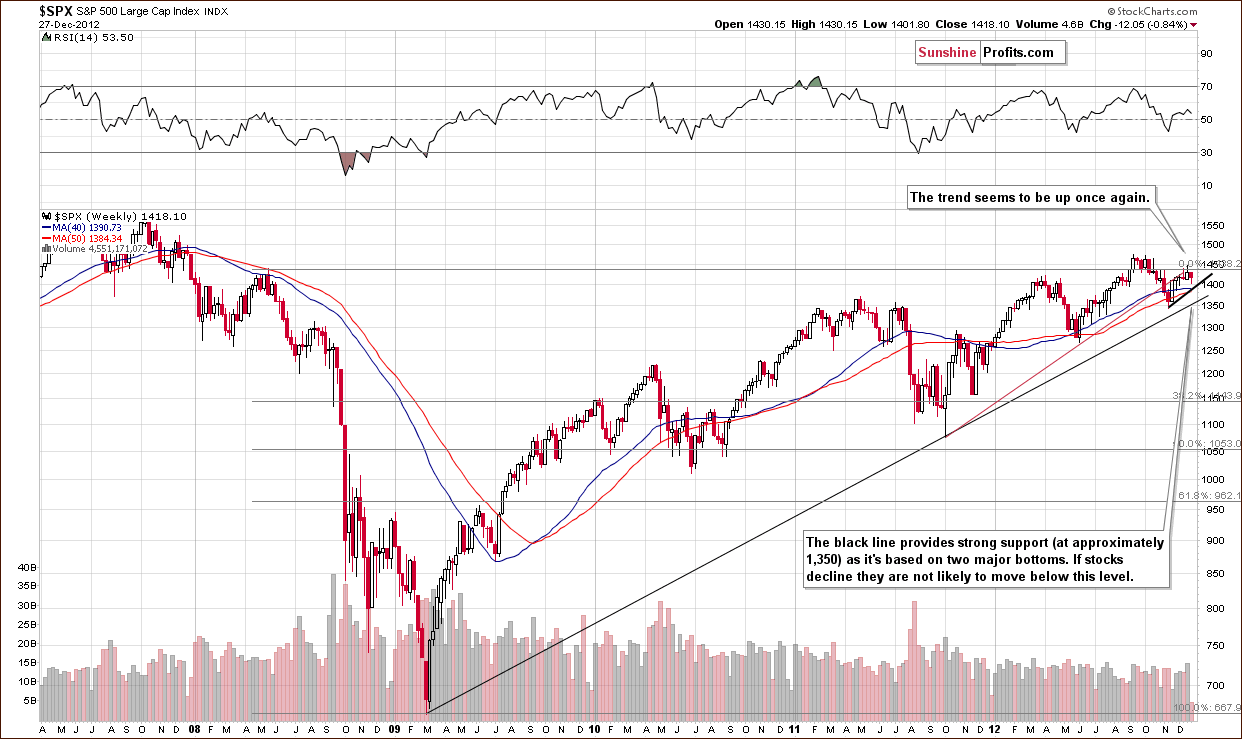
In the long-term S&P 500 Index chart, the short-term trend remains up based on this week’s trading patterns. Stocks did not hold above their 2008 high, but no significant decline was seen this week either. On Thursday, an intra-day reversal was seen after heavy early-in-the-day selling, and this trend to higher prices seems likely to continue.
If stocks do move lower from here, the downside appears to be quite limited with declines unlikely to move below 1,350 for the S&P 500. This is where a strong support line based on major bottoms seen in the spring of 2009 and the fall of 2011 currently resides.
Gold & Silver Correlations
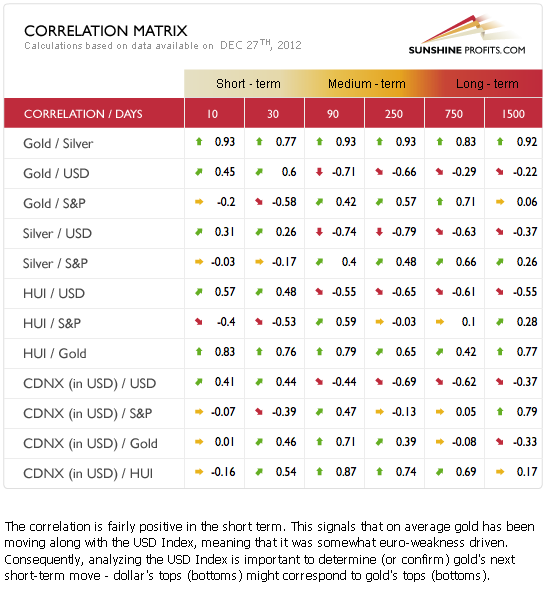
The Correlation Matrix is a tool which we have developed to analyze the impact of the currency markets and the general stock market upon the precious metals sector. Comments concerning the correlation coefficients between markets made in last week's Premium Updateare still up-to-date.
The Correlation Matrix is quite confusing this week as it shows that the coefficients have truly turned upside down. They are pretty much neutral for silver but clearly upside down for gold and the precious metals mining stocks.
The strangest picture here is between gold, and the USD. Gold generally moves opposite of the USD Index but has been pretty much in tune with it for the last 30 days and has moved in the opposite direction of stocks. In short, the situation is far from normal; more on this will be discussed in our gold priced in euro section.
Gold
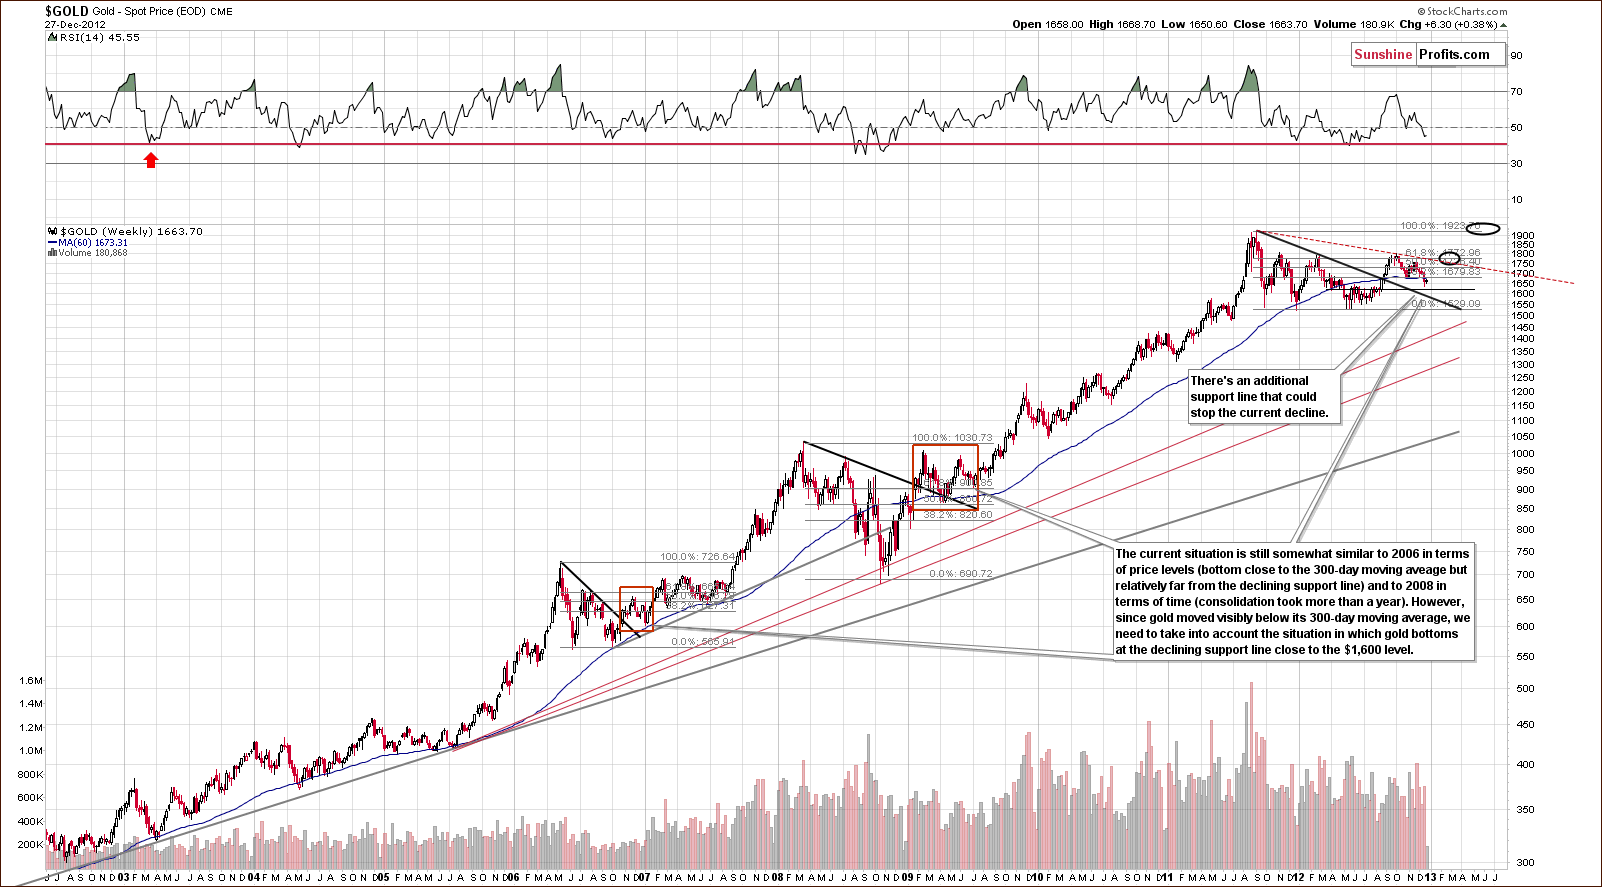
In gold’s long-term chart, we see that a move below the 60-week (300-day) moving average has been quite small. The situation could still be described as in tune with what was seen previously around major and final bottoms which were reached at or slightly below the 60-week moving average before bigger rallies were seen.
While the correction could be coming to an end, more weakness is possible – then again, downside seems to be quite limited. The support line based on the March and April lows is in place and could hold or slow any additional declines – and so is the strong declining support line (bold black line on the above chart). The RSI is also close to its buy area and additional declines in gold’s price would likely trigger a buy signal here. Long speculative positions would most likely once again be suggested if such a scenario plays out.
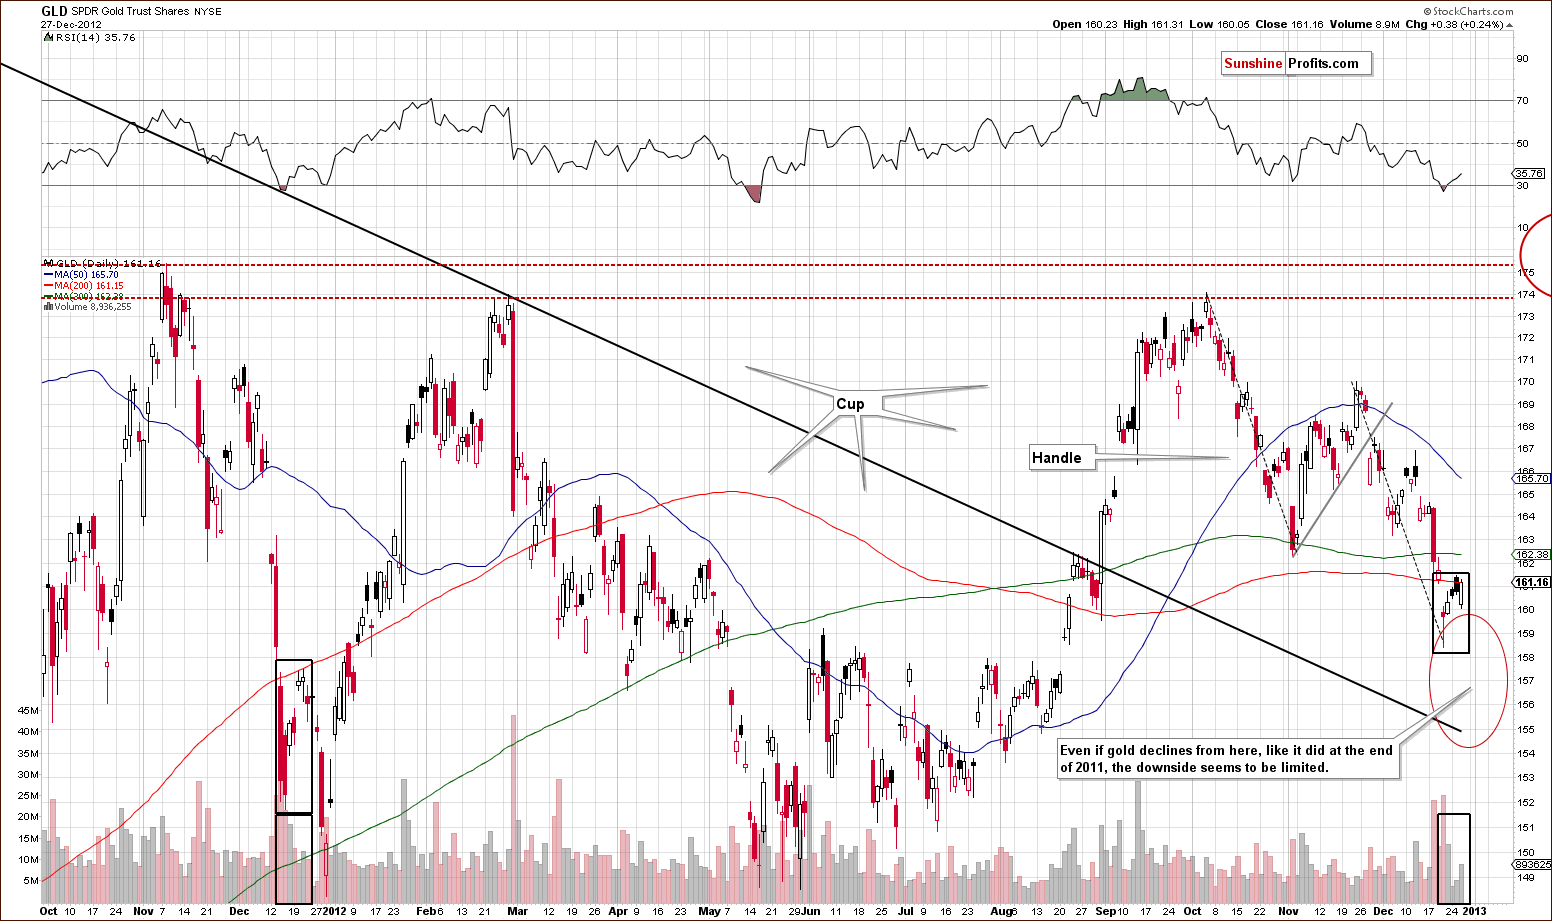
A look at this week’s medium-term GLD ETF chart, we have a factor of concern for the next week or so. What we see here now is very similar to the trading pattern at the end of 2011. A pullback after a decline with low volume levels was followed by a continuation of a sharp decline. This is what may be seen in the days ahead but it would not invalidate the long-term patterns we discussed earlier. Again, this is only a possibility, something that may not be seen at all.
The medium-term picture for gold is bullish but the short term could see additional volatility, with prices perhaps declining to the area of the red ellipse in our chart. It seems best at this time to remain cautious. If gold responds to the USD weakness, then it would likely be an opportunity of get back on the long side of the yellow metal.
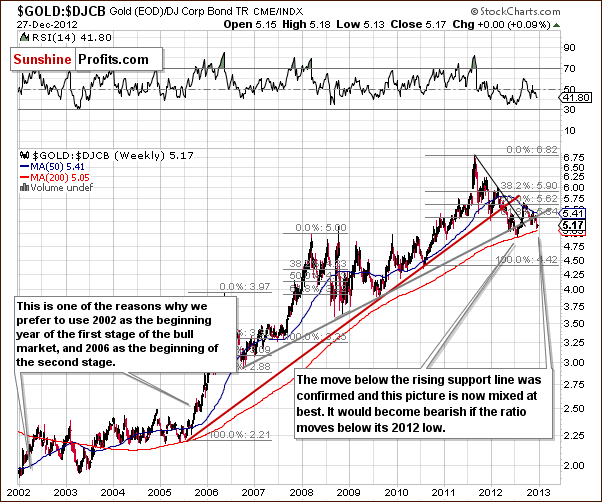
In the gold to bonds ratio chart, we also have a serious concern. The breakdown below the rising support line here has been confirmed and this is not a good sign. Two more support levels are present, however, (precisely: the 200-week moving average that stopped the decline in mid-2012 and the mid-2012 bottom) and since many of the other charts are not bearish this week, we are not overly concerned here. The situation is mixed at best, but a long-term or medium-term decline does not seem to be in the cards based on this chart alone.
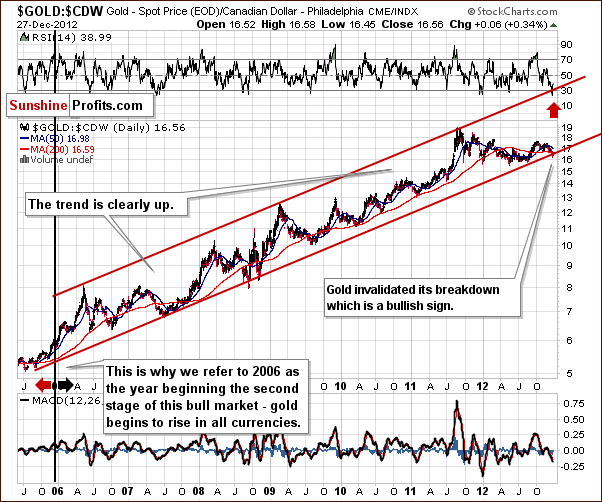
In this week’s chart of gold from the Canadian dollar perspective, the breakdown was invalidated last week and prices have reversed back into the trading channel. This happened after a lengthy consolidation. A significant rally in the medium term is quite possible based on these two facts alone. Additionally, the RSI indicator has just flashed a buy signal when it moved below the 30 level.
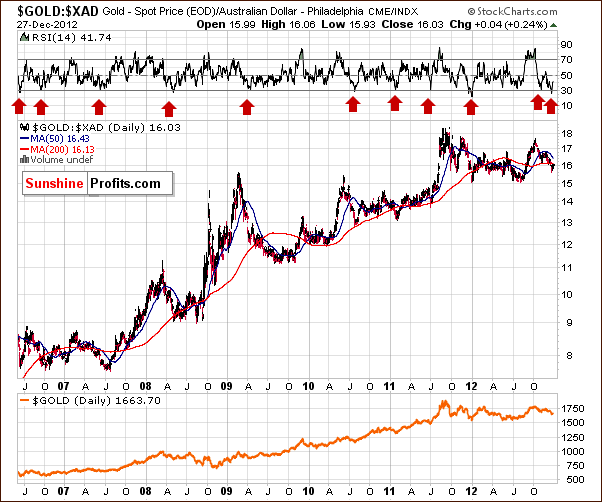
In this week’s chart of gold from the Australian dollar perspective, the RSI levels are also in the buy range, which is yet another bullish signal.
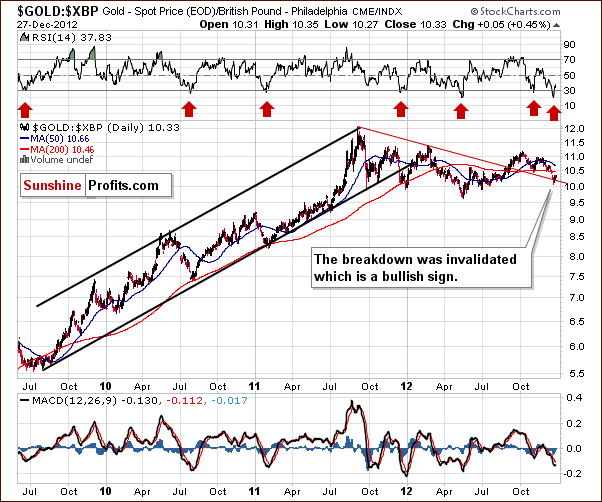
In this week’s chart of gold from the perspective of the British pound, we see an invalidation of the recent breakdown. This is a bullish development and higher gold prices appear likely here.
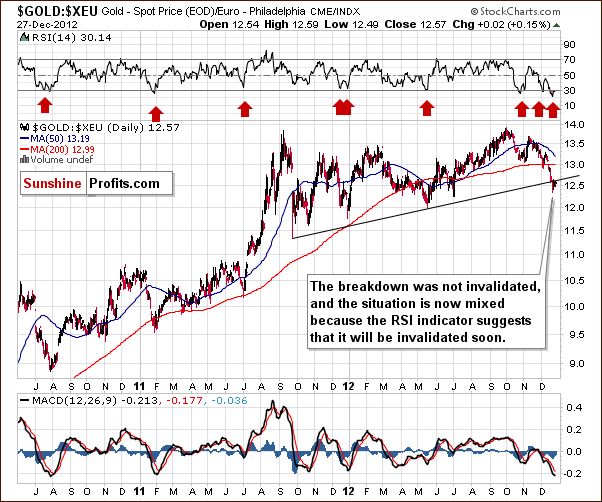
In the gold to euro ratio chart, we have the only gold chart where we see that the breakdown has not been invalidated. RSI levels are not much above 30, so further short-term strength is suggested here. If the breakdown is invalidated, the picture then would become clearly bullish.
The decline in the above chart does quite a good job in representing the simultaneous slide in the dollar and the price of gold (the thing that made the correlations turn upside down in the past 30 trading days). On the above chart we see that the decline is excessive and likely to end or at least pause very soon, so the correlation might return to its normal state in a week or two.
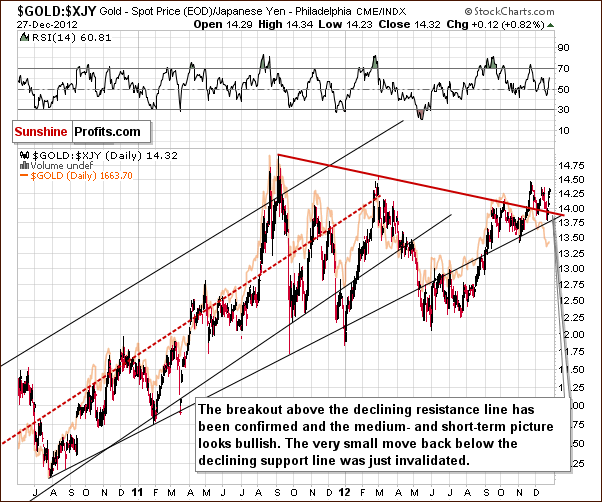
In this week’s chart of gold from the Japanese yen perspective, the already clearly bullish picture here saw another verification of a breakout. Gold priced in yen appears ready to rally to new highs.
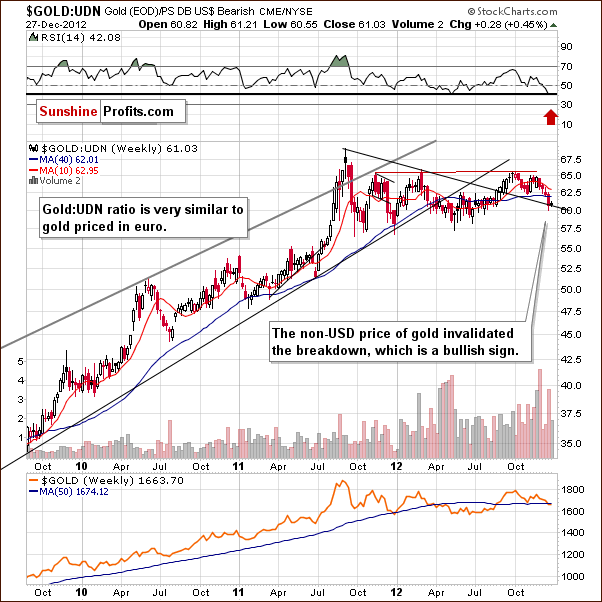
In this week’s chart of gold from the non-USD perspective, which takes the average of gold’s price in numerous currencies, most notably the euro, we saw an invalidation of the breakdown. The week closed above the rising support line and prices held above it this week. No breakdown has been seen, and the situation remains bullish for gold priced in currencies other than the US dollar.
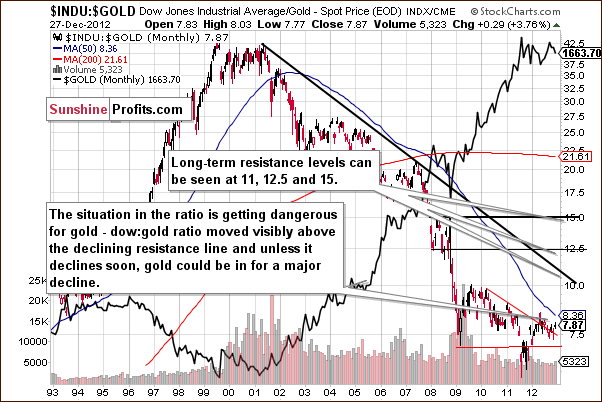
In this week’s Dow to gold ratio chart, no real changes have been seen. The situation is somewhat dangerous here. We will, however, wait at least a few more weeks before describing the outlook as “very bearish”. Recent moves in the ratio have not yet been confirmed.
Summing up, the situation improved for gold on a medium-term basis, but we are quite concerned for the short-term due to the similarities with the end of 2011. History often rhymes, and more weakness could be seen here in the coming week or so. It seems then that the final bottom will be in for the yellow metal quite soon – in a week or two.
Silver
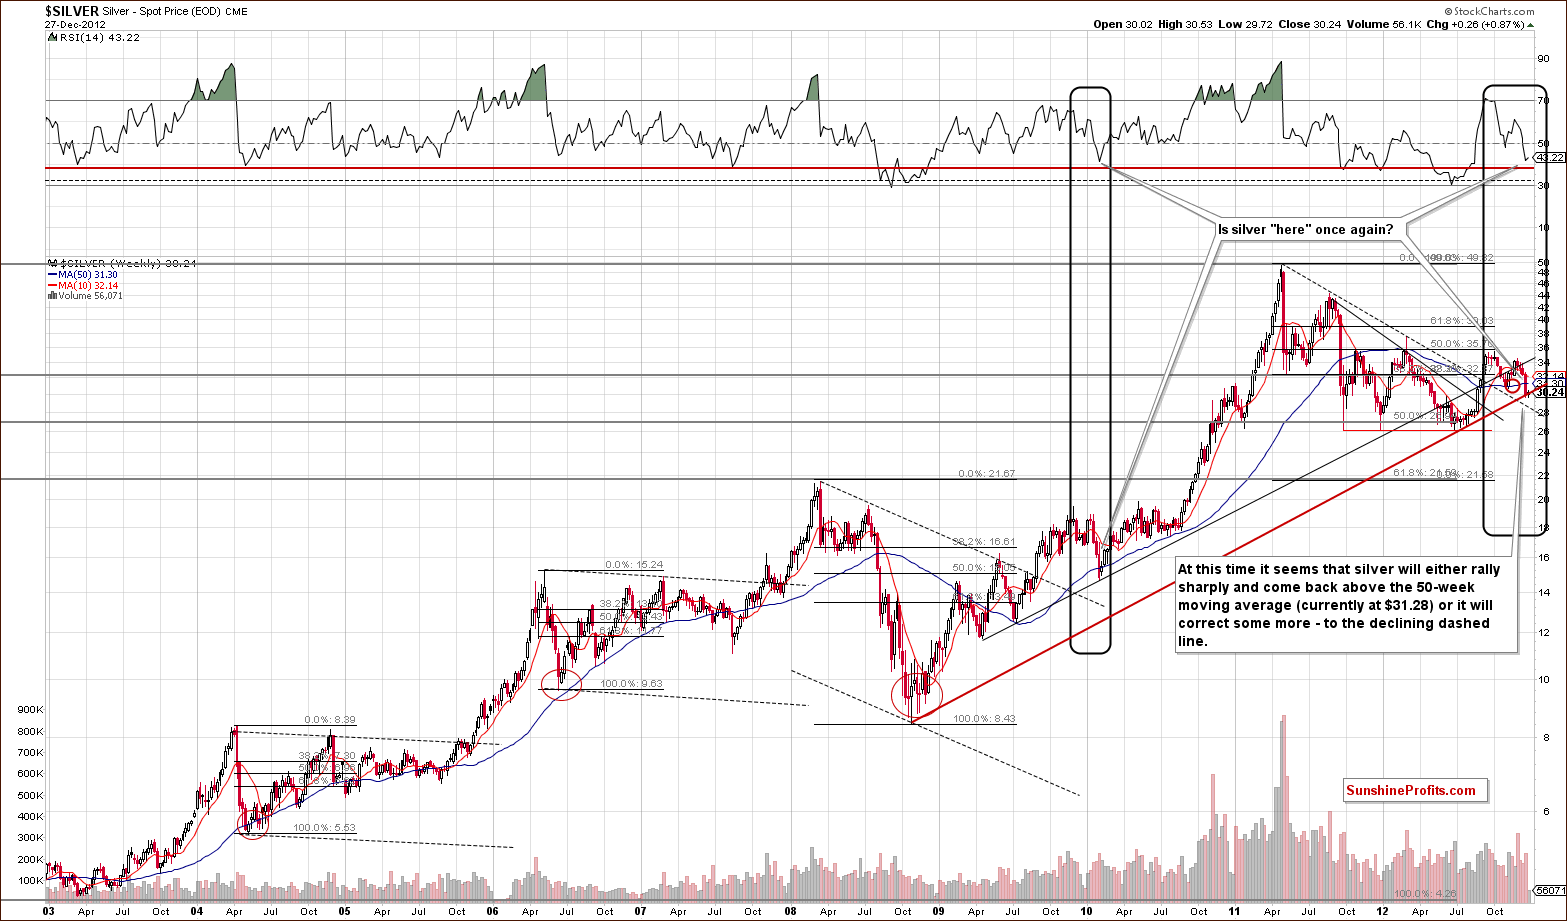
We begin our silver section with a look at the white metal’s long-term chart. This week saw very little change as silver’s price rose less than one percent, so comments made in last week's Premium Updateremain up-to-date:
Additional weakness could (…) be seen on a short-term basis. Also, if gold prices move lower as we discussed earlier, silver's price would likely do the same. The declining dashed support line, currently around $28 could be approached and RSI levels would likely move to the horizontal red line. This would make a situation similar to what was seen in several previous major bottoms.
Current moves in silver's price and the RSI based on it are similar to what was seen in early 2010, nearly three years ago. At that time, silver declined sharply and moved temporarily below the 50-week moving average and formed its final bottom. Lower prices were never seen again. The situation could be similar now or some additional short-term weakness could be seen in the coming days or weeks.
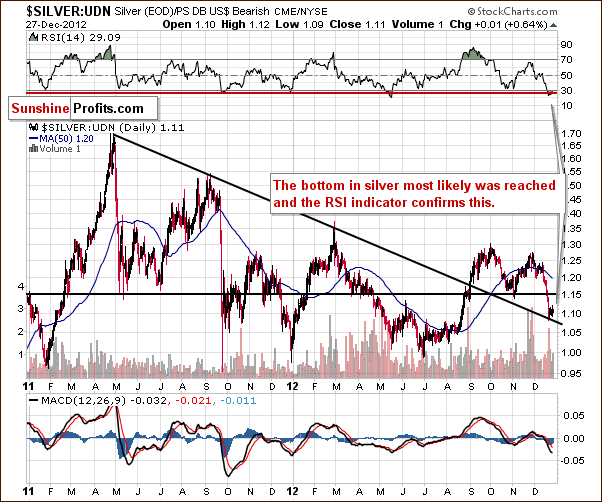
Looking now at silver’s price from a non-USD perspective, nothing changed this week and comments made in last week's Premium Update remain accurate.
We see a correction to the previously broken resistance line, which is now a support level. The line has not been broken and the RSI is extremely oversold, so it is suggested that the local bottom is or will be in soon.
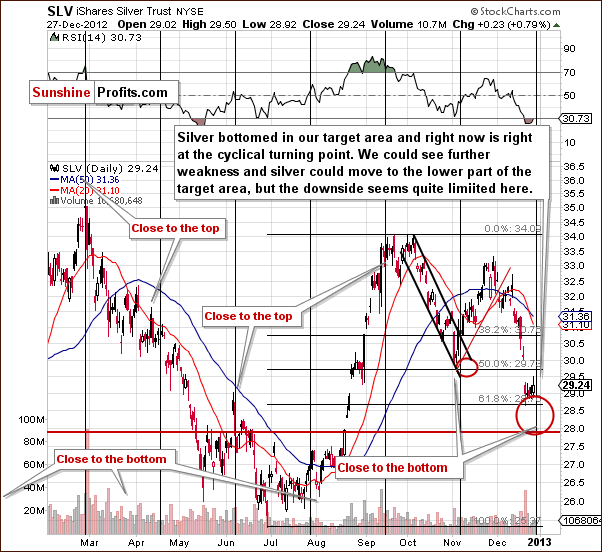
In the short-term SLV ETF chart this week, we see that a cyclical turning point is nearly at hand. The price moves ahead of this have been to the downside, but the price declines have been quite small. The local bottom appears to be in or very close, and prices have reached our target level this week. It seems that we could still see another move back into the target range ellipse which covers the $28 to $29 trading range.
Investors should be prepared for additional weakness here and position themselves to be ready to enter long positions if such bargains are seen in the coming days. RSI levels suggest an oversold situation and a likely move to the upside. Note that silver corrected precisely to the 61.8% Fibonacci retracement level of the previous rally.
Summing up, it seems that silver’s price could continue down for another week or so. The downside appears limited, however, and higher prices seem quite likely in the weeks to follow and the coming months.
Precious Metals Mining Stocks
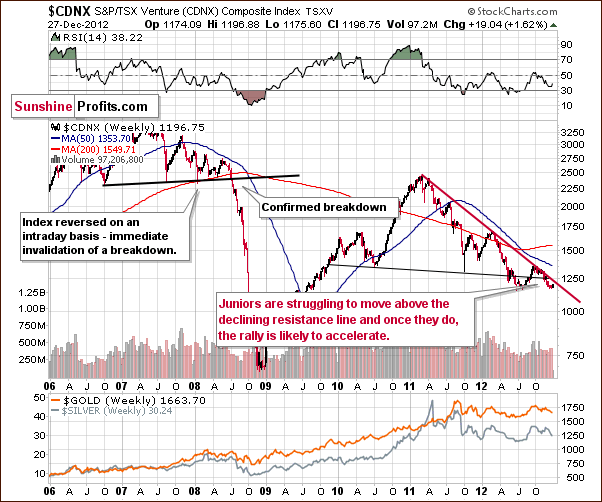
In the Toronto Stock Exchange Venture Index (which is a proxy for the junior miners as so many of them are included in it), nothing really changed this week so last week's Premium Updatecomments remain up-to-date:
No breakout has been seen above the declining resistance line. The index is now closer to the previous bottom. It appears that once the breakout is confirmed, a huge rally is possible. This current (late 2012) consolidation and price swings will then seem to be quite irrelevant. The downside seems limited by 2012 low, and the upside is significant given an almost 2-year long consolidation.
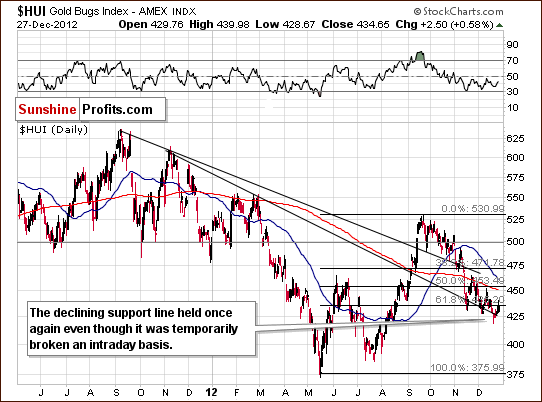
In this week’s medium-term HUI Index chart, last week's Premium Updatecomments remain up-to-date as well:
In this week's medium-term HUI Index chart, we see that mining stocks have held up remarkably well this week. This is in spite of heavy declines for gold and silver. The HUI Index has not closed below the declining support line as it reversed intra-day on Thursday and closed only a bit below than the previous close.
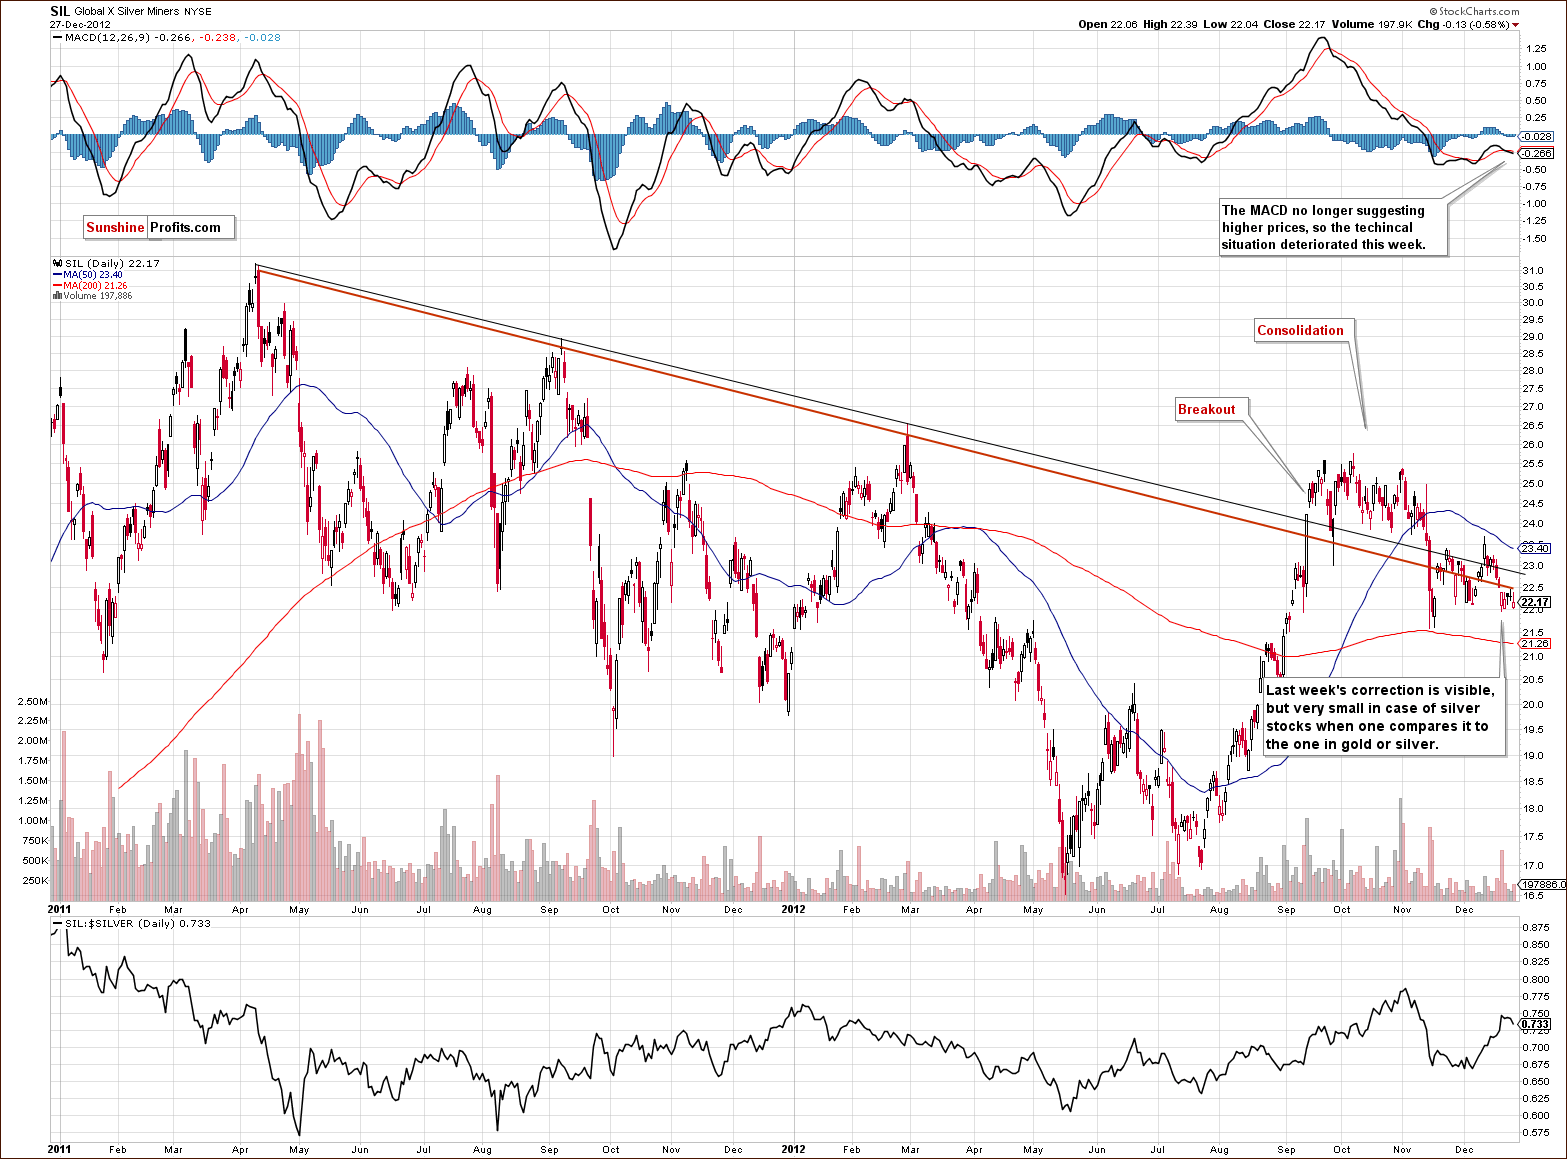
Turning now to the long-term Global X Silver Miners (proxy for silver stocks) chart, we see that this week the MACD no longer suggests higher prices. Its buy signal has been invalidated and this applies not only to SIL ETF but also to the rest of the precious metal sector. However, if strength is seen in the price of silver or in this ETF, the buy signal will once again be seen. At this time, caution seems warranted here.
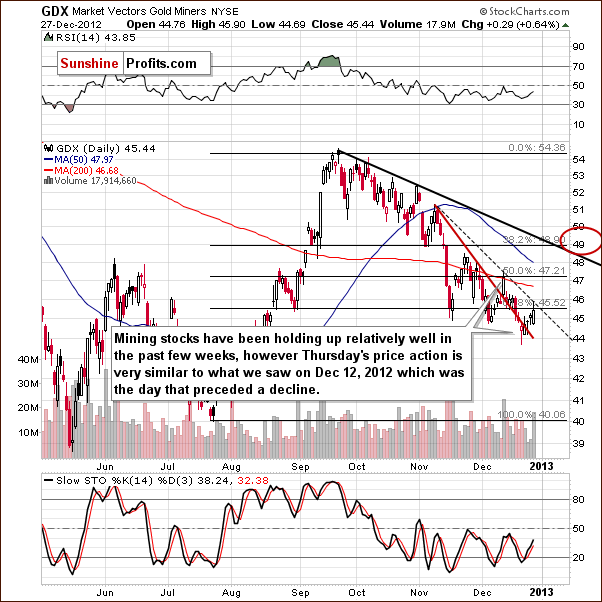
In the GDX ETF short-term chart, we see that some strength has been seen in the past few days but there is some similarity with what was seen back on December 12th. A rally with huge volume was followed quickly by a reversal and this could be the case once again. We would like to see a breakout above the $46 level before stating that the short-term picture is clearly bullish. Betting on higher prices would seem profitable then but not at this time.
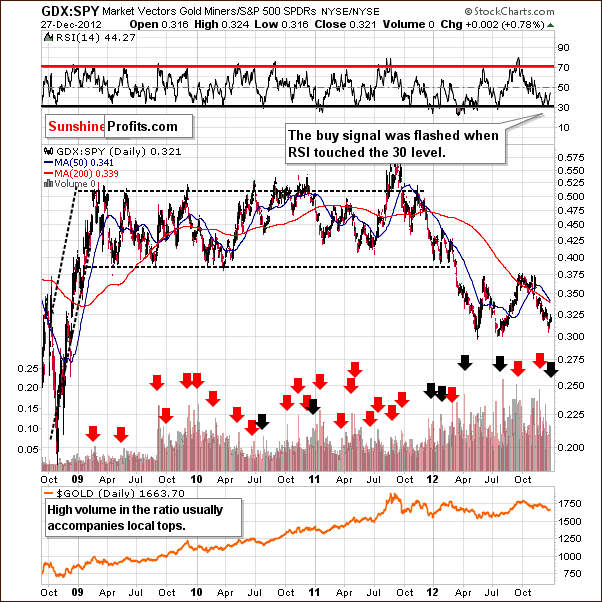
In the GDX SPY ratio chart, where mining stocks’ performance is compared to other stocks, two buy signals have been seen for precious metals in the past two weeks. The indications are clearly bullish here, especially now that the ratio has moved to its 2012 lows. This is yet another indication that the medium-term bottom is already in or very close. Another move to these lows could be seen, however, as short-term predictions are simply not precise here.
Summing up, the medium-term picture based i.a. on the RSI indicator appears favorable, but there are some caution signals in place for the mining stocks. In short, the situation here is quite similar to what was seen in our analysis in gold and silver this week.
Sunshine Profits Indicators
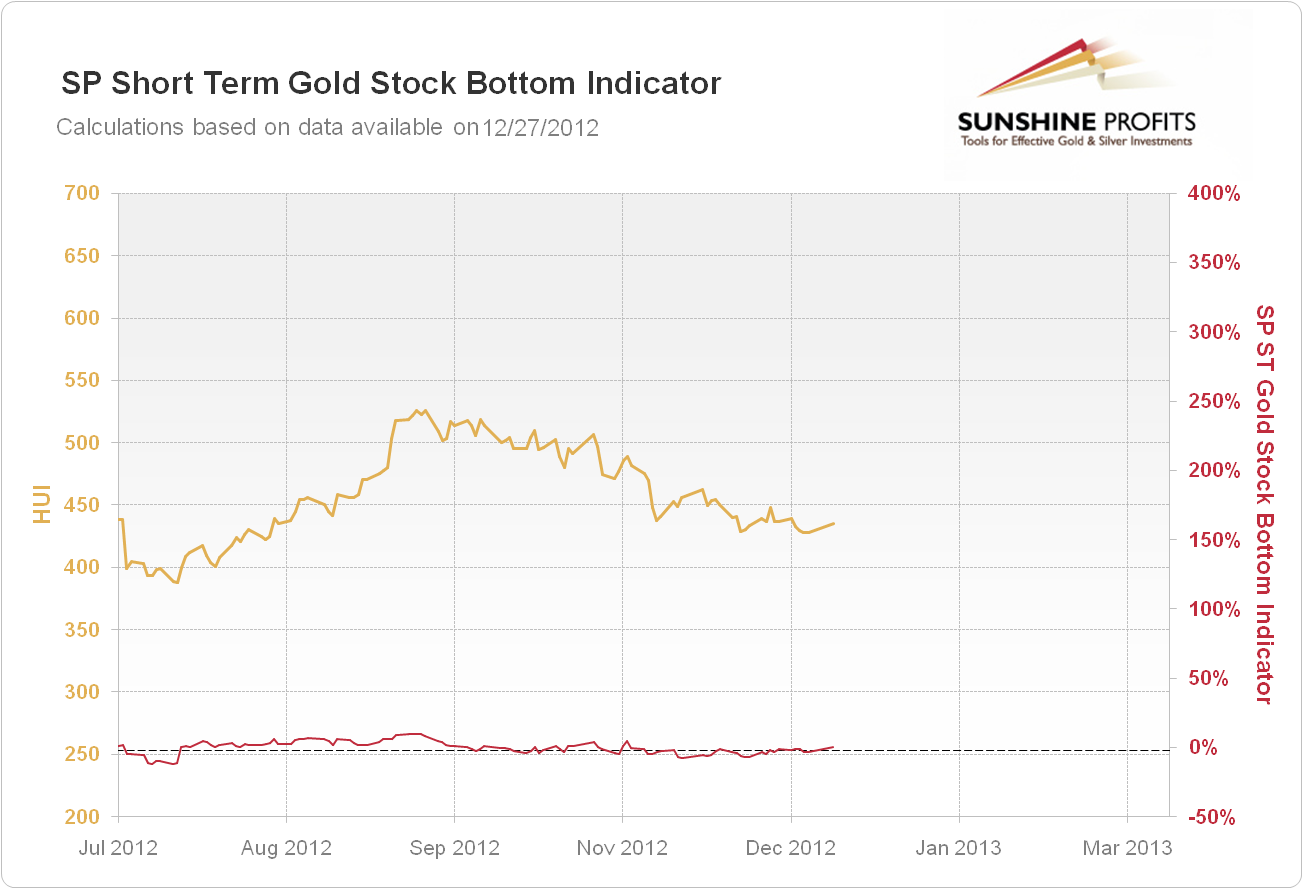
Based on the Dec 27, 2012 closing prices we saw a buy signal from the SP Short Term Gold Stock Bottom Indicator, which is a buy signal for mining stocks. Consequently, we suggest opening small (half of the regular size of the position) speculative long position in the mining stocks. You can see more details regarding this signal on the Indicators’ Details and Performance page.
Letters from Subscribers
Q: What is the likelihood of silver surpassing the April 2011 high before June 2013? I hope you have a successful and prosperous 2013. Best wishes.
A: We currently give it a 30% chance. In other words, we think that the April 2011 high will be surpassed at a later date - later in 2013 (30%) or even later (35%). This leaves us with a 5% probability that silver will never surpass its April 2011 high.
Q: I read your articles on safe havens, and found them veryhelpful. Thank you for your devotion to the average investor. Can you shed some light on the following regarding India:
1. If the dollar collapses, what happens to gold vis-à-vis the rupee?
2. We currently receive 9% interest in a fixed bank deposit. Inflation is 8%. Would it be more profitable to invest in gold in India? And will gold provide returns greater than inflation?
3. Does fiat currency exist in India?
Insight on the above would be very helpful. Thanks and regards.
A: Thank you for your feedback, we appreciate it. As far as your questions are concerned:
1. We think that gold would rally strongly in this case, in terms of the Indian rupee. In fact, if the US dollar collapses then gold and silver will most likely soar very high in every other currency and relative to other goods as well.
2. While we can't guarantee any rate of return on gold or any other asset, we believe it's highly likely that gold will provide a much higher return in the coming years than the fixed bank deposit you mentioned, and more than inflation.
3. Yes, the Indian rupee is not backed by gold or other precious metals and is therefore a fiat currency. You will find more information on fiat currency in our Publications section.
Summary
The breakout in the Euro Index is close to being verified and much higher index values are likely. This has bearish implications for the USD Index and the real question is whether the dollar will decline immediately or after an additional short-term rally. These appear to be the two most likely outcomes.
We expect to see a return of the negative correlation between the USD Index and the precious metals very soon. Once seen, we will likely suggest entering long, speculative positions in gold, silver and mining stocks but the time is not yet here.
The medium-term picture for the precious metals sector overall appears favorable, and we suggest keeping long-term investment positions intact. There are several short-term indicators that concern us about the sector in the coming week or two. The most important technical development this week is the invalidation of the breakdown in gold viewed from the non-USD perspective.
The medium-term outlook overall remains very bullish but caution should prevail for the short term. We believe it best at this time to wait for additional confirmations before entering long-speculative positions.
Trading – PR: No positions
Trading – SP Indicators: Long position mining stocks
Long-term investments: Remain in the market with your precious metals holdings
| Portfolio's Part | Position | Stop-loss / Expiry Date |
|---|---|---|
| Trading: Mining stocks | Long (half) | No stop loss / Jan 11, 2013 |
| Trading: Gold | No positions | - |
| Trading: Silver | No positions | - |
| Long-term investments | Long | - |
This completes this week’s Premium Update. Our next Premium Update is scheduled for January 4, 2013. Of course, we will continue to send out Market Alerts on a daily basis at least until the end of January, 2013 and we will send additional Market Alerts whenever appropriate.
Thank you for using the Premium Service. Have a great weekend, and a Happy New Year!
Sincerely,
Przemyslaw Radomski, CFA


