
- Euro & USD Indices
- General Stock Market
- Correlation Matrix
- Gold
- Silver
- Palladium
- Mining Stocks
- Sunshine Profits Indicators
- Letters from Subscribers
- Gold and the dollar collapse
- ETF's vs physical metals
- Overseas vaults
- Summary
The Federal Reserve is doing it again. Not surprising that the central bank would not want to rock the boat just as the economy is hurtling towards the fiscal cliff. A bad economy seems to be conducive to colorful metaphors.
The Fed announced Wednesday that it would continue its monthly purchases of $85 billion in Treasury bonds and mortgage-backed securities. Just as important for future gold prices was the Fed's announcement that it intends to keep interest rates near zero as long as unemployment remains high. In what is a historic change to monetary policy, the Fed surprised by announcing that it expects to keep rates low as long as its inflation forecast stays below 2.5 per cent.
It is the first time a large central bank has ever tied its interest rate policy directly to the state of the economy. By saying that it anticipates that it will keep interest rates extremely low until the unemployment rate falls to 6.5% (and as long as inflation doesn't get out of control), the Fed has become more determined to turn the economy around. The November jobless rate was 7.7 percent and it doesn't look like the unemployment rates will drop anytime soon. This is bad for the economy but is bullish for gold. Quantitative easing for the price of gold is like yeast in a bread recipe. Give it time in a warm oven and it will rise sooner or later.
The Fed's expansion of its balance sheet will devalue the dollar and we all know what that means for the price of gold. Although it's probable that the Fed announcement was already priced into the market, for the longer term it will be the yeast that will make the price of gold rise. The Fed's move carries risks. If the Fed has misjudged the health of the economy, then inflation might start to rise before unemployment falls to 6.5 per cent, forcing it to violate its pledge or else let prices get out of control. That scenario would be bullish for gold since it is seen as a perfect hedge against inflation.
The Fed's announcement was not the only news this week. Let's play “connect the dots” with various news items from around the world.
1. On CNBC Business News: Germans are increasingly buying gold in recent months because of fears about economic uncertainty and a third of them are now considering gold as part of their investments (note: this still leaves most investors without gold – which suggests that the final stage of the precious metals bull market remains to be seen), according to a study from German precious metals group Heraeus Holding GmbH. German private investors now own 8,000 tons of gold, Heraeus said (That's about the same as the amount stored in Fort Knox.) They favor gold bars and more than half like to keep them at home.
2. In The Financial Times: Sales of American Eagles, one of the most popular gold coins, leapt 131 per cent in November, hitting their highest level in more than two years. This was right after the election of Barack Obama, which opened the possibilities of more quantitative easing like we saw this week. The Royal Canadian Mint also had its strongest month of sales this year. The political gridlock in Washington and the prospect of further quantitative easing have fuelled demand for precious metals among small investors.
3. Also from the Financial Times: “Latin American catches the gold bug.” Central bankers move in herds and after several Asian central banks announced purchases of gold in the past few years (China, India, Thailand, South Korea, Sri Lanka and Bangladesh) it's now time for Latin America. Mexico last year bought close to 100 tons in a couple of months. Recently Brazil bought almost 20 tons, according to IMF data.
4. From Reuters: South Africa gold output fell by 45.7 percent in volume in October while total overall mineral production was down 7.7 percent compared with the same month in 2012 mostly due to the effects of the mine wildcat strikes.Seasonally adjusted mining production decreased by 7.9% in October compared with September. This followed month-on-month changes of -7.0% in September and 2.4% in August. South Africa is slipping down the rankings of major gold producing nations – where it was the world's dominant producer for virtually the whole of the 20th Century. Last year it was the fourth largest producer after China, Australia and the USA and this year it could well fall another notch – below Russia.
So, if we connect the dots we have a new round of QE, interest rates will remain close to zero for the foreseeable future, stories from around the globe tell of increased gold purchases and at least one item talks about decreased gold production. More demand +less production = higher prices ahead.
Last week everyone talked about the Goldman Sachs reduced forecast for gold prices. This week Deutsche Bank is weighing in and is looking for a recovery in gold prices. “In our view, QE is working and will drive U.S. real interest rates and the U.S. dollar lower as we head into next year,” the bank says in a weekly commodities report. “We believe this will reverse the recent weakness in the gold price.”
One final light item before we turn to the technical portion of the Premium Update. It seems that bees don't do it and birds don't do it, but ants and termites do. We're talking gold of course. In a story out of Australia, it seems that the small insects stockpile gold by carrying it from underground up into their mounds and also accumulating metals in their bodies. According to a mining official, the mounds may hold a negligible amount of gold, but may offer an important clue to uncovering new gold deposits. The insects bring evidence from five meters down, cutting costs of exploration drilling.
Meanwhile, we have been busy bees making charts and analyzing them so it's time to begin this week's technical part with the analysis of the Euro Index (charts courtesy by http://stockcharts.com.)
Euro & USD Indices
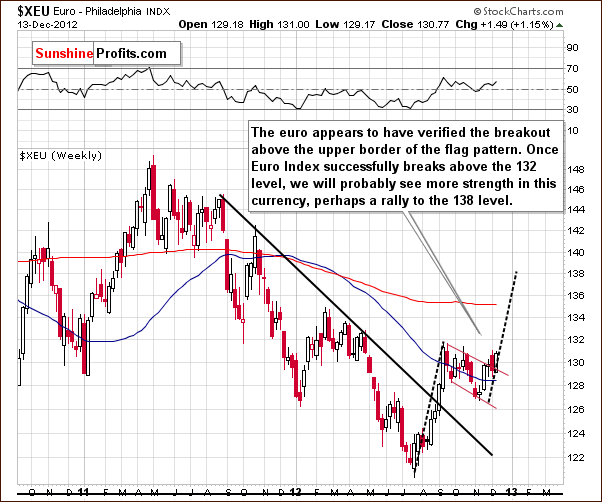
We begin this week with a look at the long-term Euro Index chart. A confirmation of the breakout above the flag pattern (which was a period of consolidation) has been seen. We expected this to be broken to the upside, and that's what happened. The index did pull back to the support line and has moved higher once again. The situation is now more bullish than not, but we'll wait for a move above the 132 level before stating that the outlook is indeed bullish for the weeks ahead.
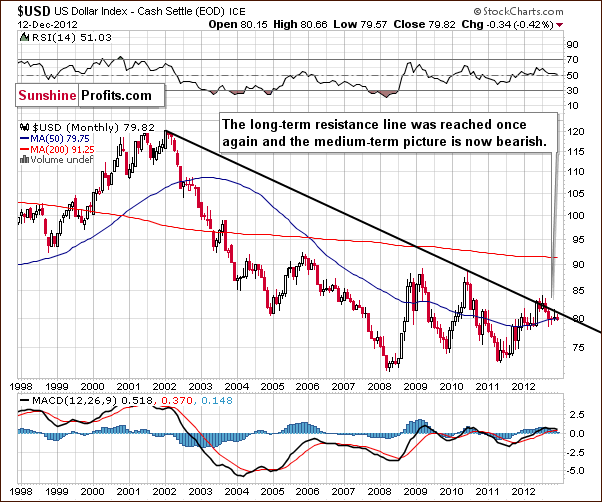
Turning now to the USD Index charts, as usual, the situation in the Euro Index has impacted what happens here. The situation is more bearish than not and what we reported to you in last week's Premium Update is still up-to-date:
Based on the Euro Index analysis, we expect the USD Index outlook to be bearish and this chart confirms this. Little has changed this week. Lower values are a clear possibility here, and a recent attempt to move above the long-term rising resistance line failed.
The trend will remain down even if the USD Index moves to the last Fibonacci retracement level (around 82). With a cyclical turning point fast approaching, the Index is more likely than not to move lower from here from a technical perspective.
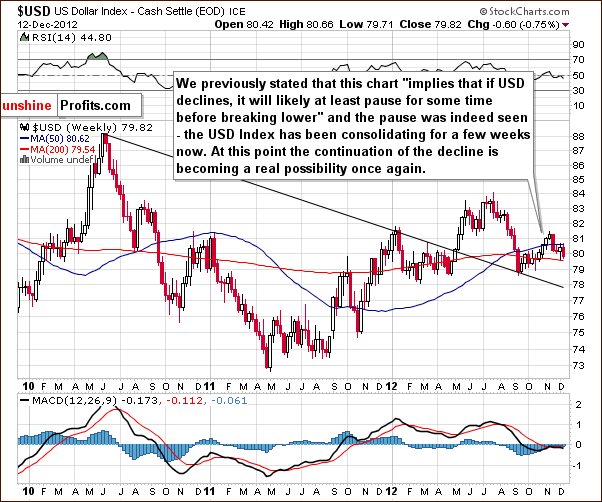
Turning now to the medium-term USD Index chart, we also quote from last week's Premium Update:
A consolidation has been ongoing for over a month, and the index now appears ready to move lower. The decline and consolidation here are a reflection of the upswing and consolidation seen recently in the Euro Index.
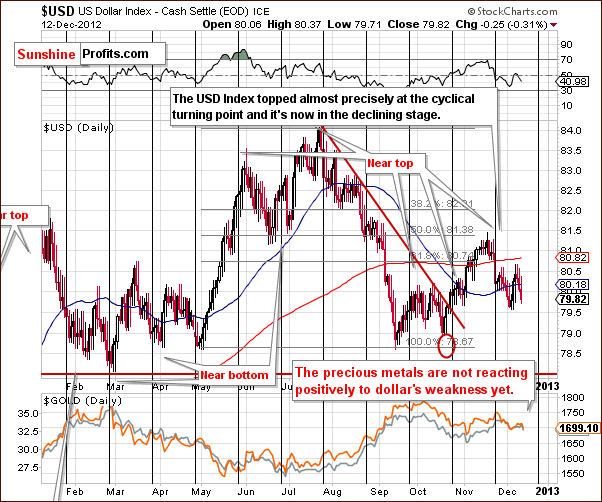
In this week's short-term USD Index chart, we see a continuation of the recent decline. This would be a very good news for gold bulls if it wasn't for the fact that lower index values here have not led to higher gold prices. The lower USD index values were something we expected a couple of weeks ago, but the part that is not as we expected is metals lack of response to this usually bullish piece of information. Right now this lack of reaction can still be viewed as a bearish factor for gold, silver and mining stocks. One bright spot is that it seems that the period of negative or no correlation between the dollar and the metals is close to being over based on the chart featuring gold priced in euro.
Summing up, the outlook for the USD Index remains bearish although a week or two of strength followed by a local top close to the cyclical turning point is possible. Overall, the situation is more bearish than not, but the short-term implications for the precious metals are unclear.
General Stock Market
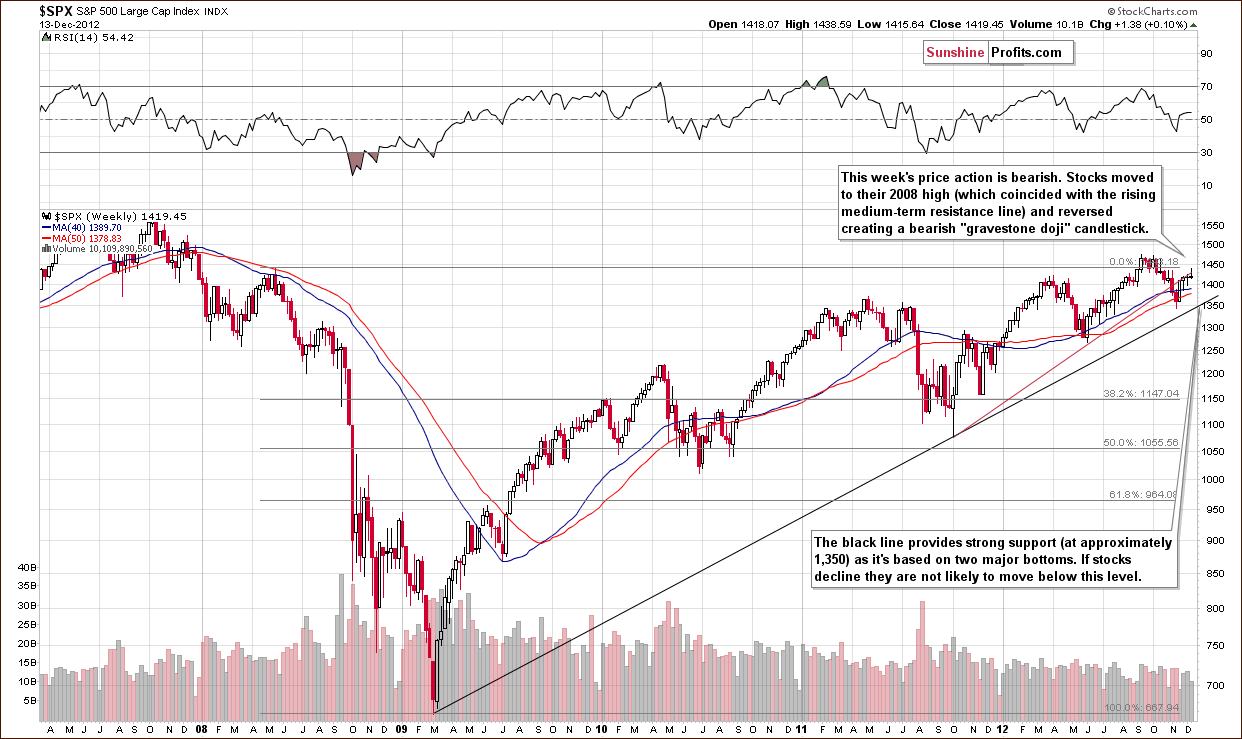
In the long-term S&P 500 Index chart (click to enlarge it), a good summary of the general stock market is seen this week so it will be our only stock chart. Based on the weekly closing prices, a “gravestone doji” candlestick pattern has formed this week. This is similar to the bearish shooting star candlestick pattern. Opening and closing prices being very similar are what create the “gravestone doji”. The implications of this candlestick pattern are exactly the same and are a bearish signal.
The bearish signal is quite important here because stocks reversed (and created the above-mentioned candlestick) after moving to their 2008 highs and the previously broken rising resistance line. At this time, the outlook for the general stock market is bearish, but, with a support line at the $1,350 level, the downside seems to be quite limited.
Correlation Matrix
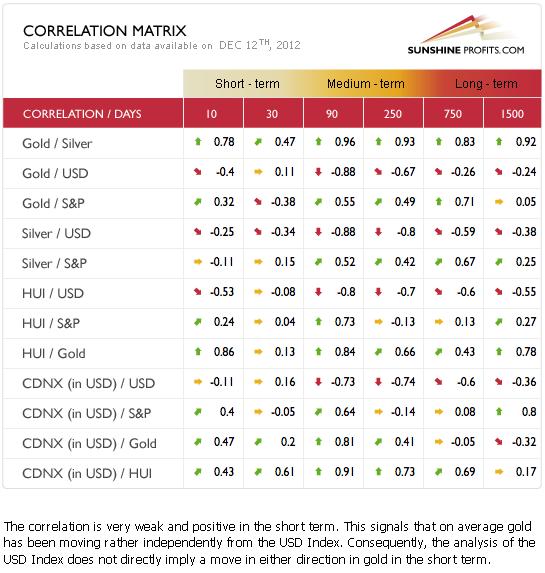
The Correlation Matrix is a tool which we have developed to analyze the impact of the currency markets and the general stock market upon the precious metals sector. This week, there are not many implications here for the precious metals sector. The short-term correlations are very neutral this week so we really can't say much about the next week or two based on the currency and stock market charts.
The medium-term precious metals' picture remains bullish as there are significant negative correlations between the precious metals and the USD Index. Positive correlation is seen between stocks and the precious metals, so the limited downside for stocks is a bullish factor for the metals. In order for a better analysis what will happen in the days and weeks ahead, we must look to the charts for gold, silver and the mining stocks this week.
Gold
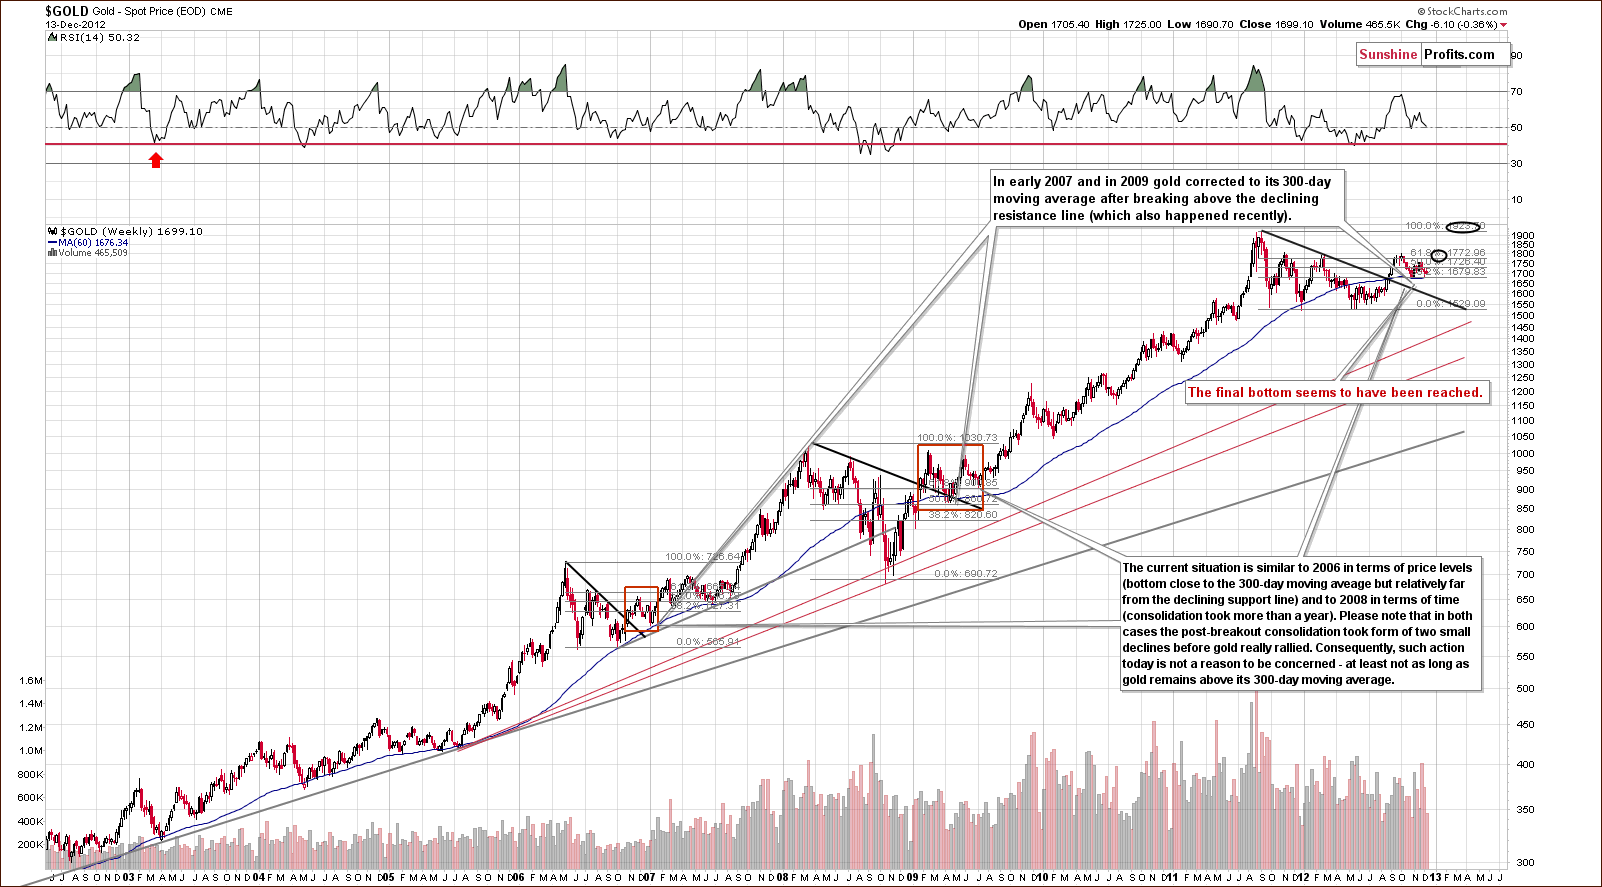
In gold's very long-term chart, little has changed this week. What we wrote in last week's Premium Update is still up-to-date and accurate.
We have seen a period of consolidation and the formation of the handle in the cup-and-handle pattern. Interestingly, recent price patterns have been quite similar to what was seen in 2009 and in the 2006 to early 2007 period. After breaking above the declining resistance line, consolidating, and declining once again, periods of significant rally followed in both years.
It seems we could be seeing this type of price pattern once again. The second bottom which was formed in 2007 was below the first, whereas in 2009 the second bottom was a bit higher. In both cases, however, the bottom formed above the 300-day moving average. This points to a bullish picture here in 2012 as gold is very close to the 300-day moving average which implies that a local bottom is close or may have already formed.
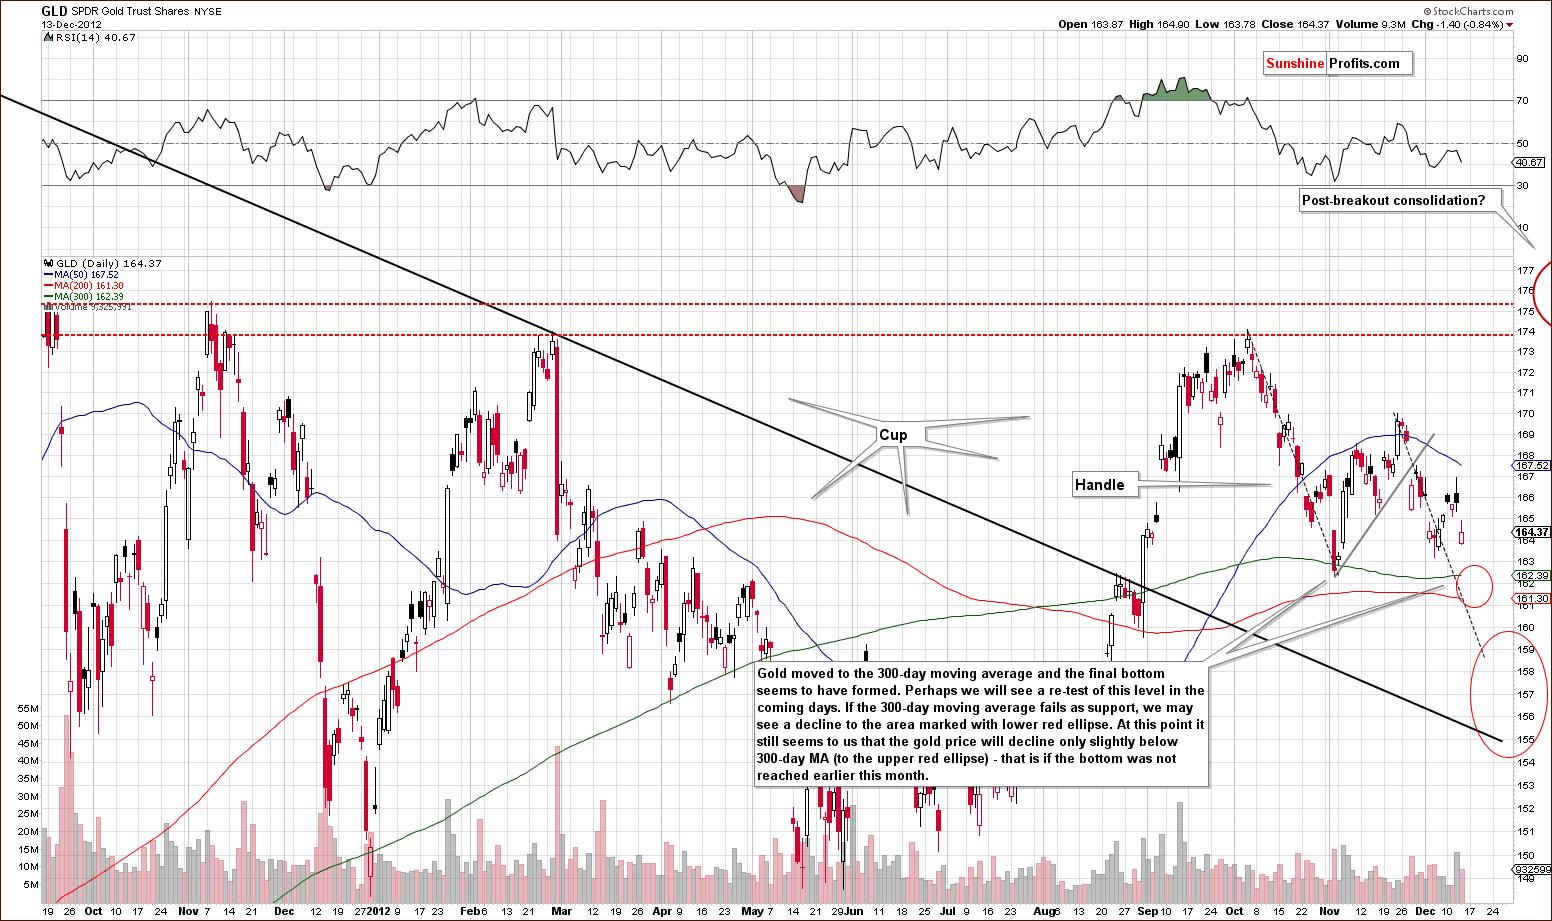
A look at this week's medium-term GLD ETF chart shows us a promising rally earlier this week, which was followed by disappointment on Thursday. Prices are now at a point similar to December 1st. We could see prices move to the 300-day moving average but it seems unlikely that prices will move below the red ellipse. So the downside seems limited here.
If the first red ellipse does not hold, then a move to the lower ellipse is possible. It seems unlikely that prices will move any lower. The probability of declines being held in the range of the first ellipse seems to be about 65% (in other words: we see about 35% probability of gold moving below the upper red ellipse in the next 3 months) and we estimate an 85% likelihood that prices would not move lower than the second ellipse in the next 3 months.
In this chart we also see a cup-and-handle pattern with a significant handle. It seems that the formation could now be complete and a rally could very well follow once the current consolidation is over – no later than in the next few weeks. A lengthy consolidation period has been seen and gold prices have not moved nearly as wildly as a year ago. Once prices do finally rally, there could be some volatility once again. Just as we saw a transition from volatile to calm, a changeover from calm to volatile could very well be next. On a side note, this is one of the ways of the technical tools called the Bollinger Band works – these bands become narrow when volatility declines and bigger moves are to be expected when these bands are very close to each other – indicating low volatility
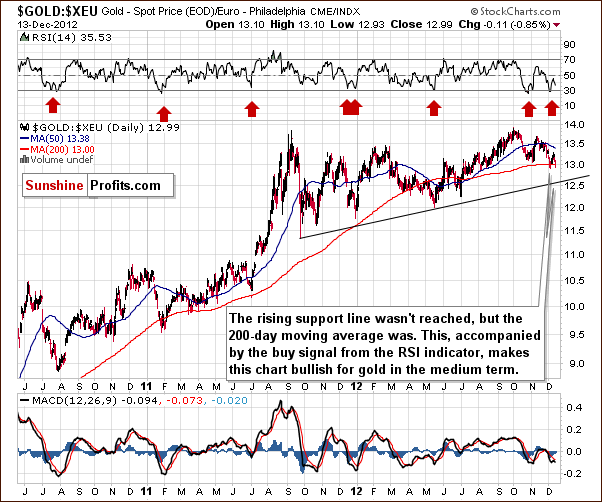
In this week's chart of gold from the non-USD perspective, prices are still above the support line created by the 200-day moving average and the declining support line. The medium-term trend remains up at this time.
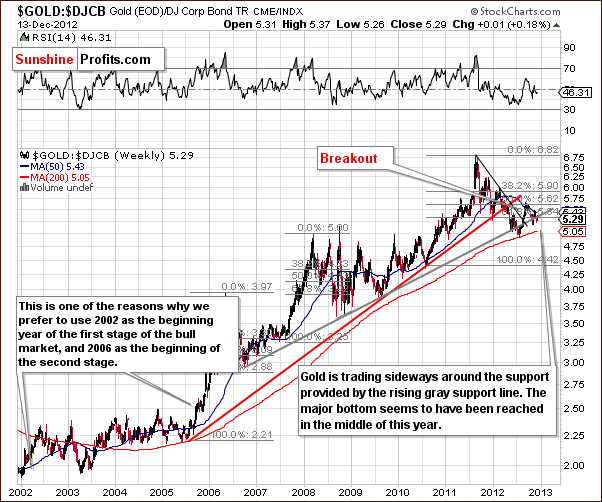
In the gold to bonds ratio chart, the same is true as gold has been trading back and forth around the rising support line without any sign of a breakdown. The outlook remains bullish for the medium and long term here.
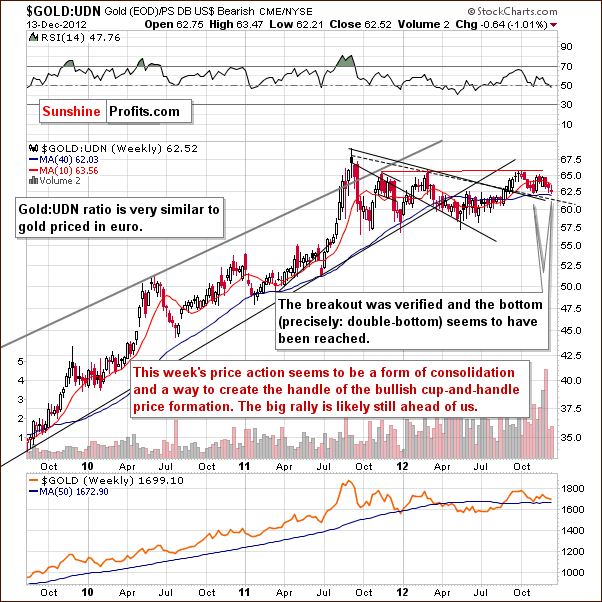
In the gold to euro ratio chart, a long-term perspective, we see the ratio has moved to the 200-day moving average once again. While the bottom could be in right now, it is possible that gold could move a bit lower. If gold does decline however, we don't expect the ratio here to move below the rising support line based on the September 2011 and May 2012 lows.
Consequently, it's a bit more likely than not that gold will soon resume it's negative correlation with the USD Index, but it's not a sure bet.
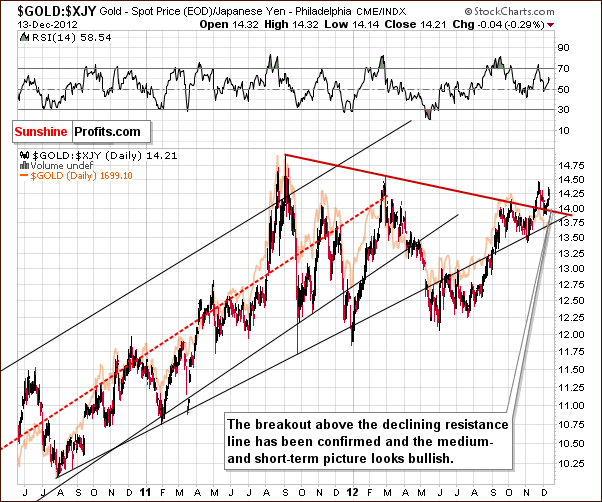
In this week's chart of gold from the Japanese yen perspective, we have a very bullish picture. We just saw a confirmation of the breakout above the declining resistance line and the medium-term outlook here is now bullish.
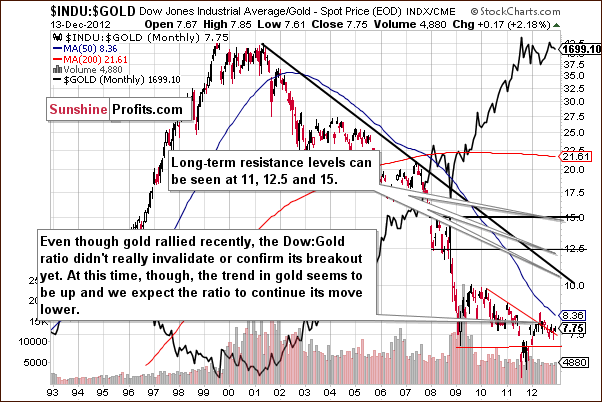
In this week's Dow to gold ratio chart, the period of indecision of continues. Gold has been trading back and forth above and below the resistance line. What we wrote in last week's Premium Update is still up-to-date and accurate.
A significant move in either direction could spark a bigger move that way. If gold continues to outperform stocks, a longer period of outperforming is likely. If, however, gold underperforms stocks, a bigger period of underperformance will likely be seen. We expect gold to outperform stocks, and it seems that a big move will soon be seen with this ratio declining sharply.
Summing up, the short-term outlook for the yellow metal remains unclear but the medium-term and long-term ones remain bullish. Gold could move lower here, but we think that the bottom will probably (65%) be reached no lower than in the $1,660 - $1,674 range. Even if gold moves below this level, it will most likely (85%) not move below the $1,610 - $1,640 range.
Silver
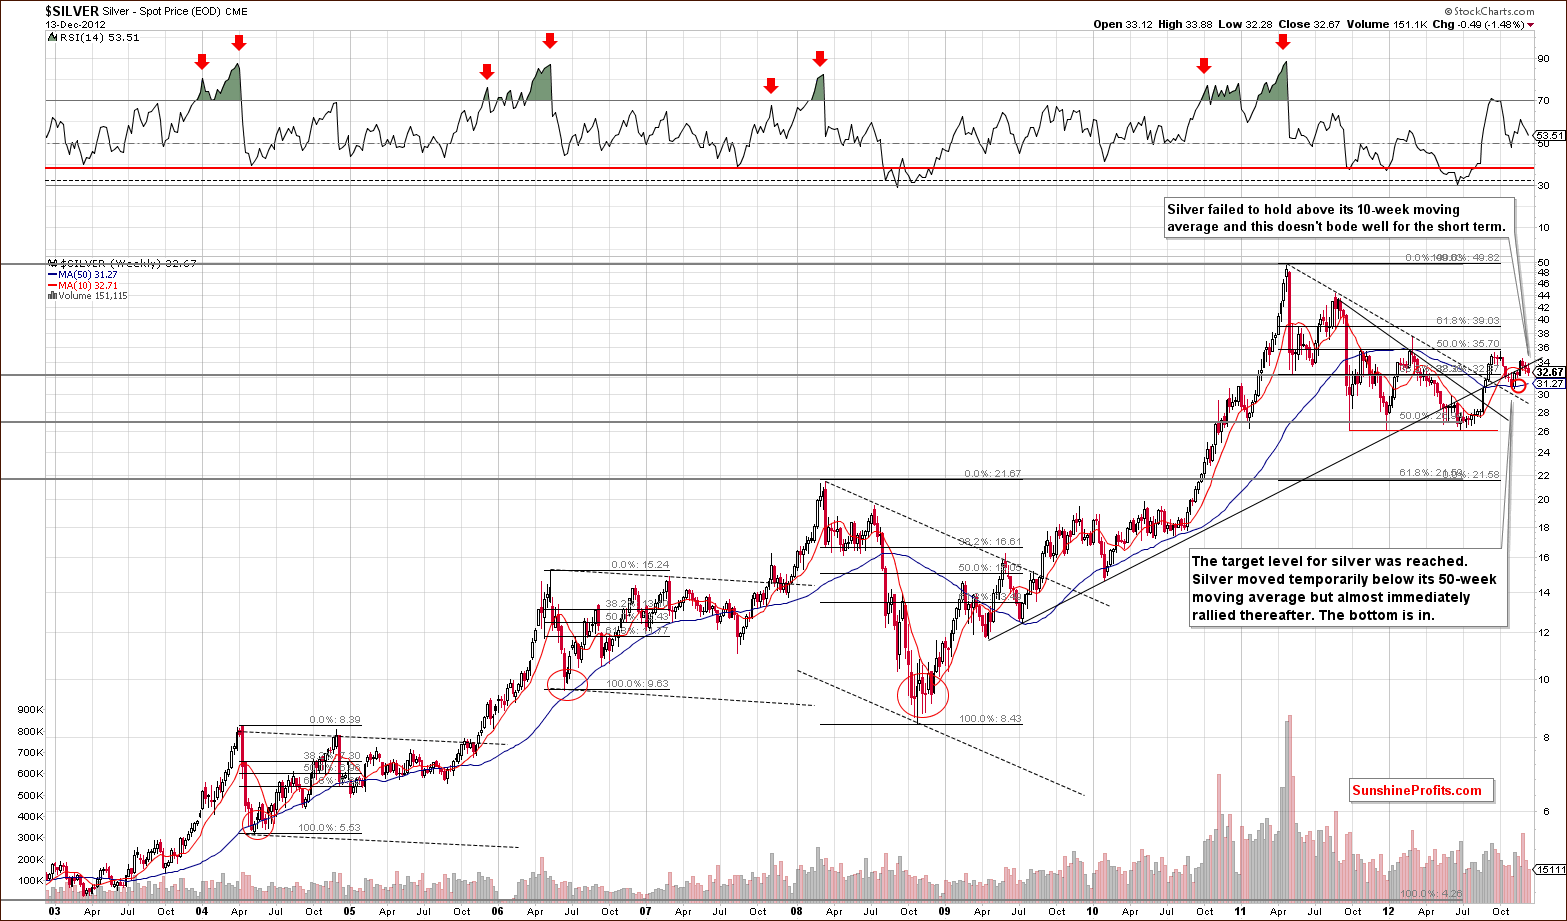
We begin our silver section with a look at silver's long-term chart. We see that prices failed to hold above the 50-day moving average and the rising long-term support line. This is a bearish factor for the short term. It doesn't seem likely that silver will move below its November low (the red ellipse in our chart). More details on this will come in an analysis of the short-term chart.
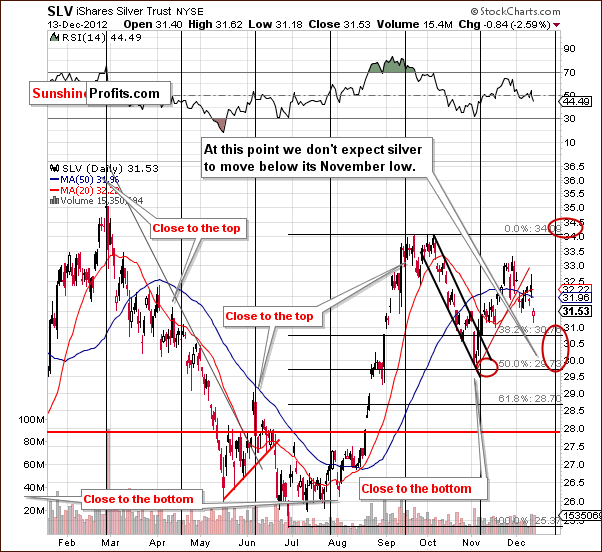
In the short-term SLV ETF chart this week, silver prices declined after verifying the breakdown below the rising support line and the 20-day moving average. Prices could now move down to the 38.2% or 50% Fibonacci retracement level. These are two likely downside price targets that is if the bottom was not reached yet.
Based on these target levels and the upcoming cyclical turning point, we've created two target areas. One is based on a bearish outlook (prices decline in the coming days) and the other, if prices do not decline, would see silver rally to its September-October highs. Even if prices decline initially, it seems likely that they would bottom in 2 weeks and the following rally will bring silver's price back to its September-October highs.
Please note that silver corrected only a part of its November rally and the white metal holds very well relative to gold.
Summing up, the short-term situation is not bullish for silver but the medium- and long-term outlooks are. Prices could decline in the short term but the downside appears limited. The likely upside move is two times greater than the amount of decline which seems probable here.
Palladium
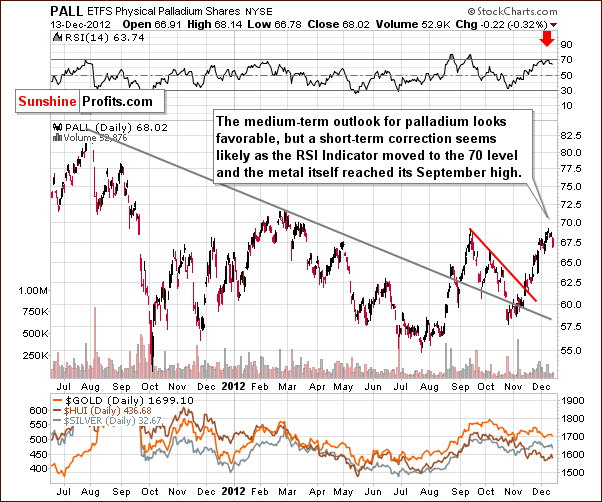
Turning to this week's medium-term palladium chart, we see a slight pause has followed a several weeks long rally. The lower prices have not been enough to cool the enthusiasm which accompanied the rally, however. The RSI barely moved lower after reaching the 70 level.
Perhaps the RSI reaching 70 indicated that a local top has been reached for palladium and the rest of the precious metals sector. This would, of course, provide a bearish short-term outlook. Consequently, palladium seems to have bearish short-term implications for precious metals but bullish for the medium term. Its price has broken above the long-term resistance line and remains well above this price level with no strong resistance lines in place to slow any rally from here.
Gold and Silver Mining Stocks
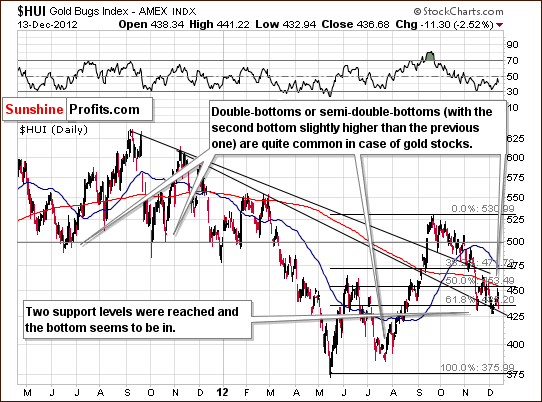
In this week's medium-term HUI Index chart, we see a decline on Thursday but not below the level of the December lows. This seems to be a retest of the declining long-term support line and previous local lows. It could be the case that the miners will not move much lower even if gold declines.
However, if stock prices move lower, which could be the case based on the gravestone doji, lower prices could be seen here, though this does not necessary have to happen. The chart does not suggest it. Keeping in mind that the 30-day correlation between miners and gold stocks is insignificant, it seems that the outlook is somewhat mixed here.
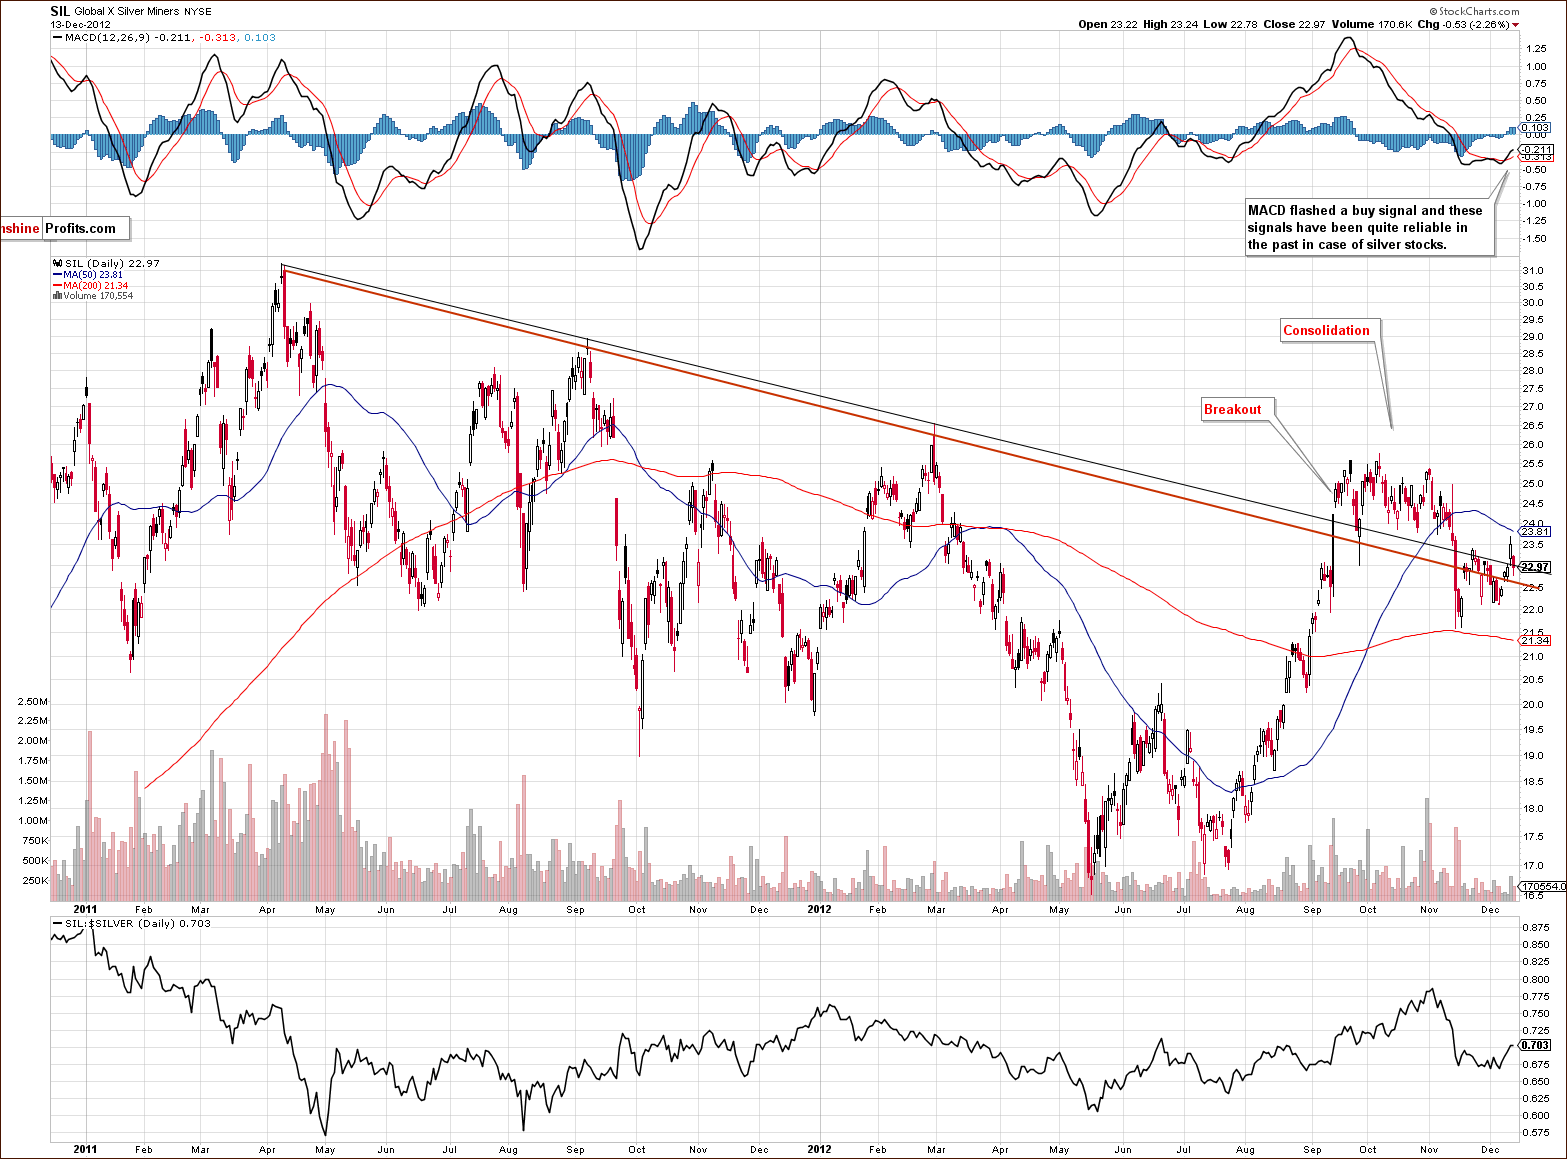
This week we again include the long-term Global X Silver Miners (proxy for silver stocks) chart. The outlook is bullish here as the breakdown below the declining resistance line has been invalidated. Silver stocks are once again above it. More importantly, we saw a buy signal from the MACD indicator, a tool which has been quite reliable for silver stocks in the past.
Based on the SIL ETF, we have bullish implications for silver and other parts of the precious metals sector as well. If you followed our suggestion to invest in silver stocks rather than gold stocks a few weeks ago, you are likely happy with your decision.
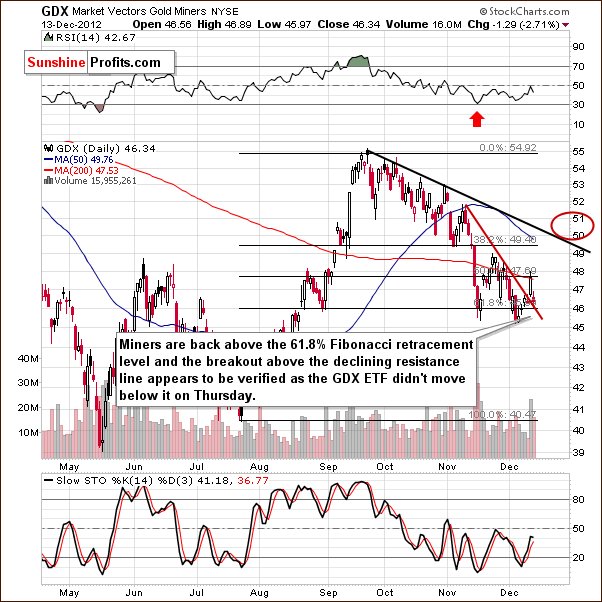
In the GDX ETF short-term chart, the situation is not all that bad. We see a breakout above the short-term declining resistance line which was not invalidated on Thursday, when gold and silver prices declined. The recent huge volume is a bullish factor as well with this rally.
If a rally is seen next, a consolidation slightly above the $50 level seems probable.
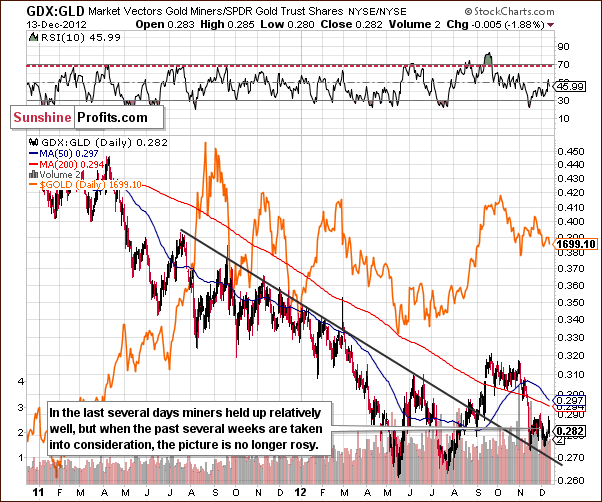
In the miners to gold ratio chart, lower values have been seen recently and the ratio declined on Thursday after an early week rally. Overall, things aren't so bad as the miners are still above the medium-term declining resistance line. This ratio has been declining/consolidating for some time now, so when the rally begins, it could be significant.
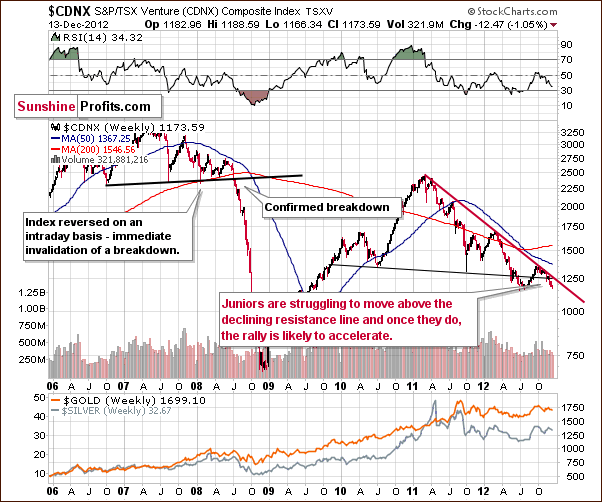
In the Toronto Stock Exchange Venture Index (which is a proxy for the junior miners as so many of them are included in it), the same holds true (concerning an eventual rally) and last week's Premium Update comments are still accurate.
No breakout has been seen above the declining resistance line. The index is now closer to the previous bottom. It appears that once the breakout is confirmed, a huge rally is possible. This current (late 2012) consolidation and price swings will then seem to be quite irrelevant. The downside seems limited by 2012 low, and the upside is significant given an almost 2-year long consolidation.
Even though the TSXV Index moved below the declining support (black) line, it's not really a completion of the head-and-shoulders formation because it has already been invalidated when juniors moved decisively back above it 3 months ago. So, we don't see the situation as bearish based on this formation.
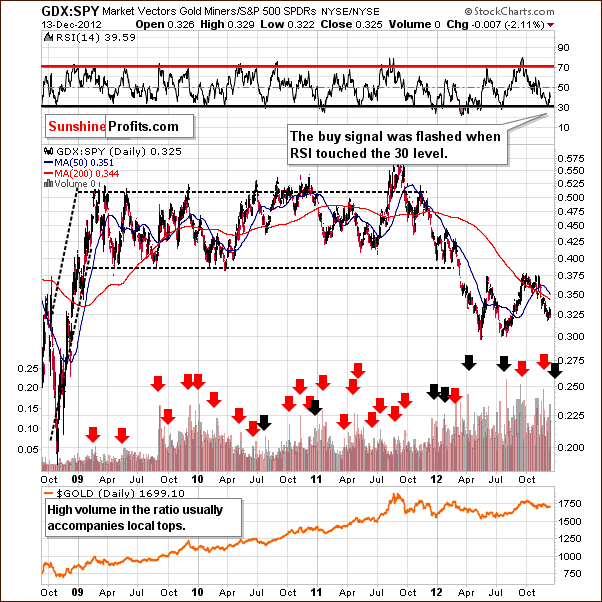
In the GDX:SPY ratio this week, we saw the RSI move to 30 (probably a local bottom) and volume levels significant. Since the RSI suggests a local bottom, the mining stocks are likely to outperform other stocks in the coming weeks. In short, the technical picture for mining stocks is favorable based on this picture.
Summing up, the mining stocks outlook continues to be positive for the medium term. The short term appears somewhat unclear as the next rally will likely be significant but exact timing of when it is to begin is difficult to estimate. Still, there are more bullish factors seen for mining stocks currently than there are for the underlying metals.
Sunshine Profits Indicators
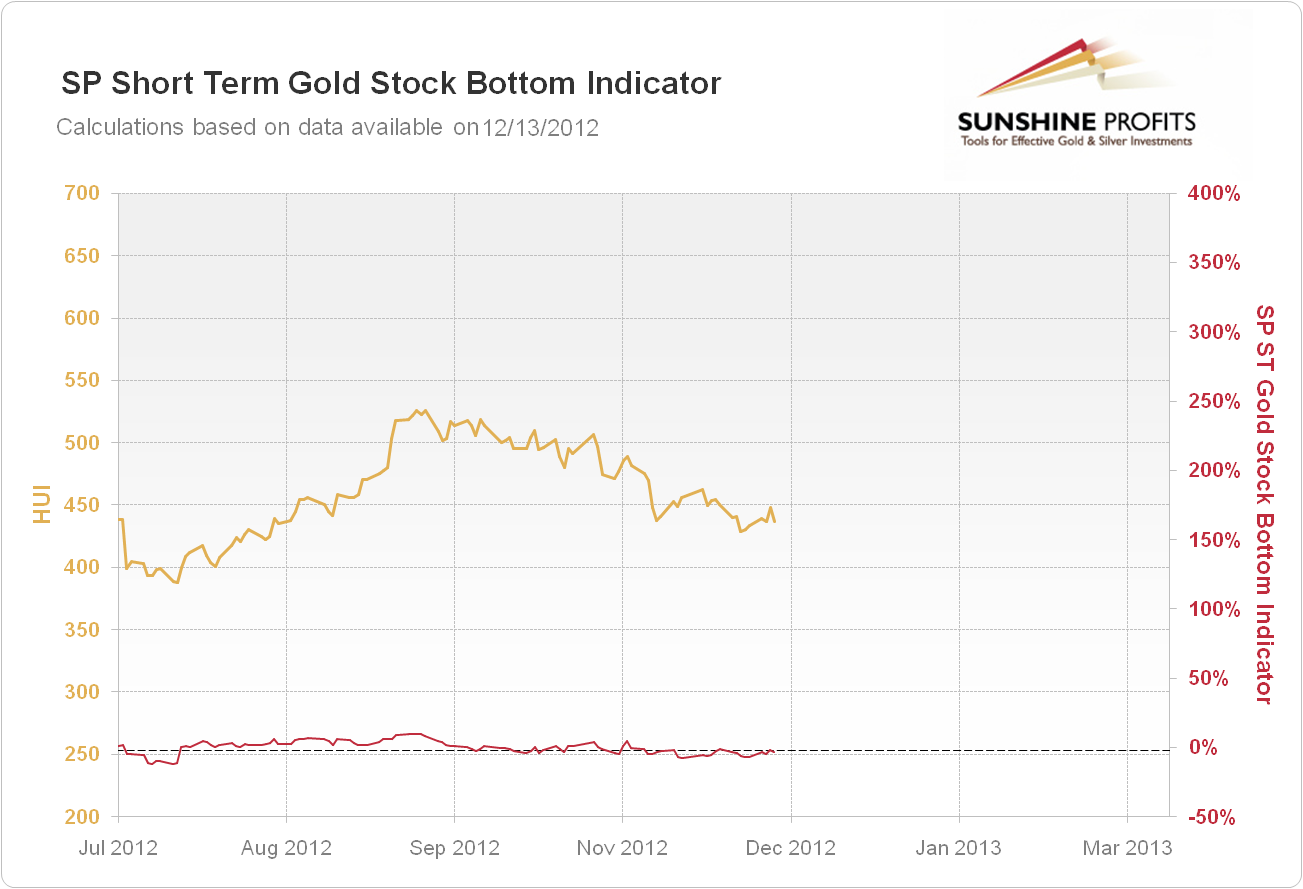
This week we mentioned that the signal from the SP Extreme #2 indicator expired and that another was seen from the SP Short-term Gold Stock Bottom Indicator. Let's take a closer look.
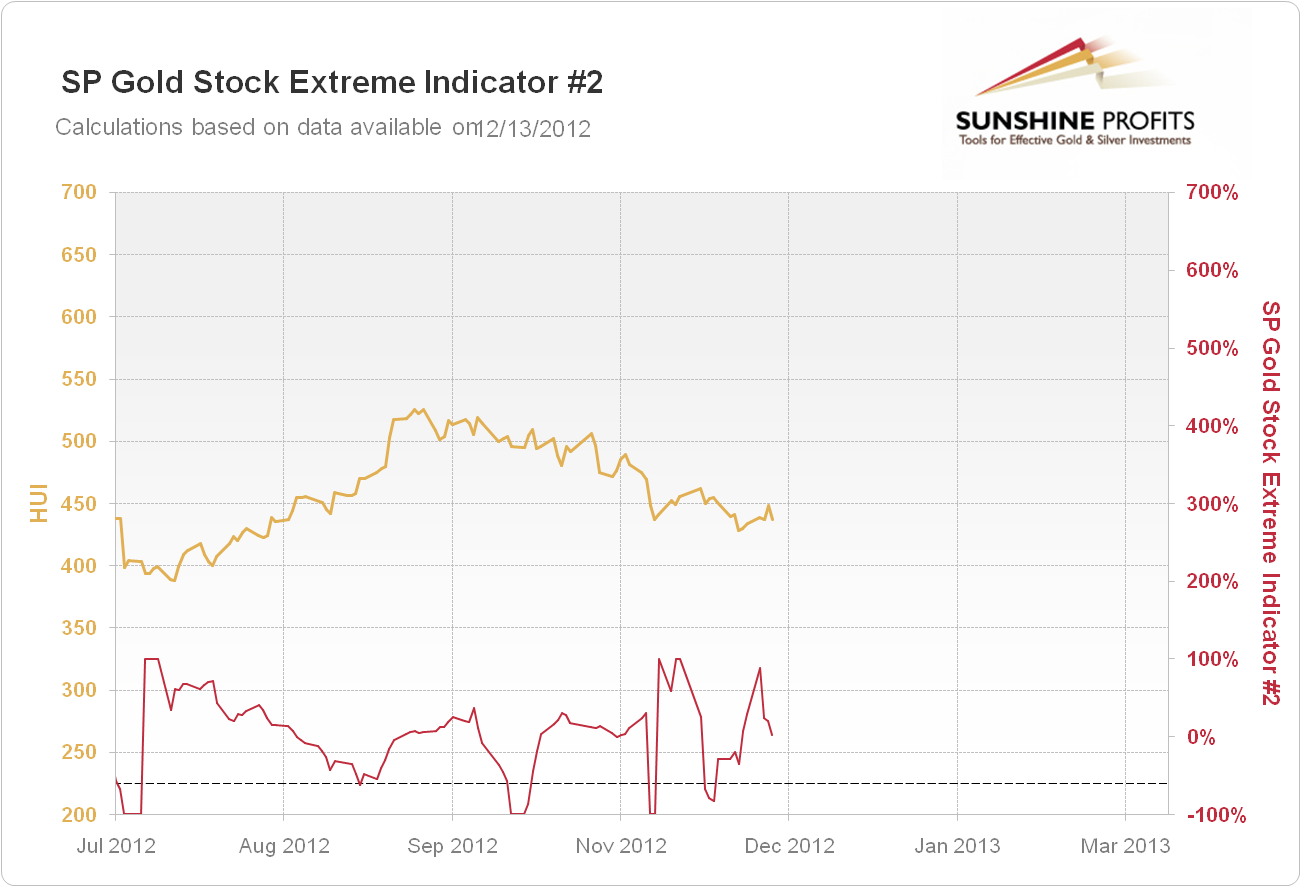
On the first chart you can see that the signals in November have indeed accompanied local bottoms but unfortunately, they were not the final bottoms. Thanks to the automatic protection mechanism the positions (bi-weekly trade in case of this indicator) the long trades were automatically closed – the point is that if the precious metals sector didn't move much higher despite a strong buy signal, then it indicates weakness and it will be better to wait for a better entry point instead of risking lower prices in the short term.
On the second chart, however, we see a buy signal for mining stocks, which – earlier this week – suggested that the situation in the miners is favorable. This signal also accompanied local bottoms previously, which didn't turn out to be the final bottoms. Over time, however, this indicator proved to generate profits so we believe that its latest buy signal for the mining stocks should not be neglected. It may be the case that the final bottom for miners was in, but it doesn't have to. The history suggests, however, that being ready for the rally in the mining stocks currently is a good thing do to with a small part of your speculative capital.
Letters from Subscribers
Q: I am basically coming to the conclusion that the price of gold has been outstripping the fall in the purchasing power of the USD for a while now. The main explanation for this is simply that gold traders are building in a premium into gold prices based on future erosion of the USD as a possible outcome of QE and global major central bank monetary easing i.e. expected inflation. Currently inflation is expected to rise. This has not happened, and interest rates will remain low for at least two years if not longer. Consequently there is no real reason for current gold prices to rise above $1,800--until inflation is confirmed which may take several years. In the meantime, gold will either stay range-bound between $1,700 and $1,800 at best, or could drop much further to $1,530 (especially if the US goes off the fiscal cliff and markets tank). My question is how far could you see gold falling in this "overvalued" context, and how long could it then take before gold prices break out beyond $1,800?
Currently the euro is significantly up against the USD and the USD Index is down. But gold is not rising either as a risk asset or a safe haven. The fear of the consequences of the US falling off the fiscal cliff is outweighing either possibility. So if the US really does go off the fiscal cliff gold prices may have a real problem, especially in an unconfirmed inflationary environment. What do you foresee for gold prices in this eventuality?
A: I am basically coming to the conclusion that the price of gold has been outstripping the fall in the purchasing power of the USD for a while now.
The best way to answer this may be with the chart we published in our essay on gold and the U.S. dollar, which was the second part of our two-part story on gold and the dollar collapse. Please look at the chart from this essay and what we wrote then.
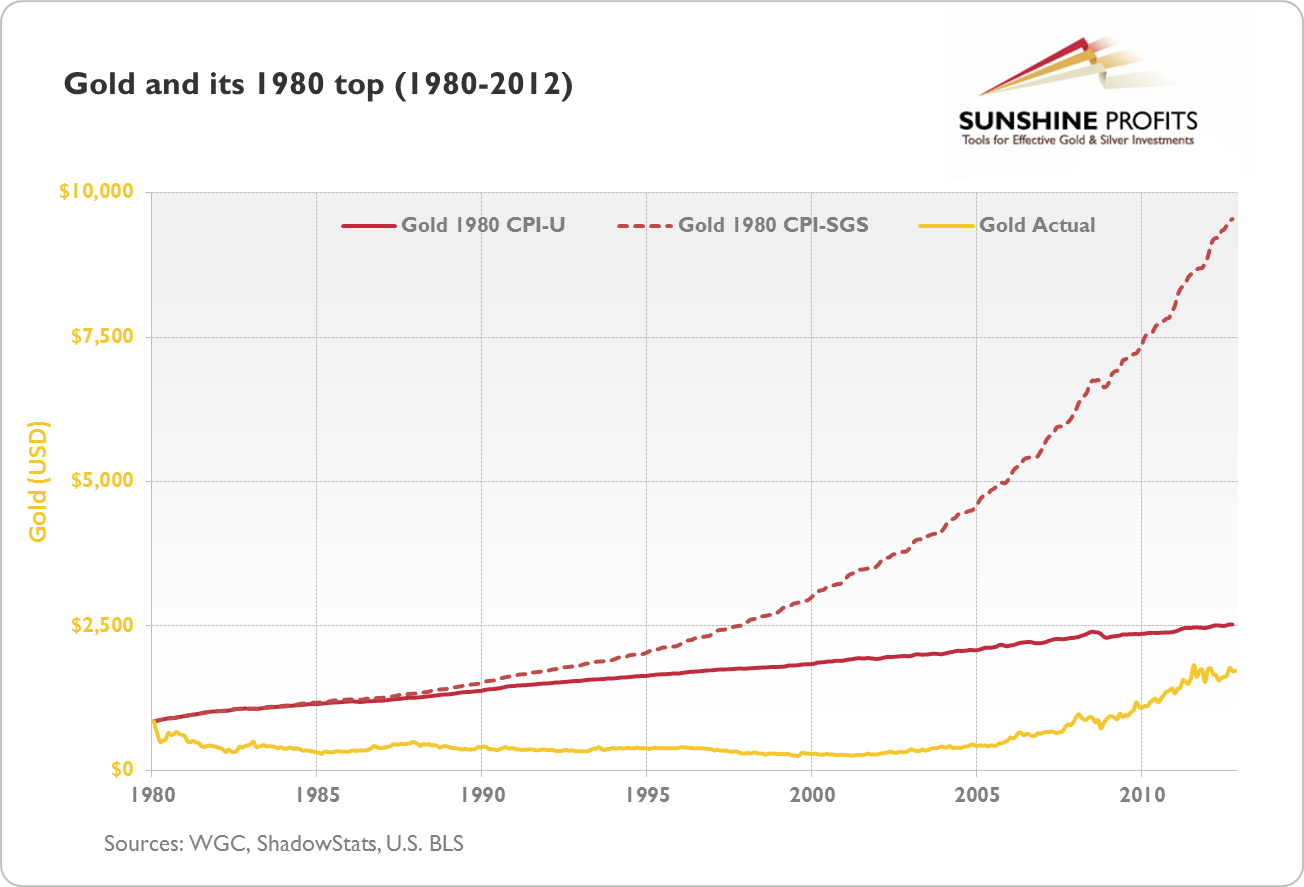
The yellow line represents the price of a troy ounce of gold between 1980 and 2012. The solid red line is the price of gold during the 1980 top ($850) corrected for the official U.S. inflation numbers and the dashed red line is the same price corrected for inflation numbers as they would have been calculated prior to a change in the methodology of inflation calculation (this change actually coincides with the 1980 top). In other words, the solid red line shows you how expensive gold would have to be to buy you the same things it bought in 1980 if you followed official data. The dashed line shows you how expensive gold would have to be if you took into account unofficial data.
As of the end of November 2012, according to official U.S. Bureau of Labor Statistics, gold would have had to trade at $2,527.24 to match the 1980 top. It traded at $1,719.00, which could imply that if the top were to be seen in the nearest future (very unlikely), gold could shoot up by 47.0%.
Taking a look at the unofficial data, gold would have to appreciate to $9,548.34 to be able to buy you the same amount of goods it did in 1980. Compared to the price of $1,719.00 (end of November 2012), this would mean an appreciation of 455.5% (!). The target of $10,000 without the collapse of the dollar seems far-fetched, but even if the unofficial numbers exaggerate the inflation, and the latter has been so far somewhere between the official and unofficial numbers, this would mean a possible price for gold beyond $2,500.
Long story short: if gold were to match the price from the 1980 top in real terms today (using the official inflation numbers), it would have to trade at more than $2,500. So, based on inflation, we don’t see a strong case for gold to go lower. In fact, if there is any case, it is for gold to go up. Please note that the long-term trend for gold is up.
As for measuring the price of gold in terms of monetary aggregates: please note that the mere fact that there is more and more of the US dollar circulating in the economy does not mean that that money will ever be redeemed in gold. That could be the case, but it doesn't have to. To refer to your $1,530-$1,800 target price for gold we would have to know your methodology and assumptions. However, we have done research on the possible price of gold in terms of U.S. debt under the assumption that some kind of gold standard similar to the Bretton Woods agreement would be reinstated. You can find these results in the first part of our article on gold and the dollar collapse. In short, if our assumptions were met, gold could go up to the level of $6,200.
Obviously, the $2,500-$6,200 (or even $10,000) range is just an indication that, looking at gold from two different angles (the dollar collapsing and not) yields the same result: that the fundamentals for the yellow metal are still in place.
(…) traders in the gold market are building a premium into gold prices based on the future erosion of the USD as a possible outcome of QE, and global major central bank monetary easing i.e. expected inflation.
The collapse of the dollar is no sure bet. For instance, currencies could be inflated at the same time so they would decline in value and inflation would soar, but the currency exchange rates wouldn't be severely impacted. Consequently, we don't think that this is really discounted in the price of gold. Another point here is that, in practice, inflation expectations are very much adaptive. The factor that determines future inflation expectations the most is the current inflation level. In times of low inflation most of the market players don’t expect inflation to rise. In times of high inflation, average expectations are high as well. Taking that into account suggests that, in fact, possible future inflation has not yet been discounted in the price of gold. So, our idea is instead that if inflation rises in the future, it could only be discounted in the price of gold around the time inflation takes off (and – let's face it – the vast majority of investors use the official inflation numbers). Consequently, gold could go higher.
So if the US really does go off the fiscal cliff gold prices may have a real problem, especially in an unconfirmed inflationary environment. What do you foresee for gold prices in this eventuality?
We don't think that the US will really go off the fiscal cliff – we expect the problem to be solved just like it was solved many times in earlier years – through printing more money. As always, there might be some indications as to what might happen if the U.S. economy finds itself in much more trouble than what we've seen so far. We would focus on two broad scenarios:
Stock indices plummet but investors are still confident that the U.S. will manage to deal with its problems.
The same as above but the investors ditch bonds and “run for it.”
The first case could be in fact similar to what we saw in 2008 but on a larger scale. Investors could be selling off “everything” just to switch to U.S. bonds. Gold could correct significantly in the short-term but rebound and shoot up in the long-term.
The second case would see investors storming to buy Swiss francs and gold. In this scenario, there needn't be any significant decline in the price of gold. Conversely, gold could strongly appreciate even in the short-term.
In either case, gold could be a great long-term investment. If it declined initially, this could be an extraordinary buying opportunity. If it didn't, there could be significant short-term gains.
Q: I had a precious metals IRA worth about $60,000 as part of my portfolio. The balance of our savings is insured variable annuities. My financial advisor convinced me to rollover the holdings in the precious metal ROTH and invest the money in a Large Cap Fund. It is insured, but not doing well and I wish I had kept it in the precious metal ROTH IRA. That money is now tied up but I did rollover a small IRA from that firm to Fidelity and have it invested 100% in gold and silver ETFs. They seem to provide the benefits of holding physical metal without the costs and hassle. At first glance I did not see Gold (IAU) and Silver ETFs (SLV) that are 100% backed by physical metal, mentioned in your article.
What are your thoughts on holding these ETFs versus physical metal in a depository? I also have two gold coin collections that I want to sell to buy bullion for possession, but now is not the time to be selling perfect 70 numismatic coins. If I can find a broker offering a fair price for these coins, I will be willing to make a trade for a bullion purchase, but the firms I have contacted have offered spot price for PFUC 70 Eagles and Buffaloes toward the purchase of bullion on which they also make a commission. I would rather hold bullion bars than numismatic coins, and I would like to arrange such a trade. Any suggestions?
A: As far as ETFs versus physical metals are concerned, it all boils down to the part of your portfolio that these metals are in. If you intend to use them for short-term trades (lasting two weeks for example) and you have additional precious metal holdings that are allocated in physical form, you should be fine with ETFs here. In other cases, physical metal is preferred even though it can be less convenient. You will find more details about this in our How to Buy Gold ranking, Gold Portfolio Report and the report on physical gold.
With regard to the transaction that you plan to make with your numismatic coins - we agree that bullion coins should give you bigger upside potential given the coming rally in the price of gold. It might be a good idea to try selling them to individuals instead of brokers if the latter don't give you a satisfactory price. Some investors have successfully used eBay and similar services.
Q: I'd like to hear his explanation of where security lies in holding ETFs. I hear they are in trusts, but why should anyone be trusted now? I certainly don't trust his overseas bullion vaults.
A. We have never expressed a view that ETFs are secure (as far as holding metals for the long run is concerned). If you refer to our How to Buy Gold and Silver section, you'll unmistakably find two points among the cons of holding ETFs:
- The risk of having insufficient backing by gold
- Fund bankruptcy risk
Precisely because of these points, we give ETFs 3 out of 5 stars in the investment category. In the long run, the risk of ETFs going bankrupt and leaving you with nothing but paper and promises is NOT negligible. We've never, and still don't advocate using ETFs as long-term investments. They are better than some other ways, but their main advantage is how easy it is to trade the market using them.
In fact, in the trading category, we give ETFs full marks. They are a cost-effective vehicle for short-term trades. It's hardly conceivable that you would be able to take advantage of short-lived upswings or downswings by immediately buying or selling physical metals because of the transaction costs and time involved. So, while we think that your insurance and long-term investment capital is best covered by physical gold, we are of a view that for short-term trading ETFs or ETNs are one of the best ways to go.
Let's take a closer look at the following two facts:
- You should trade only with money you can afford to lose.
- Trades are usually short-lived.
Since the risk of your counterparty going bankrupt during a short-lived trade is much smaller than in the long run and you only speculate with the capital you can loose and use only small parts of that capital for a given trade, the risk of the fund defaulting is offset by the favorable characteristics of ETFs. Once again, this is only about trading and NOT about long-term investments. For more info on how we exactly suggest to structure your portfolio and which instruments are appropriate for long-term investments and which for trading, please refer to our essay on gold and silver portfolio structure.
Finally, not using overseas vaults at all, is not such a good idea, because you miss out on the benefits of geographical diversification. Holding on to physical gold as insurance is crucial, but only when it comes along with diversification. It's true that you can only feel the gold that's within your eyesight but holding all of your gold at home or near the place you live in may be a bad idea. First of all, despite your best efforts, you can always get robbed. Secondly, what if your country introduced some kind of capital controls and prohibits the possession of gold? People would always find a way to get around and buy and sell gold but this would entail a lot of stress and illegal activity. Breaking the law is not the way to go. Holding part of your physical gold and silver abroad in several different countries can help you avoid such a scenario. Even if a given government imposed a ban on gold, you'd still be covered by physical holdings abroad. Now, the probability of all these countries introducing unfavorable regulation on gold and silver is certainly lower. To end in a little bit lighter tone: could you imagine Switzerland imposing regulation preventing you from accessing your capital in one of its banks? As a matter of fact, they may even go the other way around.
Summary
The medium-term and long-term picture for the USD Index is bearish although the short term is unclear. Stocks have a short-term bearish outlook but the downside is limited. Both the medium and long-term perspectives are bullish. This is not due to an improvement in US economic indicators, however, but rather due to the steps taken by the Fed, which are likely to push nominal stock prices higher.
This does not directly translate to any precious metals price moves in the short term, since correlations are quite insignificant with both markets over the past 30 days. The analysis of gold priced in euro indicates that the period of negative or no correlation between precious metals the dollar could be coming to an end. This is not a sure bet, however, and we prefer to wait for either downside target levels to be reached or proof that the negative relationship between the dollar and metals prices is clearly in place once again before suggesting going back on the long side of the market with the trading capital.
The technical picture for gold is mixed for the short term and bullish for the medium and long term. The same holds true for silver. The outlook for mining stocks is more positive than gold's or silver's. We don't feel that a bet on higher mining stock prices is a good idea at this time because of the unclear situation in gold, silver and the bearish short-term outlook for the general stock market.
Trading – PR: No position
Trading – SP Indicators: Long position in mining stocks with an additional weekly trade in mind (unless another buy signal is seen in the coming week that is)
If you have joined us recently and are not sure why we provide two categories of trading signals, please examine the reply that we provided on this topic several weeks ago. You can access it here.
Long-term investments: Remain in the market with your precious metals holdings
| Portfolio's Part | Position |
|---|---|
| Trading: Mining stocks | Long (half) |
| Trading: Gold | No position |
| Trading: Silver | No position |
| Long-term investments | Long |
As we like to over-deliver in our promises, we decided to keep sending you Market Alerts on daily basis at least until the end of December with the exception of Fridays, when Premium Updates are posted (we will issue an alert if what we wrote in the update becomes outdated on the same day it is posted, though).
This completes this week's Premium Update. Our next Premium Update is scheduled for December 21, 2012.
Thank you for using the Premium Service. Have a profitable week and a great weekend!
Sincerely,
Przemyslaw Radomski, CFA

