
There was hype and hope in the financial markets this week when results of the much anticipated bank stress test were revealed. Just as I had suggested a week ago, the results were better than expected. The federal government announced essentially that 10 large banks will need to raise about $75 billion in additional capital - a substantial sum under any circumstances - but less than many investors had expected.
In one of the essays posted on Yahoo! we can read the following:
U.S. regulators told 10 of the biggest U.S. banks late on Thursday to raise a total of $74.6 billion, which was less than investors once feared and helped lift European and U.S. bank shares on Friday.
It seems to me that Friday's move was not significant enough to attribute directly to the news of the stress test results. I wrote last week that the key factor will be how the market will perceive these reports. Now we know that the tests did not come as a shock to the market, and in fact, their influence is barely visible in the charts. The significant point is that these tests turned out to be a tempest in a teapot. Their release did not change the fundamentals nor the technical picture as far as the general stock market is concerned. There has been a noticeable effort by U.S. government officials to convey confidence and calm. Consumers, investors and businesses are being lulled by a sense of stability. The financial markets may be reflecting too much optimism and if confidence falls again, it will be that much more difficult to restore. With the Obama honeymoon coming to an end, it will be interesting to see how the markets move without government influence. Before I turn to my regular analysis, I would like to comment on one of the articles on the stress test that I read on Yahoo!.
So while others are celebrating the end of the crisis, ask yourself this: If the government sees up to $599 billion in additional bank losses, why are they requiring banks "only" raise $75 billion? That suggests the government thinks the banking sector is overcapitalized by $525 billion.
This is not the case. Usually I don't like to debate semantics, however, this time it is important. The key here is how we define "overcapitalized". The Wiktionary defines it as "having excess capital". It further defines "excess" as "the state of surpassing or going beyond limits; the being of a measure beyond sufficiency, necessity".
Let me expound on the phrase "beyond sufficiency, necessity". When does a company have sufficient amount of capital? When it doesn't bankrupt? No. The company's ultimate goal (!) is to create value for its shareholders. Avoiding bankruptcy is not enough. The amount of capital needed to achieve the goal of creating value for shareholders is much higher than the capital needed to just stay afloat. Companies (banks also fall into this category) should continue to increase their capital as long as they can provide shareholders with the rate of return higher that they expect (the risk-free rate of return + the premium for the risk associated with investing in stocks). Shareholders want the company to create value for them. For the company just to survive is not enough.
There is a world of difference between having enough money not to go bankrupt, and having the optimum amount of money that will create the highest rate of return for shareholders. We need to keep in mind that the government's goal with these stress tests is not to make sure that bank shareholders get the most value out of their investments. The federal government's narrower goal is to make sure that banks have sufficient reserves to weather the recession and stay solvent without dragging the financial system into further decline.
So, the bottom line here is that the government wants banks to increase their reserves to ensure solvency, but not to increase banks' profits. Therefore, talking about $525 billion over capitalization is an overstatement.
Moving on to the technical side of the market, the last week was the week of initial breakouts, which have not yet been confirmed. Let's begin with the general stock market. Charts are courtesy of stockcharts.com.
The General Stock Market
During normal conditions, one has a good understanding on expectations of how markets relate to each other and how one market might respond to certain conditions relative to another, or how one market may impact another. Armed with this important information, a person can build a diversified portfolio that can offer some protection against weaknesses in individual markets or stocks. However, in times of crisis, these historical relationships can go out of kilter. That is why now it is more important than ever to monitor the markets and report back to you. We cannot be lulled into a sense of complacency. It is also important to ignore market noise, but that comes with experience. Seasoned traders can do it better than novices because they can better pick up the signal from all the noise. So, let's see if we can focus on this week's signals after filtering out the noise.
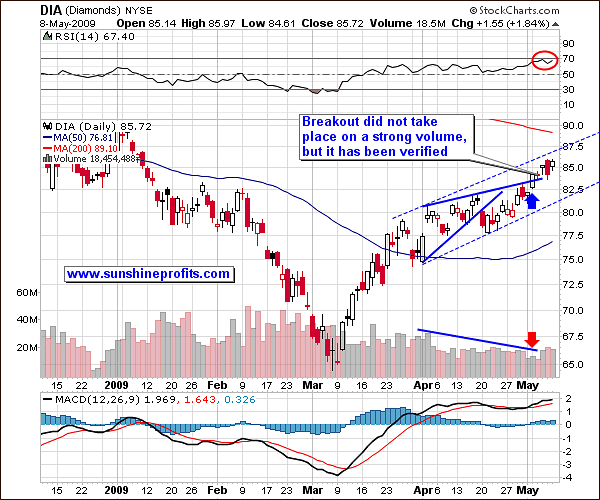
Last week I reported that the chart for the DIA (the ETF that tracks the Dow Jones Industrial Average and allows me to analyze volume) was rather bearish as the value of the DJIA rose on declining volume. This Monday it broke out, but again on very low volume. This suggests that this may not be a break-out, but a fake-out. If the same had happened on high volume, I would look at it differently. The action in the following days, Wednesday, Thursday and Friday, took place on much stronger volume, but overall the volume was still too low to make this breakout significant.
On the other hand, the previous resistance line has been verified as a support level. So - the signals here are mixed. The most probable outcome seems to be a small rise (to the dashed resistance line) that will be followed by a more sizable correction.
We need to look at the broad market to get more clues to the big picture.
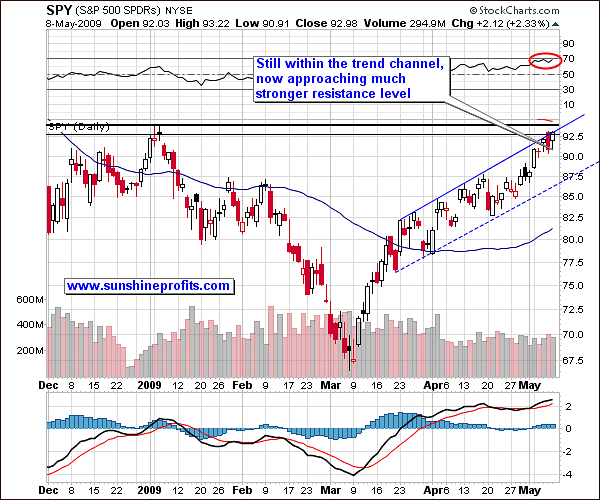
Signals from the broad market are usually more meaningful as they are a better proxy for the whole market and not just for the Blue-Chips. If we look at the SPY chart, (the ETF that tracks the S&P 500) we see that we are testing one resistance level and are just approaching a much stronger one. This foreshadows a pullback.
The only issue that concerns me with this analysis is that the bullish case hasn't been fully played out in the media, leaving room for additional upside. I constantly read the financial news in print and the Internet and I haven't seen too much bullish commentary. This paucity of bullish sentiment, however, is not in itself a necessary condition for a top to form.
As I mentioned last week, the USD Index is once again more important short-term factor for the short-term moves in the price of gold, than the general stock market is. This week, we have witnessed a particularly interesting development on the dollar market.
USD Index
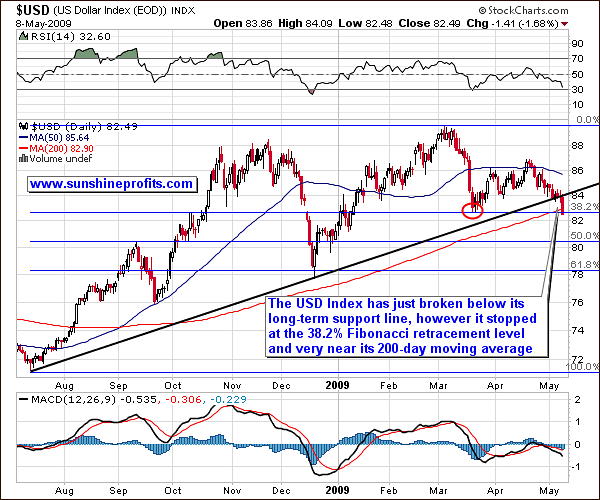
The dollar whipsawed against the major currencies in early Friday trading following a key US labor report that many traders saw as a sign that the relentless pace of job losses was beginning to level off slightly. In the midst of all the grim unemployment news, some economists saw glimpses of a bottom in the latest dour news of job losses. Naturally, there might have been other, psychological reasons, but the bottom line is, that the long-term trend line has been broken.
A look at the US dollar index indicates that although a sell-off is more likely than it was a week ago, it is still not a forgone conclusion. There is no verification until we see the price close below the previous support line for three consecutive days, or a bounce to the support line touching it, and then declining again. We will need to wait for additional confirmation.
Dollar has just declined sizably, which contributed to a rise in the value of the precious metals. Please take a look at the following charts for more details.
Gold
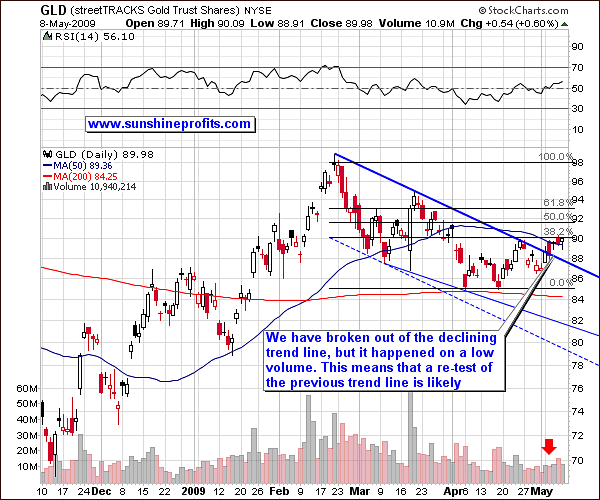
A look at the Gold chart shows that should the previous trend line hold - this could provide us with a chance to close short positions and open long positions in this sector. Gold prices are likely to retreat in a few days, but then rally to more robust levels. This could correspond to a similar test of the USD market. Higher gold prices are i.a. a result of the debasement of paper currencies happening all over the world. We all know there is no such thing as a free lunch. Nearly every federal government in the world is printing money as if the world is about to run out of paper.
Silver
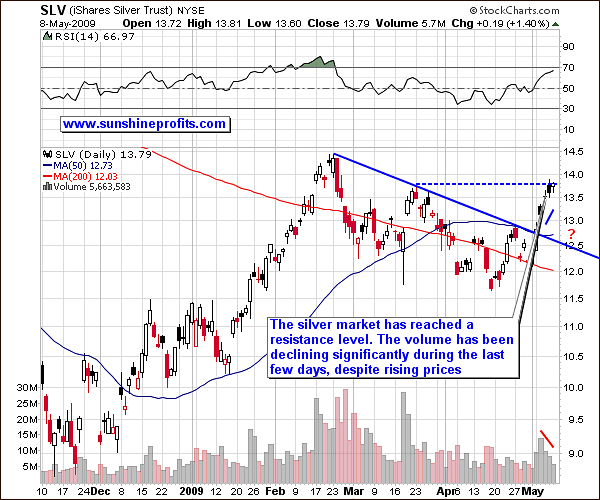
The silver market rallied strongly in the past week, but is now more vulnerable to a correction. Notice here that volume declined significantly in the last few days, a bearish sign. A swift decline to 12.5 is not out of the question.
Precious Metals Stocks
As I have already emphasized in the past, in order to fully understand the price action on the precious metals market, it is usually best to analyze metals along with corresponding stocks. This week has been positive for both metals and mining stocks, but the latter seem to have created a bearish formation, which makes me concerned about the overall significance of the abovementioned breakout. For more details, please take a look at the following chart.
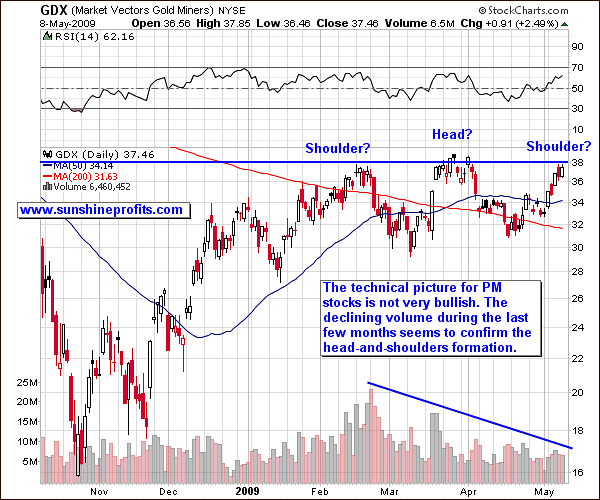
The GDX (Market Vector Gold Miners) shows what could become in the coming weeks a classic "head and shoulders" pattern, one of the most common reversal formations. It is important to remember that it occurs after an upend and when complete, it usually marks a major trend reversal. The formation in the GDX is not very bullish. In fact, it is bearish in the short term. Since the formation is not complete, (it's still missing the rest of the right shoulder) we will have to wait for it to unfold. I find it ironic that just a week ago I wrote about gold in the opposite formation, a reverse head-and-shoulder - which is a bullish formation
Summary
In the short term, there is nothing to do but to take a wait-and-see attitude. It is difficult to say what may happen this week. Although gold, silver and the USD have just broken out, these breakouts have not yet been verified. We will know more once they are verified, or if we get below or above previous trend lines. Volume is a major factor here, so it's difficult to say in advance what may happen this week.
As far as the long term is concerned - there are no changes here. We remain invested after my suggestion to complete long-term purchases near the April bottom. Please note silver's strong performance since I wrote about it being in particularly favorable long-term situation in the April 19th Premium Update.
Short-term speculation - as far as closing last week's positions is concerned, much depends on how the general stock market and USD Index will perform in the coming days. Should USD, gold and silver test their previous trend lines and the general stock market consolidate, we should have an opportunity to switch to the long side of the precious metals market. On the other hand, should the abovementioned asset classes return below/above their recent trend lines on a strong volume, I will most likely keep my short position. I will be monitoring the markets with diligence and I will keep you updated. In the meantime, I would like to wish a Happy Mother's Day to all my Readers, who celebrate the holiday.
Other information
I am happy to announce that we have just added an additional feature to our Tools section that will help you in your investing strategies. With this tool you can check what are the key markets that may have the biggest influence on the sector that you are interested in (metals, PM stocks, juniors) in coming days/weeks/months. It should prove particularly useful in detecting the catalyst for either breakout or breakdown, which consequently should increase the odds of making the correct decision regarding your portfolio. The Correlation Matrix is based on something I had written about in the previous Premium Update, but we have expanded it by adding juniors (CDNX) and two additional time-frames (3 years and 6 years). Here is how it looks like now.
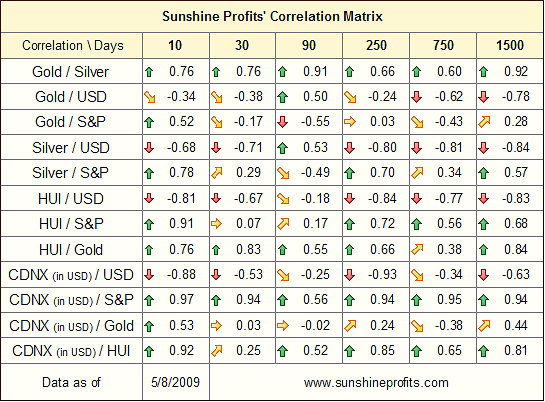
This table is updated on a daily basis should you wish to use it in your trading strategies. We suggest taking a few moments to study it, as it may prove valuable.
This completes this week's Premium Update. Thank you for using the Premium Service. Have a great weekend!
Sincerely,
Przemyslaw Radomski

