
- Euro & USD Indices
- General Stock Market
- Correlation Matrix
- Gold
- Silver
- Mining Stocks
- Junior Mining Stocks Ranking
- Letters from Subscribers
- US non-farm employment rate
- Keep some money in cash
- In case the dollar collapses
- Summary
Gold fell more than 1 percent on Tuesday hitting its lowest price in nearly a month. On November 28th we had cautioned in a Market Alert to place a stop loss order to protect against the weakness we detected in the market. Tuesday, after gold price moved below our stop-loss level, we suggested closing half of the speculative long position in gold. We believe that trading capital (as opposed to long-term investments and insurance capital) should be split between a part dedicated to our subjective analysis and the other half to objective signals from the SP Indicators. We have just seen a buy signal from the SP Extreme #2 Indicator which suggests being long for two weeks without placing a stop-loss order for this trade, hence the suggestion to keep half. Although we expect to send out a "get back to full long position" alert soon, for now we believe in playing it safe with trading capital and keeping intact the long-term investments in the precious metals. Despite the falling prices, through Thursday’s close, gold was still up 8% for the year 2012, on track for a 12th consecutive annual gain.
The truth is that most investors, despite all the hype about gold, still don’t know how to buy physical gold, where to store it and how to sell it. It is much simpler and easier for the average investor to buy and sell the precious metals ETFs. Despite the seismic economic shocks and looming fiscal cliffs, most investors are still clueless about physical gold, which in our opinion is the best way to go since there is no counter party risk. If you want to know more about this subject, please read our report about physical gold and check out the section.
Take the case of a friend who is a real estate developer with large development projects in Poland, Hungary, Germany and Spain. He numbers among his friends some very savvy people in the top economic echelon. He is well read and knowledgeable about politics, economics and just about everything else. About four years when the topic of gold came up he smirked.
“None of my friends are invested in gold,” he said, that being the ultimate proof that gold is nice as jewelry for the wife, but not as an investment.
We met a week ago at a social event.
“So, what about gold?” he was asked.
“I now have 3% of my portfolio invested in gold,” he said sheepishly.
“Physical gold?”
“No, the ETFs,” he said. “Where can one buy physical gold?” he asked.
We don’t hear much about gold and silver anymore on the news. It wasn’t that long ago that there was constant chatter about the yellow metal on TV and radio. We take this as a good sign. Gold has been trading sideways and that shakes the weaker hands out of the game.
Buyers are supposedly waiting on the sidelines because of uncertainty over the “fiscal cliff" - $600 billion in tax hikes and spending cuts that are due to kick in the New Year. Republicans and Democrats dug in on talks Wednesday, with both sides urging quick action but offering no compromises. They seem to be playing “chicken” in a political stare-down that shows no signs of breaking. On Wednesday, President Barack Obama rejected a nascent Republican plan that would have extended the bitter fight over the fiscal cliff into next year.
Some pundits say the fiscal cliff problem will cause the price of gold to soar and there are those who claim the opposite. The arguments go like this. Going over the fiscal cliff will probably send an earthquake through the markets causing fear which could drive investors into gold as a safe haven. In addition, it will weaken the U.S. dollar which is likely to strengthen gold. If politicians are able to avert going over the cliff, markets will continue to focus on the QE Ponzi scheme, the debasement of the dollar and the inevitable inflation, all bullish for gold.
On the other side of the fence are those who say that going over the fiscal cliff will be bad for gold. The U.S. will go into a recession and gold will stumble along with everything else. Not going over the cliff could renew bullish sentiment for equities and decrease the appetite for gold.
Indians Keep Loving Gold
The Indians like physical gold. India's deep cultural love affair with gold jewelry is still going strong despite the high prices and the Indian government’s intent to curb sales of the precious metal. With the wedding season in full swing and extending well into the new year, there is no slump in the sales of gold. Celebrating an Indian wedding without gold jewelry is unheard of to the point of being sacrilege. In the quarter that ended September 2012, Indians bought $7.2 billion worth of jewelry as opposed to 91 million invested in gold exchange traded funds.
The Koreans Are Loving It Too
South Korea’s central bank said Wednesday it bought 14 tons of gold in November using its foreign reserves in order to spread its portfolio risks. This follows a trend of Central banks being net buyers of gold rather than net sellers. Most of the gold acquisitions have been made by banks in Asiaand the developing nations which want to catch up to the type of reserves held by developed countries. Central banks buying accounted for 455 tons of demand last year. Since gold accounts for just 1.2 percent of South Korea’s currency reserves, the Bank of Koreacan also be expected to buy more gold in future.
Goldman Sachs Cuts its Gold Forecast
Goldman Sachs cut its 2013 gold forecasts on Wednesday. The firm said gold's current price cycle will likely turn next year due to an anticipated rise in real interest rates on the back of improved growth. Goldman cut its three, six and 12-month forecasts for gold prices - to $1,825 an ounce, $1,805 an ounce and $1,800 an ounce respectively. It also introduced a 2014 forecast of $1,750 an ounce, suggesting price growth could tail off.
Goldman Sachs is making a lot of assumptions. They are assuming the economy will improve and that interest rates will rise and that the rise in interest rates will stop gold. So who do we believe, Goldman Sachs or the South Korean Central Bank that just put its money where its mouth is?
Please keep in mind that in the previous great bull market of the 70s, interest rates simply followed gold higher. In any case, we doubt the rates will really rise anytime soon.
Goldman’s analysts also cover their bets and say that "Under a weaker U.S. growth outlook, gold prices will likely trend higher, reaching $1,900 an ounce by the end of 2013." So, GS is saying that the fiscal cliff is actually a good thing for gold.
Our best bet is that gold will rally strongly in 2013, perhaps topping close to the $2,500 level. Let’s first see what it will do in the upcoming week, so let’s begin this week's technical part with the analysis of the long-term Euro Index chart (charts courtesy by http://stockcharts.com.)
Euro & USD Indices
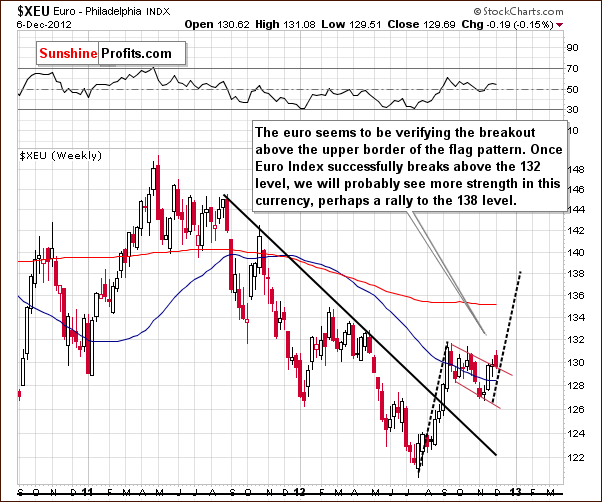
We begin this week with a look at the long-term Euro Index chart. Last week we wrote about a flag pattern and this week we’ve seen a breakout and a pullback to the previously broken upper border of the flag pattern. Right now, the situation looks a bit more bullish than not. It will become clearly bullish for the coming weeks if we see a confirmed breakout above 132, the price level of the September high.
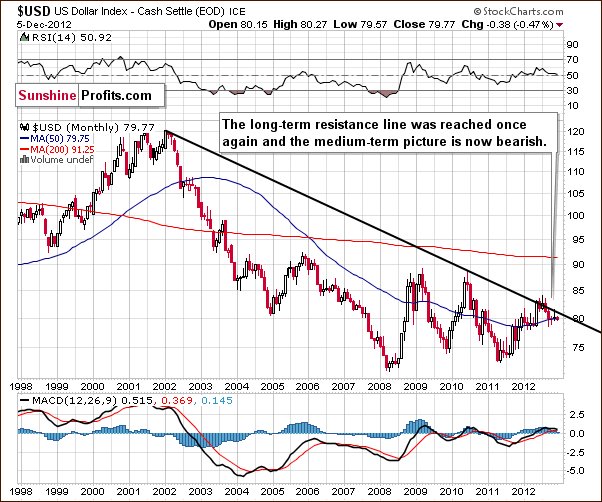
Turning now to the USD Index charts, we first look at the very long-term perspective. Based on the Euro Index analysis, we expect the USD Index outlook to be bearish and this chart confirms this. Little has changed this week and comments made in last week’s Premium Updateremain up-to-date:
Lower values are a clear possibility here, and a recent attempt to move above the long-term rising resistance line failed.
The trend will remain down even if the USD Index moves to the last Fibonacci retracement level (around 82). With a cyclical turning point fast approaching, the Index is more likely than not to move lower from here from a technical perspective.
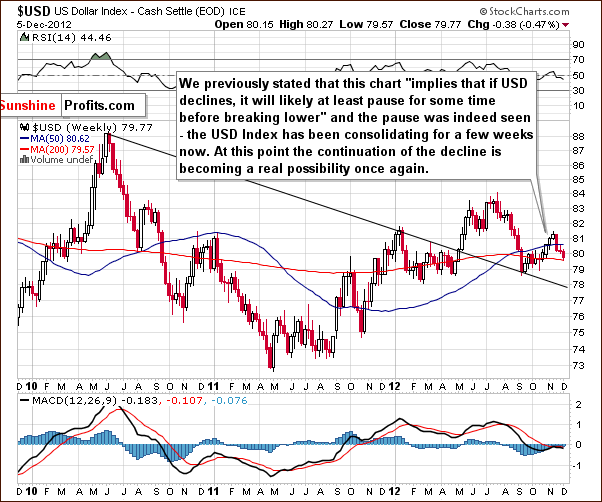
Turning now to the medium-term USD Index chart, virtually nothing has changed this week. Again, what was stated in last week’s Premium Update is still up-to-date:
A consolidation has been ongoing for over a month, and the index now appears ready to move lower. The decline and consolidation here are a reflection of the upswing and consolidation seen recently in the Euro Index.
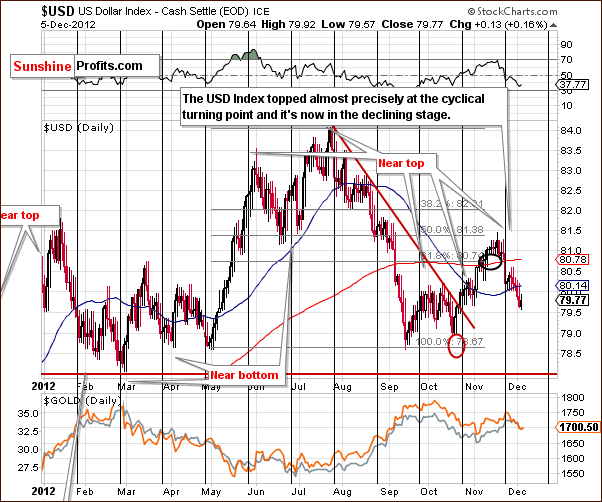
In this week’s short-term USD Index chart, we see that a top formed almost right at the cyclical turning point. With about one half of the previous decline corrected, it appears that a period of decline is once again in place here.
One concerning factor is that gold and silver moved lower along with the declines in this index. This is not a sign of strength for the precious metals. It means that the metals declined in terms of other currencies, mainly the euro. The gold-euro ratio will be discussed in a later section of this week’s Premium Update and we will get back to gold-USD relationship once again.
Summing up, the situation for the USD Index looks bearish, and this has bullish implications for the precious metals. Since no response was seen this week in gold and silver prices, however, an immediate rally may not be seen based on the above charts. Again – we will get back to the important gold-USD link in the following part of the update.
General Stock Market
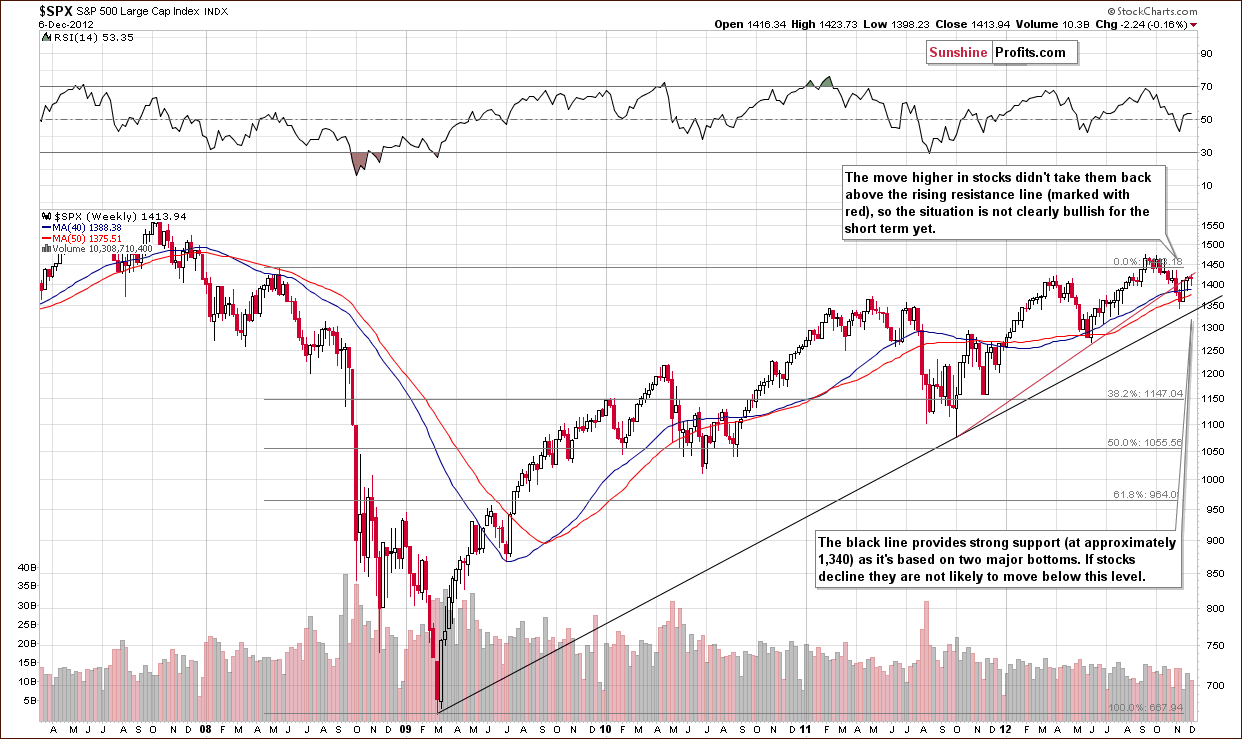
In the long-term S&P 500 Index chart (click to enlarge it), a good summary of the general stock market is seen this week so it will be our only stock chart. Prices moved lower but only by .16%, so they are very little changed from last week and the comments in ourNovember 30 Premium Update are still up-to-date:
Stock prices are now at the previously broken support line which is now a resistance line. There has not been a move above this line so the situation cannot be described as clearly bullish but rather simply mixed. If stocks do decline, it seems unlikely that they will move below their November low. Right now a strong long-term support line resides at this price level. In our view, the medium-term outlook remains favorable based on the long-term technical perspective. From the fundamental perspective, we expect to see a bigger rally once it is clear that thefiscal cliffwill be avoided thanks to monetary easing.
Gold & Silver Correlations
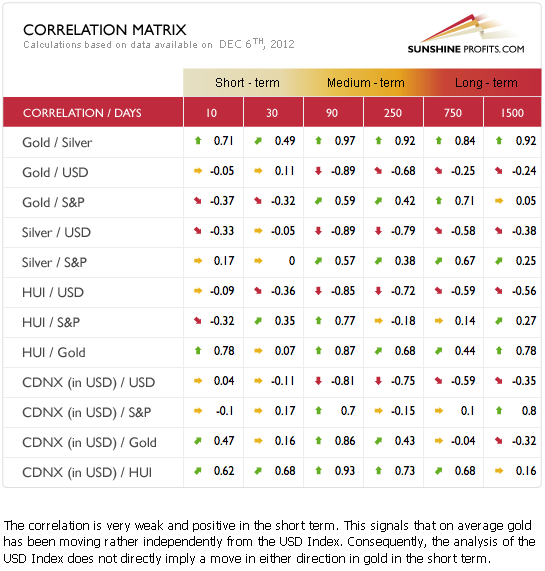
The Correlation Matrix is a tool which we have developed to analyze the impact of the currency markets and the general stock market upon the precious metals sector. Gold and silver have been moving independently of both the USD Index and the general stock market in the past 30 trading days (on average). With no clear implications from stocks this week (the picture is mixed), there is really no conclusive information in this week’s Correlation Matrix.
Gold
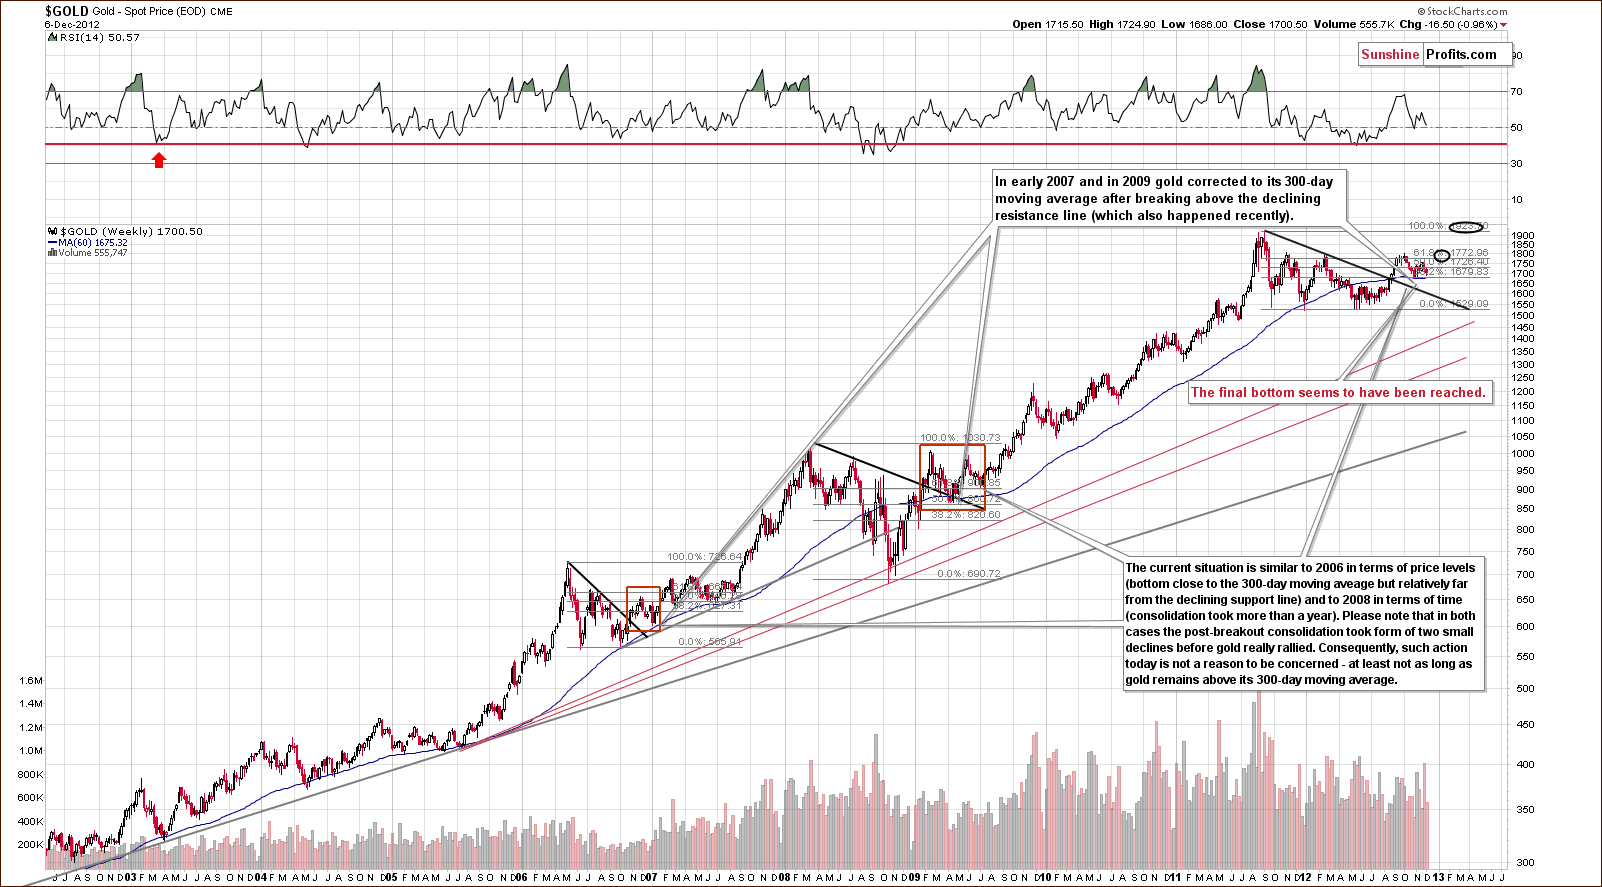
In gold’s very long-term chart, we have seen a period of consolidation and the formation of the handle in the cup-and-handle pattern. Interestingly, recent price patterns have been quite similar to what was seen in 2009 and in the 2006 to early 2007 period. After breaking above the declining resistance line, consolidating, and declining once again, periods of significant rally followed in both years.
It seems we could be seeing this type of price pattern once again. The second bottom which was formed in 2007 was below the first, whereas in 2009 the second bottom was a bit higher. In both cases, however, the bottom formed above the 300-day moving average. This points to a bullish picture here in 2012 as gold is very close to the 300-day moving average which implies that a local bottom is close or may have already formed.
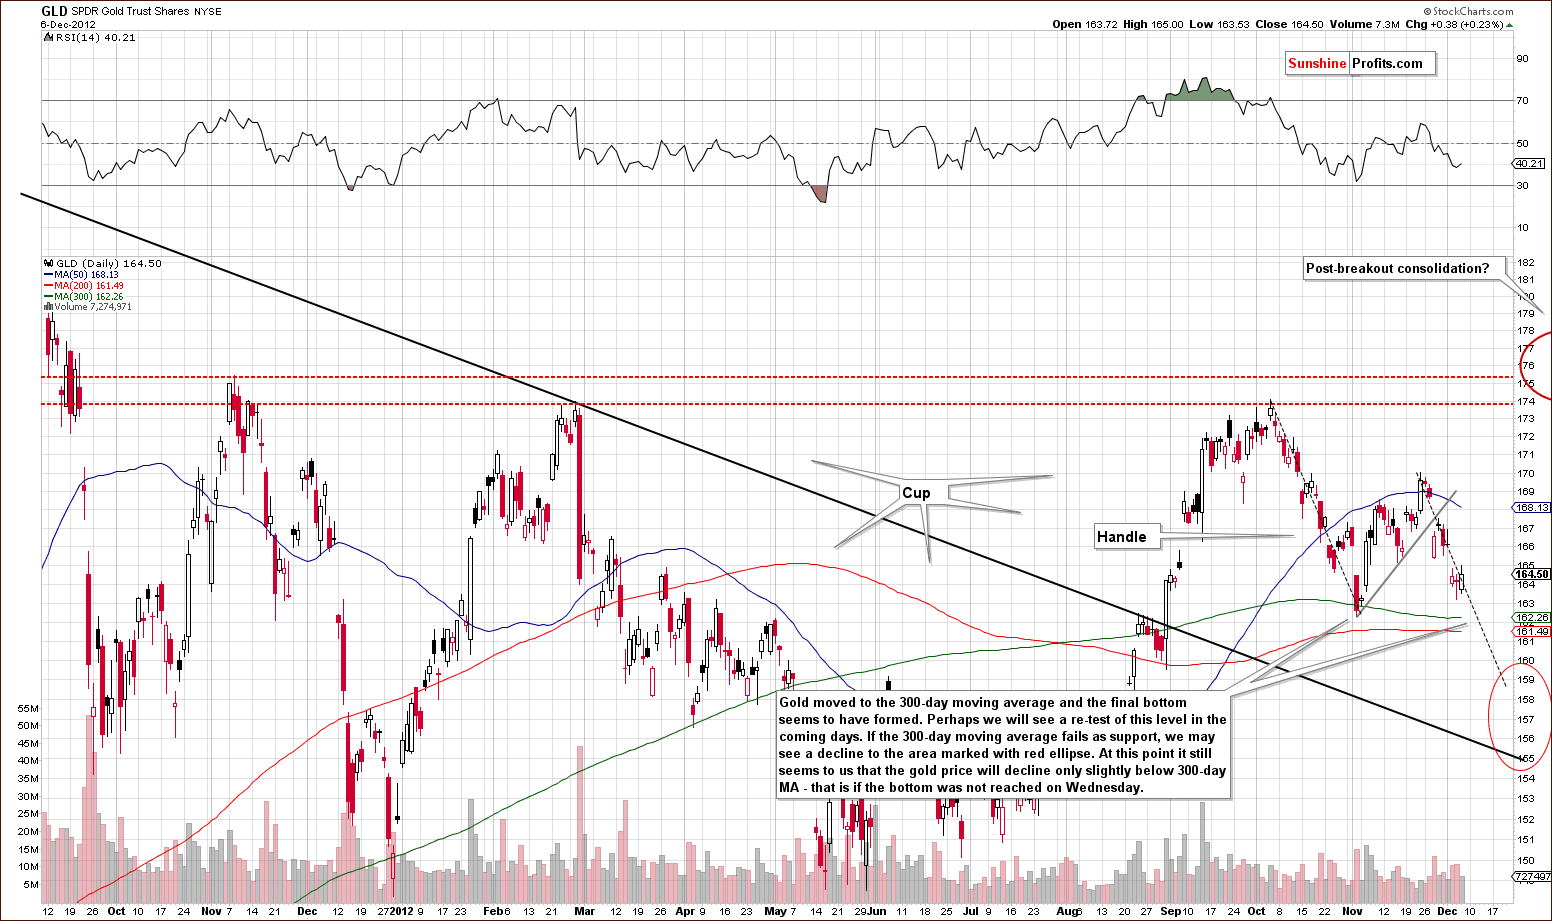
A look at this week’s medium-term GLD ETF chart shows us not quite as bullish a picture. The 300-day moving average has not been broken or even reached so we could see another $2 decline here (about $20 for spot gold). Such a move could be seen without breaking the strong support line. Gold has broken below its rising short-term support line, and if the decline is symmetrical, as is often the case, then we could see additional declines here.
The short-term outlook is not as bullish as what was seen from a long-term perspective. Gold could move below the 300-day moving average and not confirm the move, say close below it for 2 days and then move up with a vengeance.
The local bottom seems to be close, and we are awaiting confirmation so as to then add to long speculative positions. When gold prices finally begin to move higher, it seems probable that the October high will be surpassed, then some consolidation seen, with higher prices to follow.
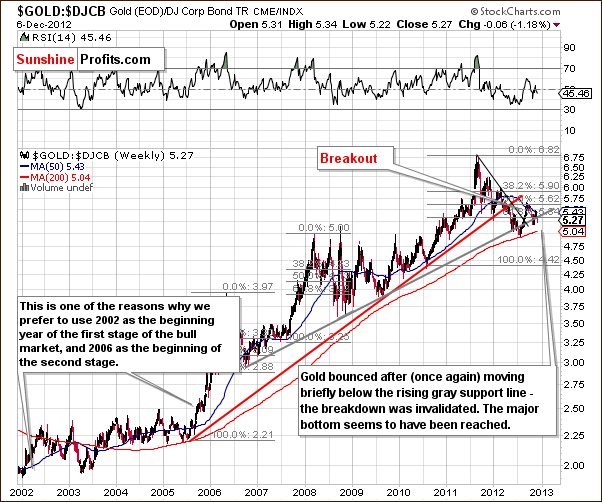
In the gold to bonds ratio chart, a small move was seen below the rising gray support line, but this was invalidated. Overall, this chart is unchanged (since last week) and the medium-term outlook remains bullish.
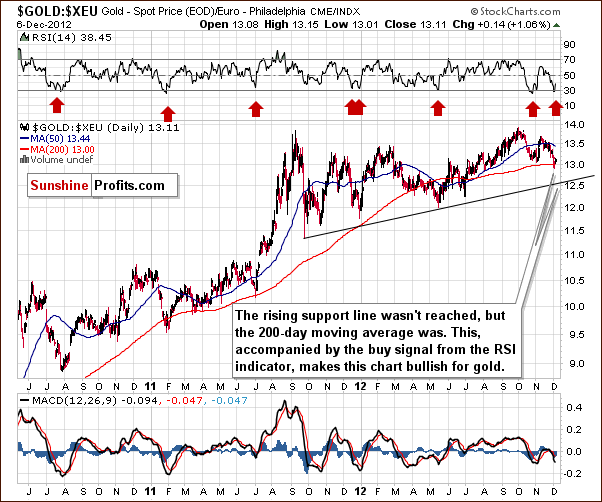
On the above chart you can see gold priced in euro - we mentioned it earlier in this week’s Premium Update, we see that the 200-day moving average support line has been reached. This level has been above local bottoms many times in the past. More importantly, the RSI has touched 30 and this has usually been quickly followed by rallies (note red arrows in the upper part of the above chart) in the past so the local bottom may already be in here.
The above chart is important not only because of the signals that we can directly see and that we described in the above paragraph. It’s important also because the decline that you can see in the last few weeks is directly linked to the simultaneous decline in the USD Index and the price of gold. Since the decline is likely over (support level being reached, buy signal from the RSI indicator), the same should be the case with the lack of positive reaction in gold to dollar’s weakness. The USD Index declines could now begin to impact gold prices, and they could start to move higher any time now.
The limitation of the above analysis is that it doesn’t have to be precise on a very short-term basis. In fact, it’s based on medium-term price moves. We could see another small move lower that would take the RSI indicator slightly below the 30 level and the above picture would not be invalidated at all – it would become even more bullish based on this factor alone. This was the case in January and December 2011.
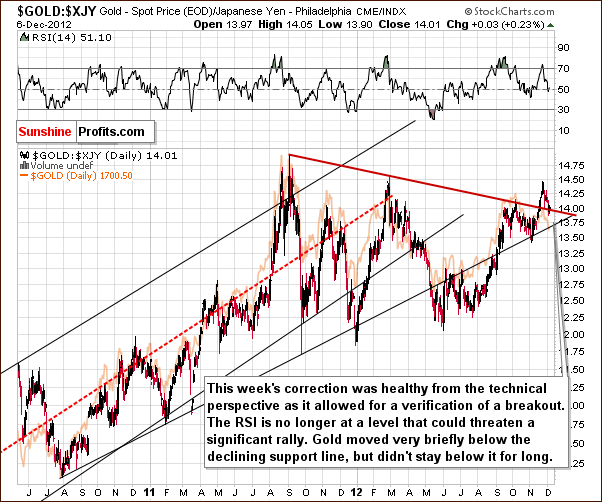
In this week’s chart of gold from the Japanese yen perspective, we see the recent breakout has been confirmed and prices now appear ready to move higher.
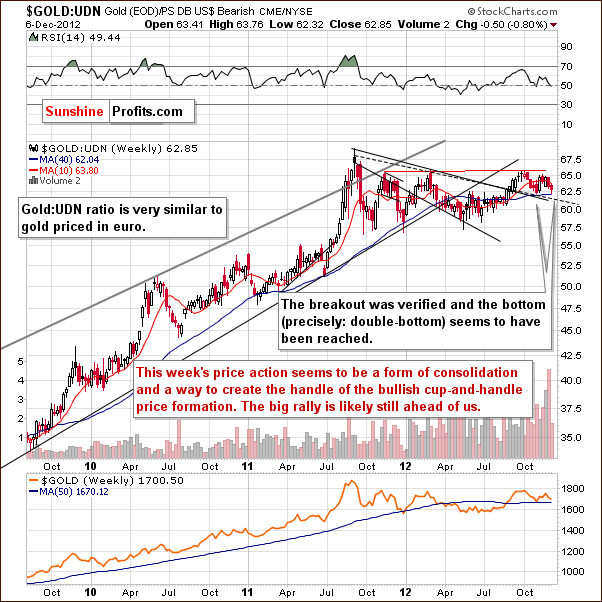
In this week’s chart of gold from the non-USD perspective, the 200-day moving average is in play as support and with the high volume levels seen last week, the picture appears bullish at this time. Please note that this chart is very similar to the one featuring gold priced in euro.
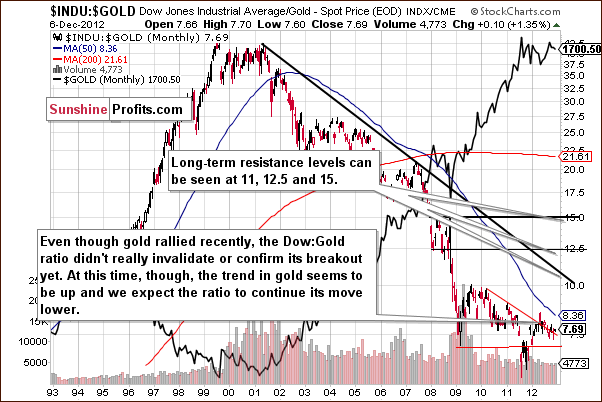
In this week’s Dow to gold ratio chart, nothing has changed. Comments made in last week’s Premium Update still hold true:
A significant move in either direction could spark a bigger move that way. If gold continues to outperform stocks, a longer period of outperforming is likely. If, however, gold underperforms stocks, a bigger period of underperformance will likely be seen. We expect gold to outperform stocks, and it seems that a big move will soon be seen with this ratio declining sharply.
Summing up, while there are some bullish implications for gold especially for the long term and medium term, the short-term outlook is far from crystal clear. Although significant declines seem unlikely, prices could move a bit lower before the next significant rally begins. The 300-day ($1,673) moving average will likely provide strong support and we don’t expect it to be successfully broken. If it is broken, we don’t expect gold to stay below it for long (not longer than a month or so). Even though we remain bullish on gold for the medium term, we believe that being prepared for a move even to $1,610 - $1,640 is a good idea.
Silver
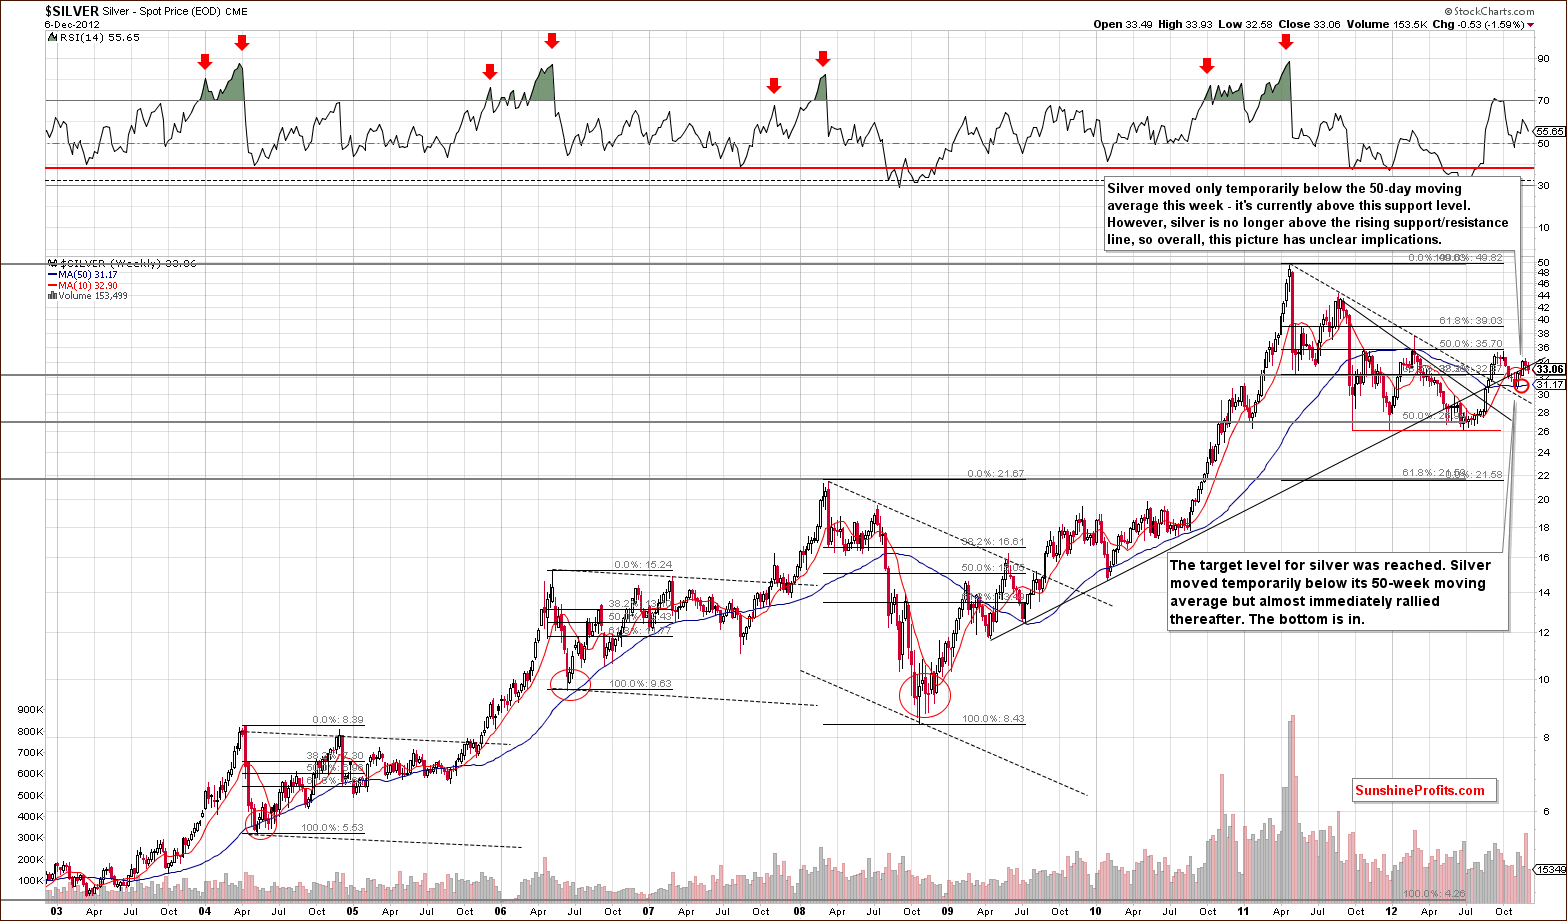
We begin our silver section with a look at silver’s long-term chart where the picture is somewhat mixed this week. Silver has traded between two support-resistance levels with prices above the 50-day moving average but below the rising support-resistance line. With both bullish and bearish factors in place, all-in-all, the outlook is mixed. We don’t have much technical signals on the silver market this week.
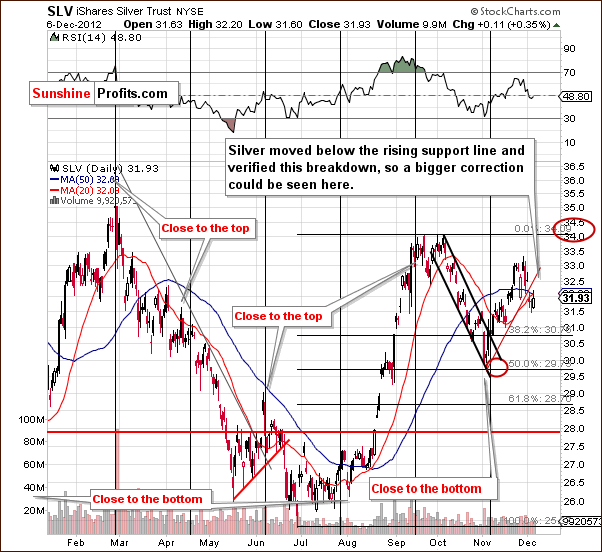
In the short-term SLV ETF chart this week, we see that prices are below the 50-day moving average, and the picture is inconclusive here. On the silver chart and based on weekly closing prices, silver is above this moving average. Therefore both: breakout and breakdown below this line are unconfirmed – we simply need to wait for more conclusive signals.
Three consecutive closes below the rising support line have been seen so the breakdown is confirmed. Sharp declines to the first or second Fibonacci retracement levels are possible now. This would likely provide a great buying opportunity, and we will continue to monitor this and notify you accordingly.
Summing up, the picture for the white metal is mixed this week based on the long and short-term charts. The short-term SLV ETF chart actually has bearish implications for the short term.
Platinum & Palladium
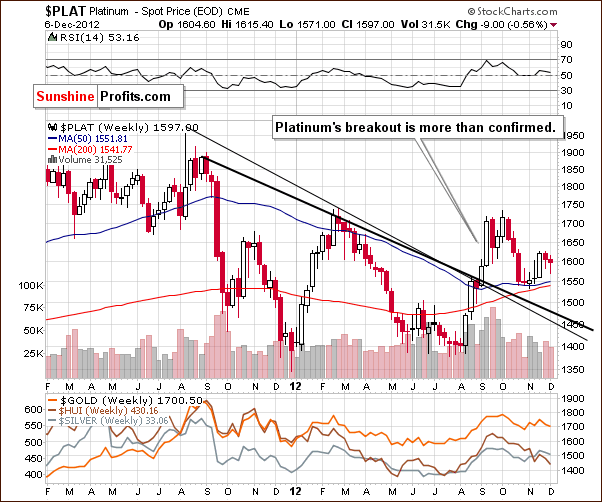
We now take a look at the medium-term chart for platinum. The picture is bullish here as no invalidation of the recent breakout has been seen. Prices have actually held quite well here while price declines have been seen for most of the precious metals in recent weeks.
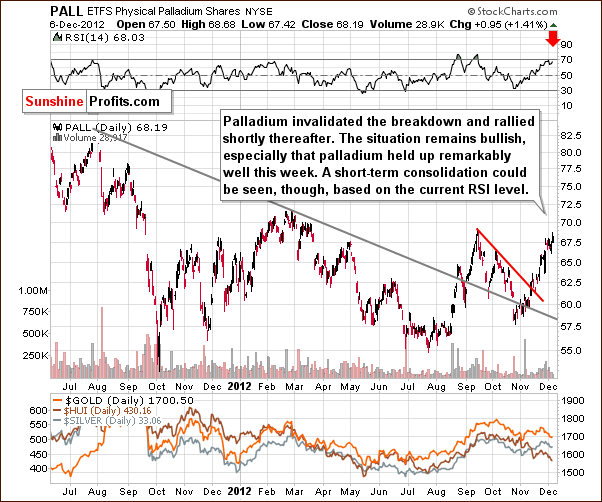
Turning to this week’s medium-term palladium chart, the outlook remains bullish as the breakout has been more than verified and higher prices have been the norm for several weeks now. Palladium’s prices have fared even better than platinum’s of late and have approached their September highs. This is far from the case for gold, silver, platinum, or the mining stocks which are all well below their September price levels. The RSI indicates that a pause in the recent rally is likely here so caution seems warranted with respect to opening speculative long positions in palladium for those inclined to do so.
Summing up, the technical picture for platinum and palladium is favorable which has bullish medium-term implications also for the rest of the precious metals sector.
Mining Stocks
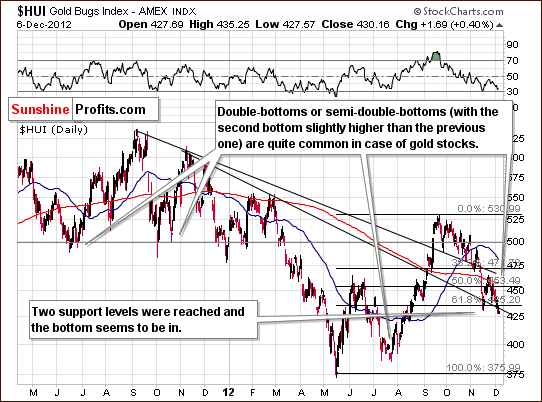
In this week’s medium-term HUI Index chart, we see that gold stocks moved to the declining support line, a bit below it and are now right at it, though this is not easily visible in this chart. The index level is below the final Fibonacci retracement level, which is bearish for the short term, but with the RSI close to 30 it seems that the local bottom could be close.
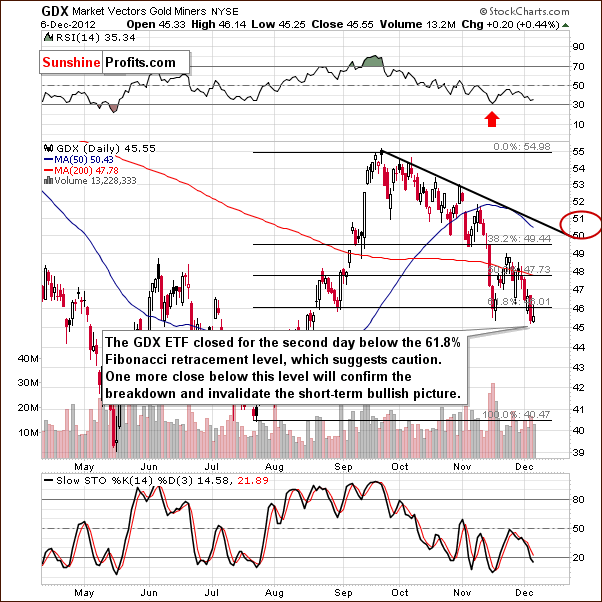
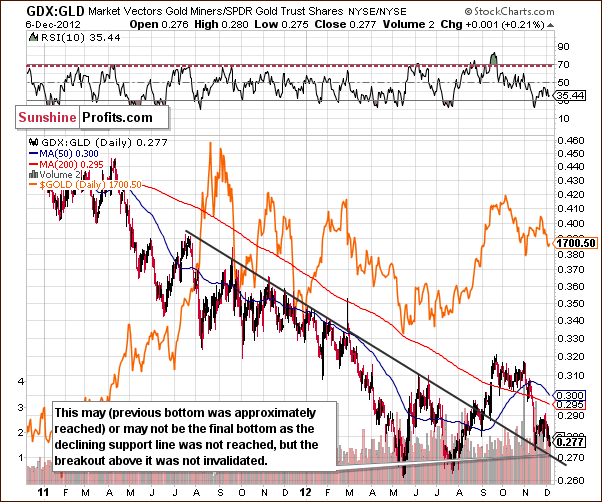
In the GDX ETF short-term chart, we see a picture which is a bit clearer. Based on the July to September rally, the miners have moved below the final Fibonacci retracement level and closed there twice. The breakdown will be confirmed with one more close and additional declines could then follow. The picture is not bullish and the short-term implications are bearish. If, however, gold moves higher (as the gold: euro analysis indicates), a rally to $50 or $51 could be seen with a consolidation to follow.
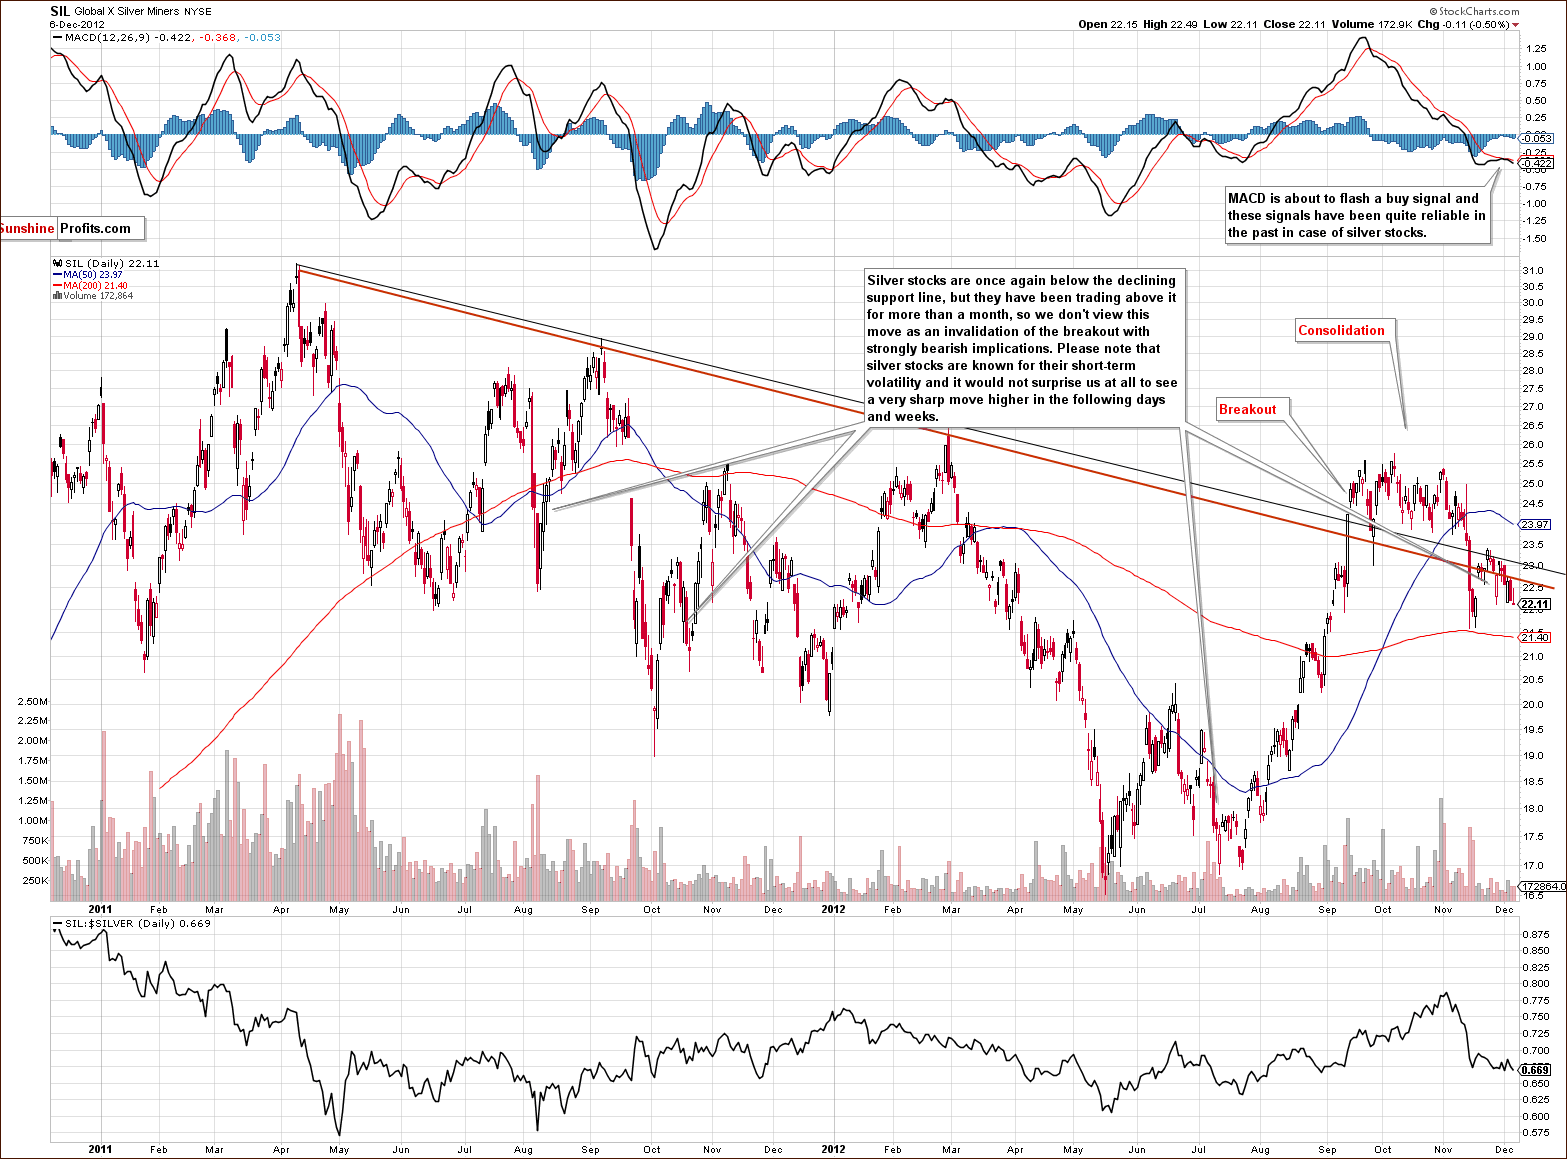
This week we again include the chart featuring silver stocks (precisely: Global X Silver Miners ETF). The MACD indicator based on this ETF is about to flash a buy signal – however since that was the case a few times in the past weeks (that was “about” to flash the buy signal) we will wait for the signal to really materialize before saying that the picture is not clearly bullish
Still, the picture here is already more bullish than not as only a small part of the July to September rally has been corrected – as compared to the correction seen in gold and gold stocks.
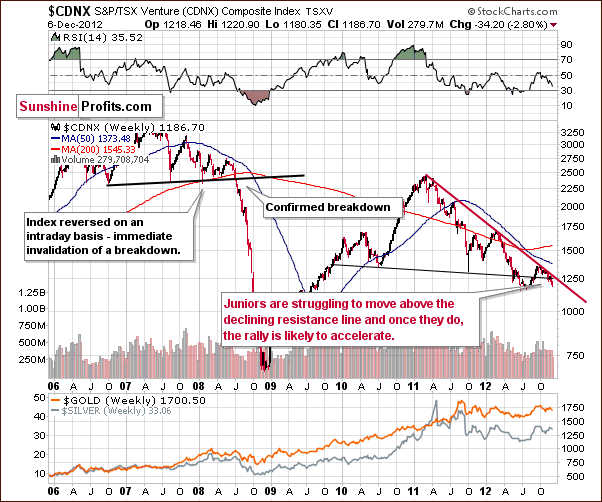
In the Toronto Stock Exchange Venture Index (which is a proxy for the junior miners as so many of them are included in it), no breakout has been seen above the declining resistance line. The index is now closer to the previous bottom. It appears that once the breakout is confirmed, a huge rally is possible. This current (late 2012) consolidation and price swings will then seem to be quite irrelevant. The downside seems limited by 2012 low, and the upside is significant given an almost 2-year long consolidation.
In the miners to gold ratio chart, we see a move to the previous bottom but not to the declining support line. The latter is a much stronger support line and could in fact be reached. The picture is inconclusive and consequently being partly out of speculative long positions in the miners seems to be a good idea today.
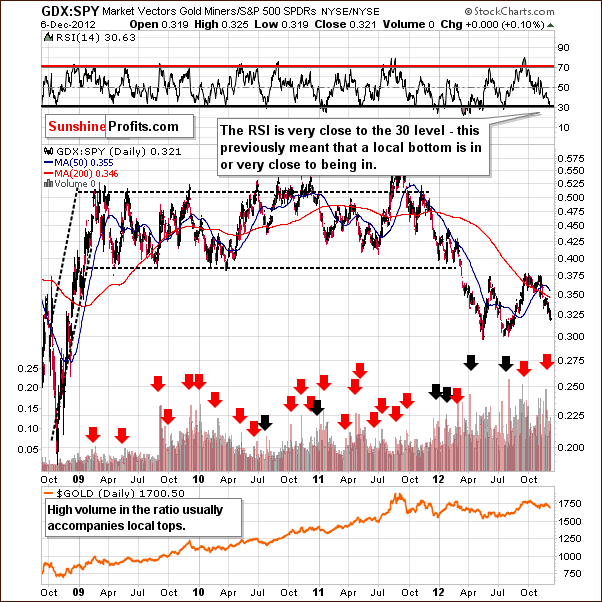
In the GDX to SPY ratio (miners’ performance relative to other stocks) this week, it seems that we are close to a buy signal. The RSI is very close to 30 and in the past, a local bottom soon followed both here and in the precious metal sector. While prices could still move a bit lower, the final bottom may be up to a week or so away.
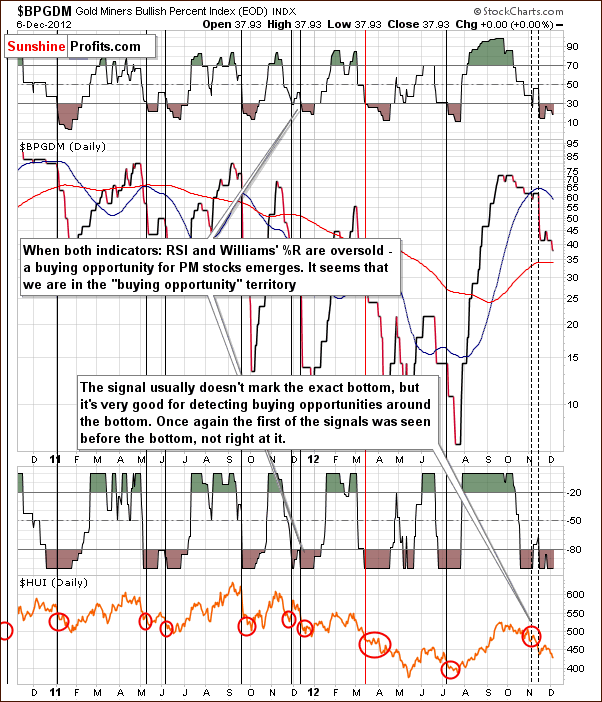
In the Gold Miners Bullish Percent Index chart, we still have a situation where both the RSI and Williams’ % R indicators are oversold. In a few months’ time, the HUI Index price levels today could be viewed as quite low. This appears to be a real possibility based not only on this index but also on the market situation for precious metals in general as well as the consolidation which has been seen for the better part of the past year.
Summing up, there appears to be much uncertainty as to when prices will finally begin to rise. While there are some bullish signals present, there are also a number of bearish indicators as well. Based on the above, it is simply not clear at this time when the miners will begin their next serious rally.
Junior Mining Stocks Ranking
As stated in the Gold & Silver Portfolio report, the list of top juniors will be updated approximately every 4 weeks, usually at the beginning of the month. As mentioned above, the situation in the junior sector currently looks favorable as the upside potential is huge compared to the limited downside. Let’s see which juniors are particularly likely to provide you with high profits in the coming months.
As a reminder, in our view, one of the most important considerations when choosing junior mining stocks is their performance relative to the rest of the sector and also their strength during a decline and the subsequent bounce. For juniors, we can’t apply as sophisticated algorithms as with senior gold stock rankings and silver stock rankings because the market is too small in each junior’s case and the small price moves may not properly reflect the stocks’ true value. It is for this same reason that junior mining stock prices can be manipulated more easily (diversify to lower the risk of being affected!). And it is also why we don’t analyze individual juniors from the technical perspective on a regular basis.
See the results of our latest research on juniors in the tables below:
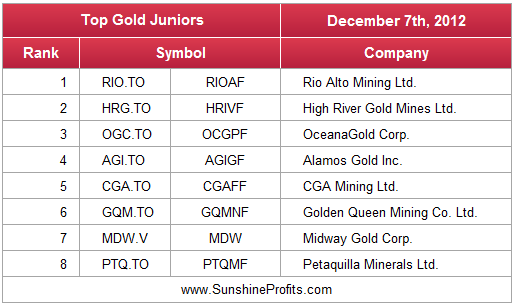
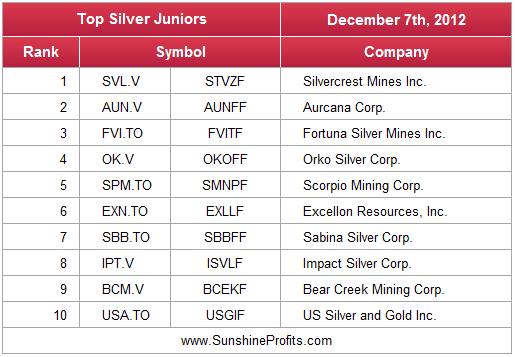
There have been only a few changes since last month’s rankings – most of them in case of silver juniors. Dynasty Metals & Mining was removed from the gold list and in case of silver juniors Excellon Resources, Inc., replaced Great Panther Resources Ltd. (Excellon – unlike Great Panther – held up very well in the past few weeks).
Please keep in mind that we updated the dataset for calculations 2 months ago and companies that we had featured in the previous months are still in the ranking. This implies that the fundamentals behind companies are most likely solid as they consistently perform well. This does not refer to each company individually because they all have their ups and downs, but to all of them at the same time – they seem to average out each other’s downs and ups and at the same time provide good profit potential – which is exactly what we strive for when constructing a juniors portfolio.
Letters from Subscribers
Q: Thanks for your insight on precious metals. You are right, it is kind of volatile at the moment. But I have a strong feeling on the movement in gold, and I am interested to see the US non-farm employment rate this coming Friday. If the figure is disappointing, then gold will rally again. If the number is optimistic or good, then gold will definitely head down, and probably to 1680 this time. Any comments or perspectives about gold would be greatly welcomed. Kind regards.
A: Gold could indeed rally on Friday or in the following days, however in our opinion it doesn't necessarily have to happen based on the US non-farm employment rate. There are at least several statistics that are published daily (globally) and each of them could be the spark that ignites the rally. We are in a bull market based on a strong fundamental case and we have already seen a lengthy consolidation - a rally is to be expected here. The US non-farm employment rate is one of the most important statistics as it's a leading indicator.
As far as the direct effect is concerned, we are not certain if gold would react positively to a disappointing report, as investors currently might view gold as a "risk asset" that would move in tune with the stock market. Right now the short-term correlations between gold and stocks are inconclusive.
Q&A: We also received a link to the following article, in which the author suggests that cash is the place to be (not gold and silver):
http://offgridsurvival.com/cashisking-preciousmetals/
The reason provided is that in case of a disaster, local shops and everyone else will take cash, but refuse to accept payment in gold and silver.
Our take is that it doesn't invalidate our views on the precious metals portfolio at all, as we suggest keeping some money in cash anyway.
It doesn't invalidate the bullish case for gold and silver either, because it simply stresses the need to have some paper cash on hand just in case it's necessary. Such "temporary" liquidity needs are just a tiny fraction of the total portfolio, so the form of this liquidity reserve has little impact on the total asset allocation.
In terms of the temporary liquidity needs - as indicated in the article - one might indeed keep some money in cash and some in silver bullion coins to make sure you got what is required to make purchase, be it cash or hard money.
Q1: (…) Without ETFs being purchasable using direct registration it may all go down with everything else like SLV fraud. Not too sure what side Radomski is really on, but I do think it pays to get his opinion (but not to always use it!). (…) Whose side is he on?
A1: We represent the side of our clients - we take no advertisements on the website and we aim to be as objective in providing you with information and analysis as possible. What conflict did you mean exactly by writing about sides?
Q2: The bankers/government side (JP Morgan/ Goldman Sachs/ NWO) plan to loot everyone by leaving them in worthless paper whether it be dollar bill Fed notes or stock certificates that wind up being the property of (officially) bankrupted brokerage firms (and not the property of the person who bought the stock (or the ETF, on Radomski’s advice)).
A2: We are no part of such conflict. We are analysts that work for you and want you to be happy with your portfolio and its results under as many different scenarios as possible. The event that you predict (we're not saying that it won't happen - it could be the case) is something that we suggest being insured against through physical gold/silver ownership. In case the dollar collapses, you should also be protected by physical gold and silver ownership (neither ETFs nor ETNs should be bought for this category). Please see our Portfolio Structuring report for details. Also, please note that ETFs and ETNs are NOT highly ranked in our ranking as far as long-term investment is concerned. We do think, however, that these funds offer significant advantages for traders (and we suggest using only a relatively small part of your total portfolio for each trade).
Summary
The USD Index is now likely in a downtrend and the outlook for stocks is somewhat unclear. An important development this week saw precious metal prices decline in spite of the dollar’s weakness and this is not a good sign for the sector.
Looking at the relationship from the Euro Index perspective, we see that gold and the USD Index declined at the same time, and this means big declines in terms of the euro. The gold-euro chart shows that from a technical perspective, the declines appear to be over or close to it. So the fact that the USD Index seems ready to decline further could begin to be a bullish factor for the precious metals though this has not yet been seen.
The short-term picture for gold, silver and mining stocks is a bit unclear. All parts of the sector have reached weak support lines with stronger support in place at lower price levels. Most important is the 300-day moving average for gold (currently at $1,673), and it seems that even if reached, any breakdown would be invalidated quickly and a significant medium-term rally would follow. So while preparing to add to long positions, being out with one half of speculative capital seems to be a good idea today. The other half can remain based on our SP Indicators which have flashed buy signals recently. Finally, for the long term, it seems that holdings in precious metals continue to be a good idea.
Trading – PR: No position
Trading – SP Indicators: Long position in gold, silver and mining stocks with an additional weekly trade in mind (unless another buy signal is seen in the coming week that is)
Long-term investments: Remain in the market with your precious metals holdings
| Portfolio's Part | Position |
|---|---|
| Trading: Mining stocks | Long (half) |
| Trading: Gold | Long (half) |
| Trading: Silver | Long (half) |
| Long-term investments | Long |
As we like to over-deliver in our promises, we decided to keep sending you Market Alerts on daily basis at least until the end of December with the exception of Fridays, when Premium Updates are posted (we will issue an alert if what we wrote in the update becomes outdated on the same day it is posted, though).
This completes this week’s Premium Update. Our next Premium Update is scheduled for December 14, 2012.
Thank you for using the Premium Service. Have a profitable week and a great weekend!
Sincerely,
Przemyslaw Radomski, CFA

